. 2023 Sep 8;8(87):eadf4968.
doi: 10.1126/sciimmunol.adf4968. Epub 2023 Sep 8.

Preexisting tumor-resident T cells with cytotoxic potential associate with response to neoadjuvant anti-PD-1 in head and neck cancer

Affiliations

Preexisting tumor-resident T cells with cytotoxic potential associate with response to neoadjuvant anti-PD-1 in head and neck cancer

Giacomo Oliveira et al. Sci Immunol. .

Abstract

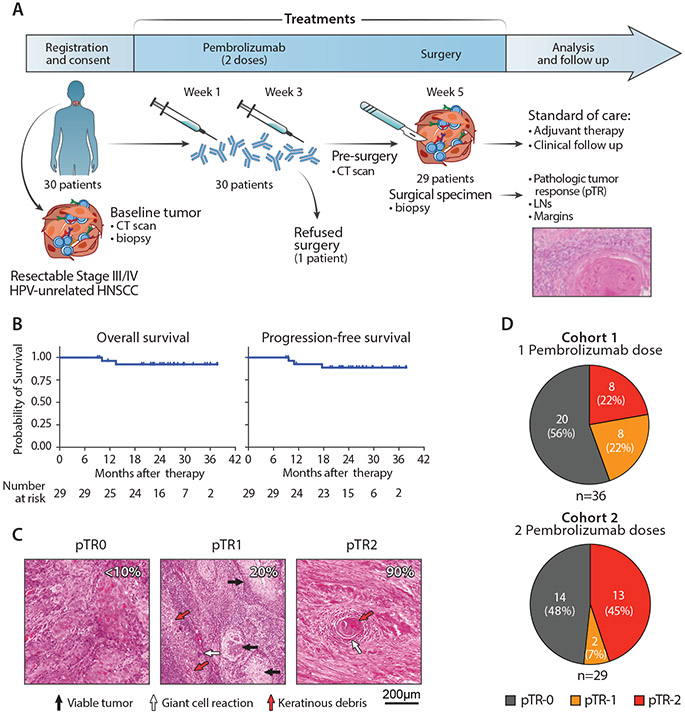
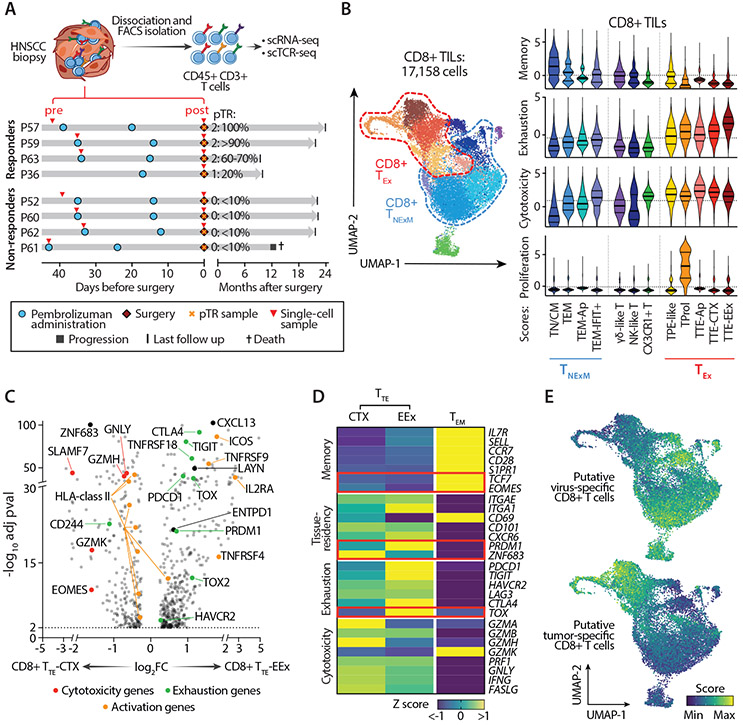
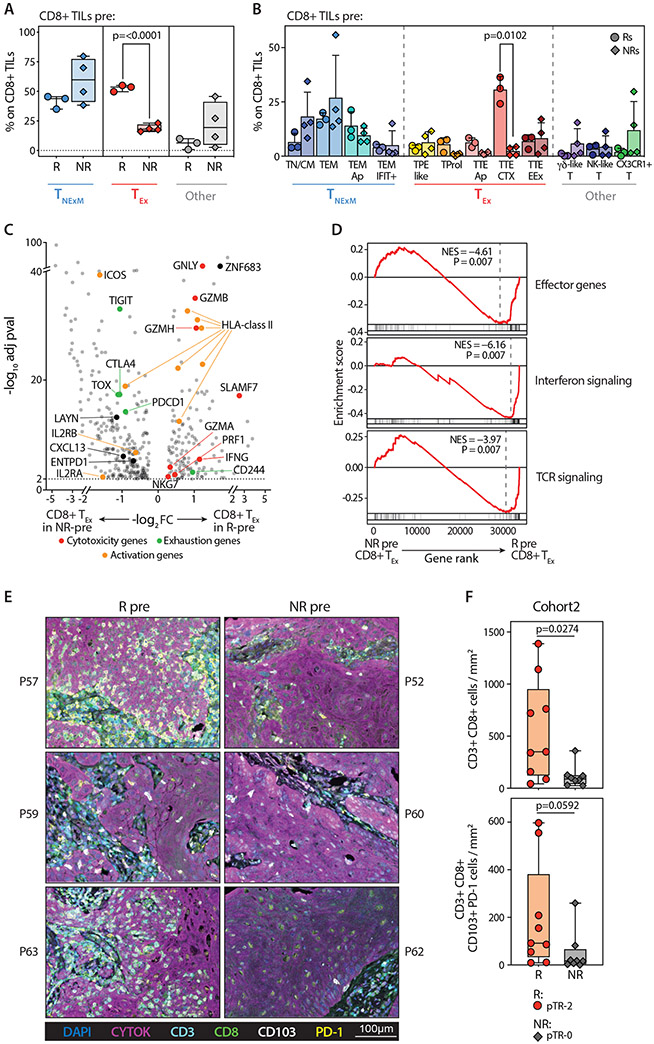
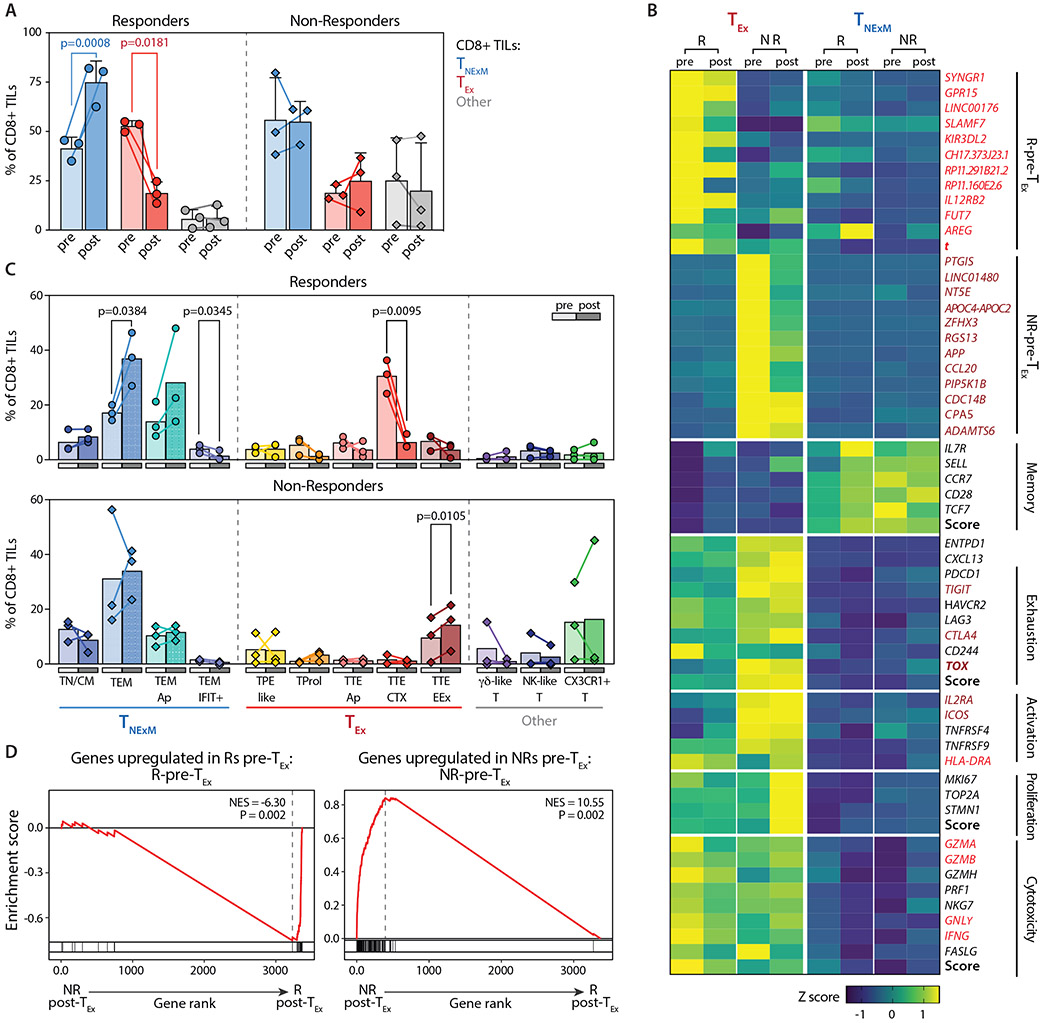
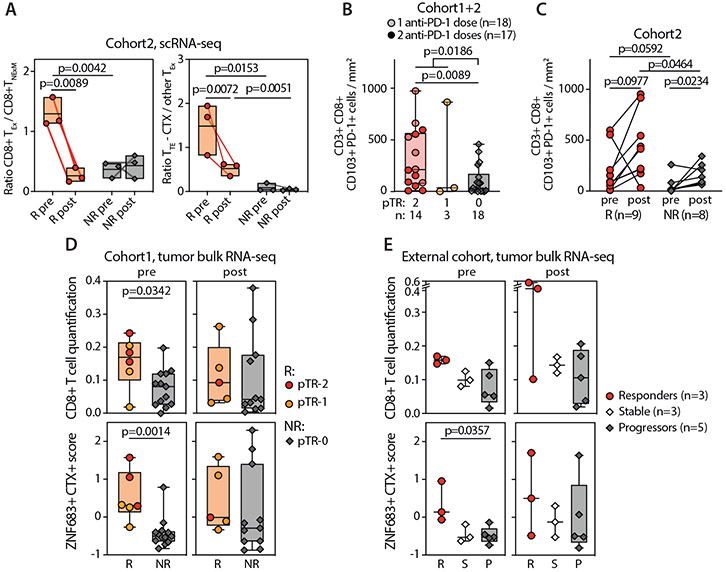
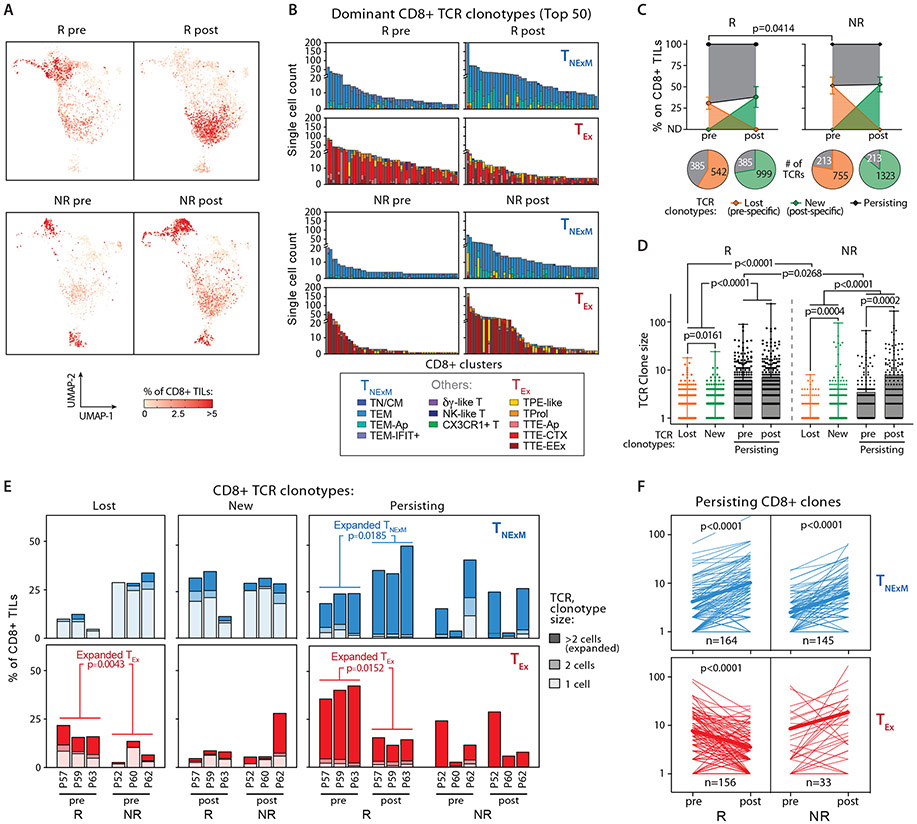
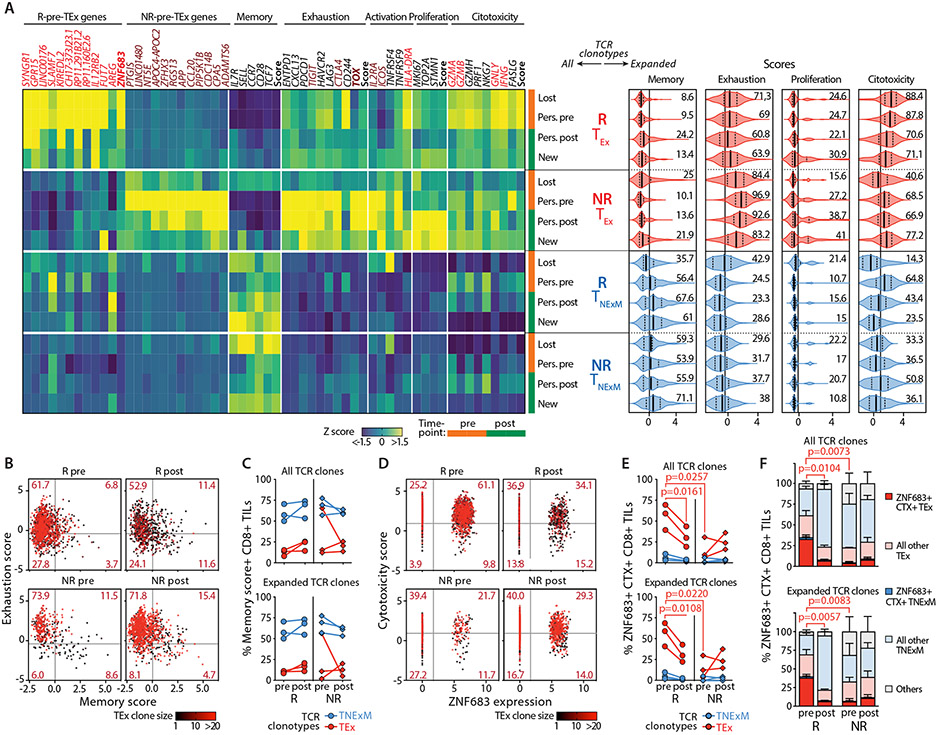
About 50% of patients with locally advanced head and neck squamous cell carcinoma (HNSCC) experience recurrences after definitive therapy. The presurgical administration of anti-programmed cell death protein 1 (PD-1) immunotherapy results in substantial pathologic tumor responses (pTR) within the tumor microenvironment (TME). However, the mechanisms underlying the dynamics of antitumor T cells upon neoadjuvant PD-1 blockade remain unresolved, and approaches to increase pathologic responses are lacking. In a phase 2 trial (NCT02296684), we observed that 45% of patients treated with two doses of neoadjuvant pembrolizumab experienced marked pTRs (≥50%). Single-cell analysis of 17,158 CD8+ T cells from 14 tumor biopsies, including 6 matched pre-post neoadjuvant treatment, revealed that responding tumors had clonally expanded putative tumor-specific exhausted CD8+ tumor-infiltrating lymphocytes (TILs) with a tissue-resident memory program, characterized by high cytotoxic potential (CTX+) and ZNF683 expression, within the baseline TME. Pathologic responses after 5 weeks of PD-1 blockade were consistent with activation of preexisting CTX+ZNF683+CD8+ TILs, paralleling loss of viable tumor and associated tumor antigens. Response was associated with high numbers of CD103+PD-1+CD8+ T cells infiltrating pretreatment lesions, whereas revival of nonexhausted persisting clones and clonal replacement were modest. By contrast, nonresponder baseline TME exhibited a relative absence of ZNF683+CTX+ TILs and subsequent accumulation of highly exhausted clones. In HNSCC, revival of preexisting ZNF683+CTX+ TILs is a major mechanism of response in the immediate postneoadjuvant setting.


Figures

Fig. 1.
Fig. 1.. Outcome of neoadjuvant PD-1 blockade in patients with HNSCC.
(A) Scheme of treatment and outcome analysis. After enrollment and screening, patients with HNSCC received 2 doses of anti-PD-1 before surgery. Resected tumors specimens were assessed for the rate of response as part of pathologic staging. (B) Kaplan-Meier curves estimating the overall survival (left) and progression-free survival (left) of 29 patients with HNSCC who received 2 doses of neoadjuvant PD-1 blockade and surgery. Time from surgical resection is presented as months elapsed. The number of evaluated at-risk patients is reported below each graph. (C) Hematoxylin-eosin staining of tumor biopsies collected at surgery from 3 representative patients with different levels of pTR (quantification indicated by white numbers). Arrows - representative areas with viable tumor cells (black), giant cell/histiocytic reaction (white) or necrotic cells/keratinous debris (red). (D) Rates of pTR in patients treated with 2 neoadjuvant doses of anti-PD-1 antibodies (this study, right, n=29) compared with patients who received a single dose, as previously reported (3) (left).
Fig. 2.
Fig. 2.. Characterization of CD8+ TILs in HNSCC.
(A) Scheme of collection and processing of TILs for single-cell analysis. Clinical courses of 4 Rs and 4 NRs are represented. Red arrows - time of collection of the tumor biopsies profiled at baseline (pre) or at surgery after PD-1 blockade (post). pTR assessed at tumor resection is reported. (B) Classification of CD8+ HNSCC-TILs. UMAP of the transcriptionally-defined clusters from the scRNA-seq data (left), as denoted by colors. Right plots - The inferred cell states (x axis), colored to match the UMAP clusters. Cells from each cell state are scored for expression of memory, exhaustion, cytotoxicity and proliferation genes (see Materials and Methods), with medians and quartiles indicated (thick and thin horizontal lines, respectively). Horizontal dashed lines - average scores within the entire dataset of CD8+ TILs. (C) Differentially expressed genes for all cells in CD8+ TTE with cytotoxic characteristics (TTE-CTX) (left) and CD8+ TTE with extreme exhaustion programming (TTE-EEx) (right) clusters. Dots denote genes with adj-pval<0.01 (two-sided Wilcoxon Rank Sum test). Representative genes are labeled, with colors corresponding to gene-functions (legend). (D) Heatmap reporting variation (expressed as Z-score) in average gene-expression measured in exhausted TTE-CTX, TTE-EEx or control TEM CD8+ TILs. Qualitative differences are reported for representative T cell-related genes, divided based on their known function (left). Key transcriptional factors are highlighted in red. (E) UMAPs of CD8+ TILs colored based on enrichment of published gene-signatures associated with CD8+TILs with validated antiviral (top) or antitumor (bottom) reactivity (14). Abbreviations: TN/CM: naïve/central memory TILs; TEM: effector memory TILs; TPE-like: enriched in progenitor exhausted TILs; TProl: proliferative TILs; TTE: terminally exhausted TILs; CTX: cytotoxic; EEx: extremely exhausted; Ap: apoptotic; TNExM: non-exhausted memory TILs; TEx: Exhausted TILs.
Fig. 3.
Fig. 3.. CD8+ TILs before PD-1 blockade in responder and non-responder patients
(A) Frequencies of principal phenotypes among CD8+ TILs collected from Responders (R, circles, n=3) or Non-Responders (NR, diamonds, n=4) at pre-treatment timepoints (Pre). Box plots - median percentage of TILs with phenotypes corresponding to CD8+ non-exhausted memory cell states (TNExM, blue), exhausted states (TEx, red), or unclassified clusters (Other, grey; see Fig. 2B). Whiskers: min-max values; horizontal bars: medians. Boxes: 25th-75th percentiles. P values: significant comparisons (two-tailed Welch’s t-test). (B) Proportions of CD8+ TILs from pretreatment biopsies (pre) collected from Rs (circles, n=3) and NRs (diamonds, n=4, Data File S4). Colors identify cell states, as inferred from cluster classification (Fig. 2B, Fig. S3) and are grouped based on association in primary clusters (x axis). P values of significant comparisons are shown, as calculated with two-tailed Welch’s t test. (C) Differentially expressed genes among CD8+ TEx-TILs detected in baseline biopsies in Responders (R, right, n=3) and Non-Responders (NR, left, n=3). Dots denote genes with adj-pval<0.01 (two-sided Wilcoxon Rank Sum test). Representative genes are labeled, with colors corresponding to gene-functions (legend). Genes enriched in baseline CD8+ TEx-TILs in patients with good or poor response after PD-1 blockade were selected from this comparison (log2FC>1) and included in signatures (Data File S5). (D) GSEA enrichment of the CD8+ TEx-TILs in pre-treatment biopsies from Rs (right, n=3) and NRs (left, n=3) for signatures of highly reactive T cells (10, 26, 27). P values were determined by one-tailed permutation test by GSEA. NES, normalized enrichment score. (E) Multiplexed Immunofluorescence of tumor biopsies collected prior to treatment from 3 Rs (left) and 3NRs (right) patients previously analyzed by scRNA-seq. The representative images demonstrate the pre-existing high levels of tissue resident memory-like (CD103+) and exhausted (PD1) TILs (CD3+ CD8+) in Rs within the tumor bed, marked by expression of cytokeratin (Cytok). Lower magnifications in Fig. S6B. (F) Quantification of CD3+ CD8+ TILs (top) or exhausted tissue-resident (PD-1+ CD103+) CD8+ TILs (bottom) infiltrating pre-treatment biopsies collected from 17 HNSCC before two doses of neoadjuvant pembrolizumab. Infiltrates were determined by enumerating the mean number of TILs cells in 6 representative 20× fields (see Material and Methods). Dots represent individual values in Responders (pTR-2, circles) and Non-Responders (pTR-0, diamonds), as reported in Data File S6. Number of analyzed patients and degree of pTR are reported in a legend (right). P values: significant comparisons calculated with two-tailed Mann-Whitney test.
Fig. 4.
Fig. 4.. Dynamics of CD8+ TIL subsets before and after PD-1 blockade in responder and non-responder patients
(A) Frequencies of dominant phenotypes among CD8+ TILs in HNSCC lesions collected before (pre, light colors) or after (post, dark colors) neoadjuvant PD-1 blockade (Data File S4). Dots represent individual values in Rs (n=3, circles) and NRs (n=3, diamonds), Lines connect pre-post matched evaluations for each patient. Bars - means with SD and report percentage of TILs with different primary phenotypes (TNExM, blue; TEx, red; Other, grey; see Fig. 2B). P values: significant comparisons calculated with two-tailed ratio-paired t-test. (B) Heatmap reporting variation (expressed as Z-score) in average gene-expression measured in exhausted TEx (left) or memory TNExM (right) CD8+ TILs in pre- or post-treatment tumors collected from Rs and NRs. Qualitative differences are reported for top deregulated in CD8+ TEx-TILs (as established in Fig. 3C) or for representative T-cell related genes, divided based on their known function (left). Scores summarizing expression of genes in each category are depicted (bold, see Material and Methods). Genes included in signatures determined in Fig. 3C (see Data File S5) and enriched in R-Pre-TEx-TILs or NR-Pre-TEx-TILs are labeled in red and brown respectively. Key transcriptional factors are highlighted in bold. (C) Comparison of frequencies of CD8+ TIL-subsets analyzed before (pre: light colors) or after (post: full colors) treatment (Data File S4). Bars shows mean values, as measured in Responder (circles, top, n=3) and Non-Responders (diamonds, bottom, n=3) with available matched tumor biopsies. Colors identify cell states, which are grouped based of association in primary clusters (x axis, see Fig. 2B)). Significant P values calculated using two-sided paired t-test are shown. (D) GSEA enrichment for signatures predictive of response, enriched in R-Pre-TEx-TILs (top) or NR-Pre-TEx-TILs (bottom), as previously assessed (see panel Fig. 3C, Data File S5). Normalized enriched score (NES) is inferred comparing CD8+ TEx-TILs in post-treatment biopsies from Responders (right, n=3) or Non-Responders (left, n=3). Results show that signatures determined before therapies are still enriched in corresponding responder or non-responder patients after immunotherapy. P values were determined by one-tailed permutation test by GSEA.
Fig. 5.
Fig. 5.. Quality and quantity of TILs in pre-treatment HNSCC associate with pathologic tumor response after neoadjuvant PD-1 blockade
(A) Summary of quantitative and qualitative differences in putative tumor-reactive CD8+ TEx-TILs detected before or after neoadjuvant PD-1 blockade, as established in patients with available paired scRNA-seq (see Fig. 2A). Box plots - ratios (Data File S4) calculated using the frequencies of putative-tumor reactive CD8+ TEx and memory CD8+ TNExM (left) or expressing the relative proportion of cytotoxic terminal exhausted CD8+ TILs (TTE-CTX) over other CD8+ TEx subsets (right). Dots - individual values in Rs (n=3, circles) and NRs (n=3, diamonds), with lines connecting pre-post matched evaluations for each patient. P values: significant comparisons calculated with two-tailed unpaired t-test (R vs NR) or with two-tailed paired ratio t-test (pre vs post). (B) Enumeration of tissue-resident (CD103+ PD-1+) CD3+ CD8+ T cells infiltrating HNSCC specimens collected at pre-treatment timepoint from 35 patients, classified based on the extent of pathological tumor response (pTR) assessed after one (lighter shaded) or two (darker shaded) doses of neoadjuvant anti-PD-1 (cohort 1 and 2, Data File S6). Significance was calculated between Rs and NRs (pTR-1/2 vs pTR-0) or between pTR2 and pTR-0 with two-tailed Mann-Whitney test. (C) The same analysis was performed for 17 patients with available tumor specimens collected before or after two doses of pembrolizumab (cohort 2, Data File S6). Quantification of TILs was performed through immunofluorescent staining, analyzed as reported in Materials and Methods section. P values: significant comparisons calculated with two-tailed Mann-Whitney test (for group comparisons) or with two-tailed paired t-test (for pre vs post). (D) Analysis of gene-expression profile of HNSCC biopsies collected before or after neoadjuvant PD-1 blockade in patients treated with a single dose of pembrolizumab (cohort 1), as previously reported (3). Tumor bulk RNA-seq was analyzed as described in Materials and Methods section, to quantify CD8+ T cells (top) or to evaluate the level of expression of ZNF683 and cytotoxicity (CTX) genes before (pre, left) or after (post, right) neoadjuvant immunotherapy (Data File S7). The same analysis is performed on RNA-seq data available from 11 HNSCC biopsies collected before or after 3 doses of nivolumab (E), as reported in (30). P values: significant comparisons calculated with two-tailed Mann-Whitney test. In all the panels, dots represent values from individual patients, with colors depicting the level of pTR (panels A-D) or radiographic reduction of tumor (panel E, as established in (30)) measured after neoadjuvant immunotherapy. For column plots: boxes: 25th-75th percentiles; whiskers: min-max values; horizontal lines: media values.
Fig. 6.
Fig. 6.. Clonal dynamics of CD8+ TCR-clonotypes before and after PD1-1 blockade
(A) UMAP of CD8+ TILs based on intra-patient TCR clone frequency (defined through scTCR-seq) to represent clonally expanded CD8+ T cells. TCR clonotypes in 3 Rs (top) and 3 NRs (bottom) with matched biopsies collected before (pre) and (post) anti-PD1 therapy are shown. (B) Cluster distribution of the top 50 CD8+ TCR clonotypes classified as TNExM or TEx, sequenced in pre-post therapy tumor biopsies from 3 Rs (top) and 3 NRs (bottom). Colors denote cell states inferred from scRNA-seq (see Fig. 2B), as delineated within the legend (bottom). (C) Overall frequencies of CD8+ TCR clonotypes, classified as Lost (orange), New (green) or Persisting (black) based on detection in pre and/or post therapy biopsies. Dots depict mean values with standard deviations, as assessed in 3 Rs (left) and 3 NRs (right) before (pre) or after (post) anti-PD-1 immunotherapy. P value reports significant differences, as established using two-tailed t-test. For each timepoint, bottom pies report the total number of TCR clonotypes for each category (Data File S8). (D) Clone size of TCR clonotypes, as classified in panel C and analyzed across 3 Rs (left) and 3 NRs (right) HNSCCs before or after neoadjuvant PD-1 blockade. Dots represent counts of individual TCR clonotypes, while boxes report 25th-75th percentiles with medians (horizontal bars). Whiskers: min-max values; P values indicate significant comparisons calculated with two-tailed paired t-test (for persisting clones, pre vs post) or two-tailed unpaired Welch’s t-test. (E), Bar plots depicting overall intratumoral frequencies of CD8+ TCR-clonotypes with different primary phenotypes (TNExM: blue, TEx: red) among total CD8+ TILs. TCR clonotypes are classified based on their detection in pre and/or post therapy biopsies as Lost (pre-specific), New (post-specific) or Persisting (detected in both pre-post samples). Values are shown for each 3 Rs and 3 NRs with pre-post therapy assessments. Based on their size, TCR clonotypes are further divided in singletons (lightest colors), doubletons (intermediated colors) or expanded (composed by >2 cells; darkest colors Data File S9). P values indicates significant comparisons for expanded TCR clonotypes, as calculated with two-tailed unpaired Welch’s t-test (Rs vs NRs) or with two-tailed paired t-test (pre vs post). (F) Dynamics of Persisting or CD8+ TCR clonotypes with TNExM (blue), TEx (red) primary phenotypes. Lines depict individual clones detected before (pre) or after (post) neoadjuvant PD-1 blockade within the TME of HNSCCs from 3 Rs (left) and 3 NRs (right). Bold lines report mean values. P values indicate significant clonal expansions or contractions, as calculated with two-tailed paired t-test.
Fig. 7.
Fig. 7.. High frequencies of ZNF683+ cytotoxic CD8+ TEx-TCR clonotypes associates with response to PD-1 blockade
(A) Phenotypes of clones Lost/New/Persisting TCR clonotypes. A-Left: Gene-expression profile of TCR clonotypes (rows) classified based on their primary phenotype (TEx, TNExM) and divided based on their detection in pre and/or post-immunotherapy HNSCC tumors (Lost, New, Persisting [Pers.]) in Responders (R, n=3) or Non-Responders (NR, n=3). Average RNA-transcripts levels expressed as Z-scores are shown for i) top deregulated in R/NR-Pre-TEx signatures (see Data File S5); ii) for a panel of genes representative for T-cell related features; iii) for scores summarizing the expression of key genes (see Material and Methods). Genes enriched in R-Pre-TEx or NR-Pre-TEx signatures are labeled in red and brown respectively. Key transcriptional factors are highlighted in bold. Vertical tracks indicated evaluation of TCR clonotype in pre (orange) or post (green)-therapy timepoints. A-Right: Summary of the cell states of expanded (>2 cells) TCR clonotypes, divided by category (left). For each T-cell feature, scores summarize the expression of key genes (see Materials and Methods). Violin plots: median values (solid lines) with quartiles (dashed lines). Numbers: percentages of positive cells. Vertical lines: mean scores in the entire dataset. (B,C) Analysis of clonal revival in putative tumor reactive TEX-TCR clonotypes. (B) Bidimensional plot depicting quantification of memory and exhaustion programs (scores) in TEx-TCR clonotypes detected in HNSCC biopsies collected before (pre) or after (post) immunotherapy from 3Rs and 3 NRs. Dots represent single cells harboring TCRs with TEx primary phenotype and colored based on the size of each TCR clonotype. Thresholds: average score values across all CD8+ TILs. (C) The proportion of T cells with high memory score is quantified for each R (circles) or NR (diamonds), with lines connecting matched pre-post evaluations. Analysis was performed among all TCR clones (top) or expanded (>2 cells) TCR clones (bottom) with TEx primary phenotype (red) or within TNExM clones (blue) as positive control (Data File S9). The lack of relevant differences in Rs and NRs documents that clonal revival is not significant in this clinical setting. (D,E,F) Quantification of ZNF683+ cytotoxic (CTX+) TEx cells among CD8+ TILs in HNSCC. (D): Bidimensional plot quantifying the expression of ZNF683 (x axis) and cytotoxicity genes (summarized in a score, y axis, see Materials and Methods) in CD8+ TILs with TEx-TCR clonotypes, colored according to their expansion. Thresholds represents average values of variables, as measured in the entire dataset of CD8+ TILs. For each R and NR, the frequencies ZNF683+CTX+ TILs are reported in (E), among all (top) or expanded (>2 cells, bottom) CD8+ TCR clonotypes with TEx primary phenotypes (Data File S9) or among TNexM clones as negative control (blue). (F) Quantification of ZNF683+CTX+ single cells across the overall CD8+ TILs. Bars: mean percentages with SEM. ZNF683+CTX+ TILs are shown with full colors amongst cell states classified as exhausted (red) or memory (blue). Grey: unclassified cells. Analysis was repeated for CD8+ TILs with any TCRs (top) or with expanded (>2 cells) specificities (bottom) (Data File S9). P values: significant comparisons calculated with two-tailed unpaired t-test (R vs NR) or with two-tailed paired ratio t-test (pre vs post).

References

    1. Mody MD, Rocco JW, Yom SS, Haddad RI, Saba NF, Head and neck cancer. Lancet 398, 2289–2299 (2021). - PubMed
    1. Egloff AM, Uppaluri R, Preoperative immunotherapy for head and neck cancers: state of art. Curr Opin Oncol (2022), doi:10.1097/CCO.0000000000000826. - DOI - PubMed
    1. Uppaluri R, Campbell KM, Egloff AM, Zolkind P, Skidmore ZL, Nussenbaum B, Paniello RC, Rich JT, Jackson R, Pipkorn P, Michel LS, Ley J, Oppelt P, Dunn GP, Barnell EK, Spies NC, Lin T, Li T, Mulder DT, Hanna Y, Cirlan I, Pugh TJ, Mudianto T, Riley R, Zhou L, Jo VY, Stachler MD, Hanna GJ, Kass J, Haddad R, Schoenfeld JD, Gjini E, Lako A, Thorstad W, Gay HA, Daly M, Rodig SJ, Hagemann IS, Kallogjeri D, Piccirillo JF, Chernock RD, Griffith M, Griffith OL, Adkins DR, Neoadjuvant and Adjuvant Pembrolizumab in Resectable Locally Advanced, Human Papillomavirus-Unrelated Head and Neck Cancer: A Multicenter, Phase II Trial. Clin Cancer Res 26, 5140–5152 (2020). - PMC - PubMed
    1. Wise-Draper TM, Gulati S, Palackdharry S, Hinrichs BH, Worden FP, Old MO, Dunlap NE, Kaczmar JM, Patil Y, Riaz MK, Tang A, Mark J, Zender C, Gillenwater AM, Bell D, Kurtzweil N, Mathews M, Allen CL, Mierzwa ML, Casper K, Jandarov R, Medvedovic M, Lee JJ, Harun N, Takiar V, Gillison M, Phase II Clinical Trial of Neoadjuvant and Adjuvant Pembrolizumab in Resectable Local-Regionally Advanced Head and Neck Squamous Cell Carcinoma. Clin Cancer Res 28, 1345–1352 (2022). - PMC - PubMed
    1. Luginbuhl AJ, Johnson JM, Harshyne LA, Linnenbach AJ, Shukla SK, Alnemri A, Kumar G, Cognetti DM, Curry JM, Kotlov N, Antysheva Z, Degryse S, Mannion K, Gibson MK, Netterville J, Brown B, Axelrod R, Zinner R, Tuluc M, Gargano S, Leiby BE, Shimada A, Mahoney MG, Martinez-Outschoorn U, Rodeck U, Kim YJ, South AP, Argiris A, Tadalafil Enhances Immune Signatures in Response to Neoadjuvant Nivolumab in Resectable Head and Neck Squamous Cell Carcinoma. Clin Cancer Res 28, 915–927 (2022). - PMC - PubMed

Publication types

Substances