. 2023 Sep 7;15(17):8873-8907.
doi: 10.18632/aging.205004. Epub 2023 Sep 7.

Identification of ROCK1 as a novel biomarker for postmenopausal osteoporosis and pan-cancer analysis

Affiliations

Identification of ROCK1 as a novel biomarker for postmenopausal osteoporosis and pan-cancer analysis

Bowen Lai et al. Aging (Albany NY). .

Abstract

Background: Postmenopausal osteoporosis (PMOP) is a prevalent bone disorder with significant global impact. The elevated risk of osteoporotic fracture in elderly women poses a substantial burden on individuals and society. Unfortunately, the current lack of dependable diagnostic markers and precise therapeutic targets for PMOP remains a major challenge.

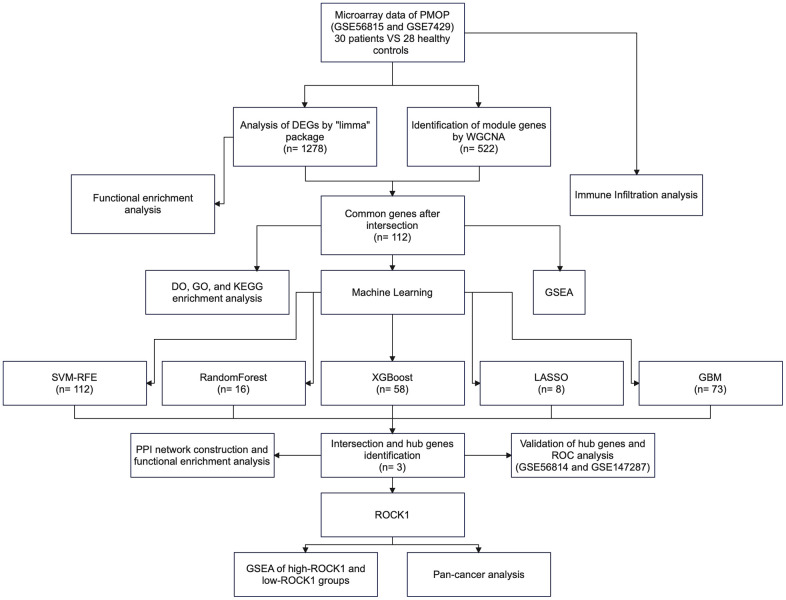
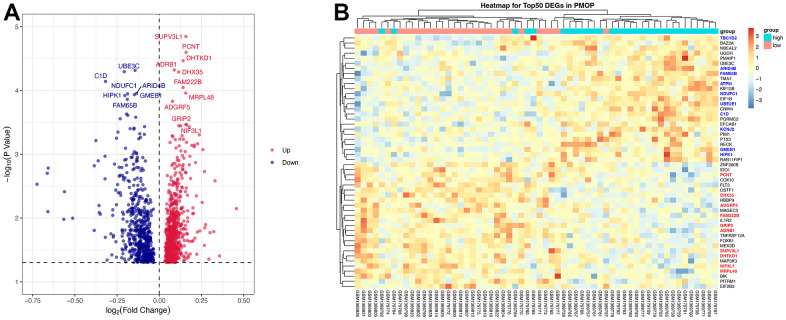
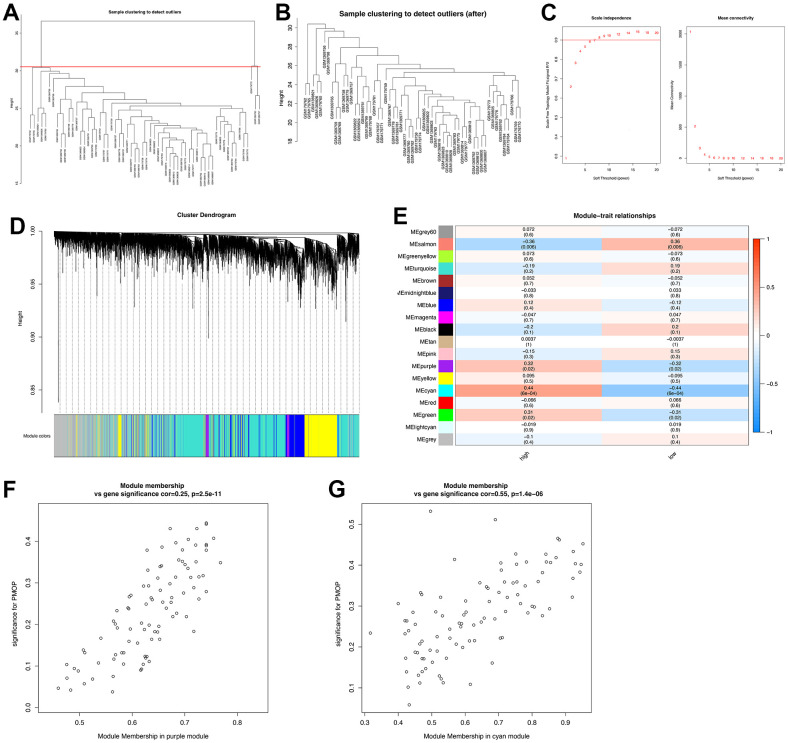
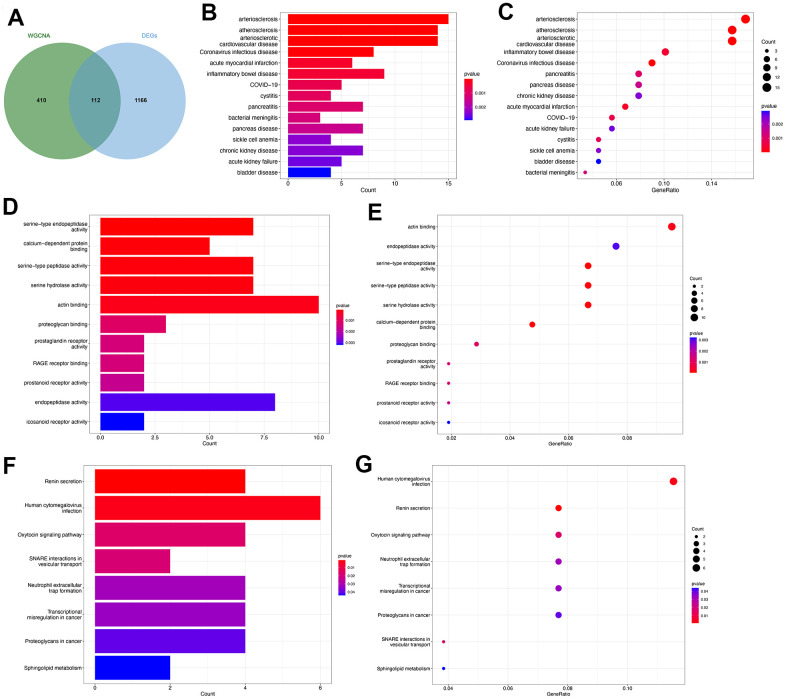
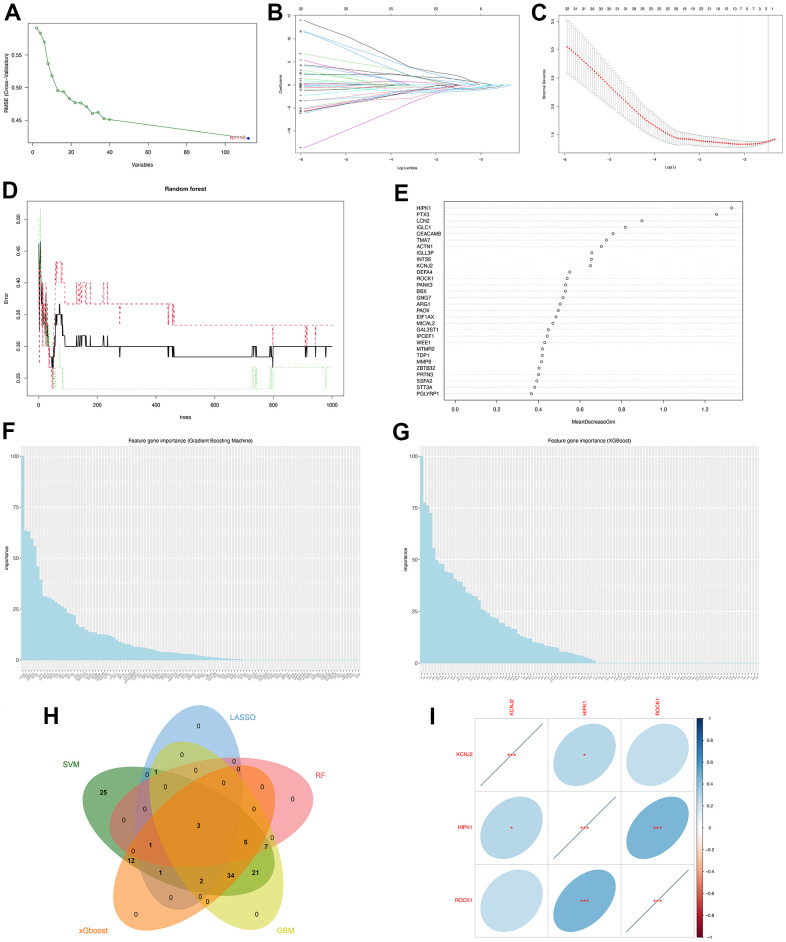
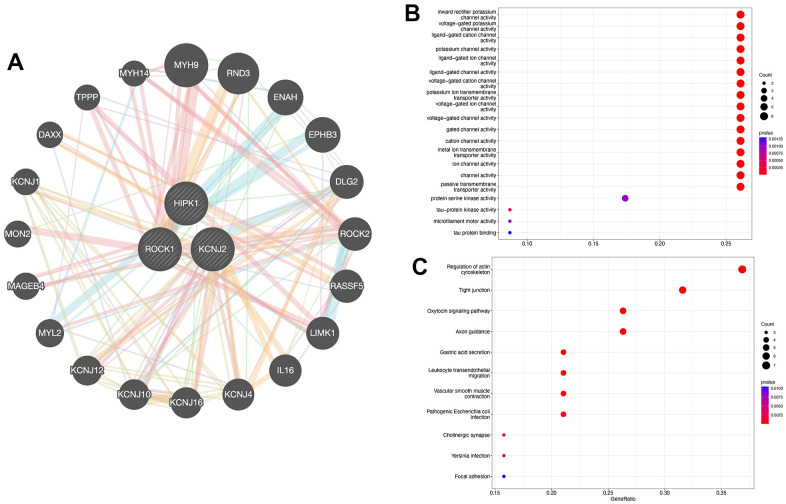
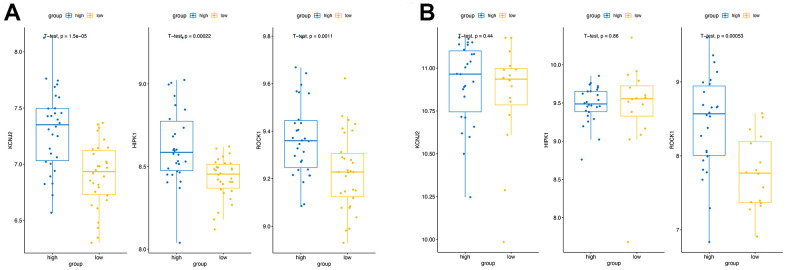
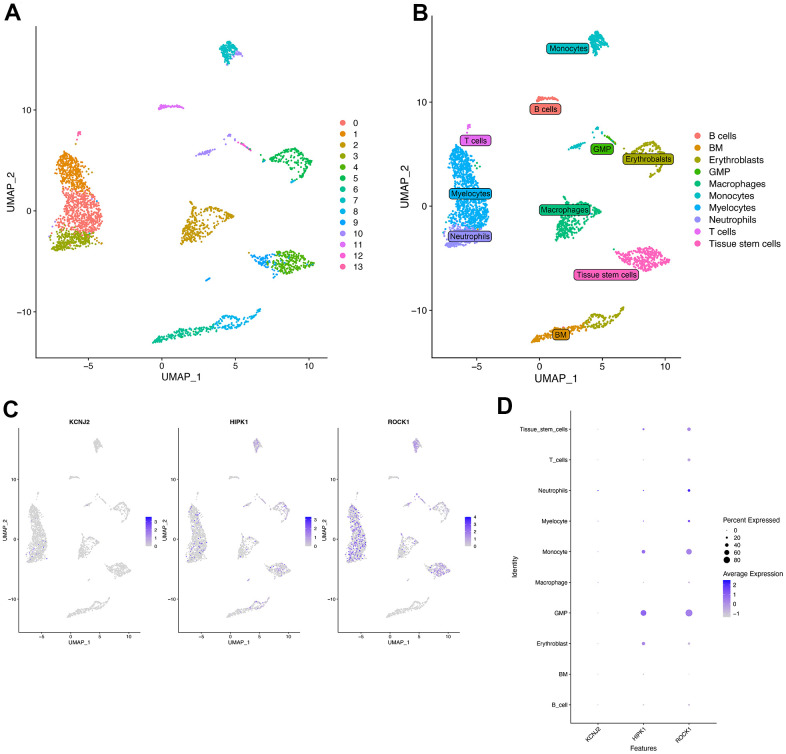
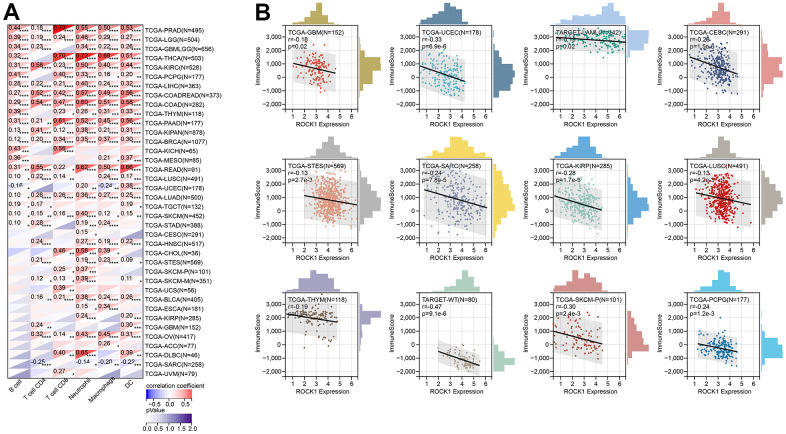
Methods: PMOP-related datasets GSE7429, GSE56814, GSE56815, and GSE147287, were downloaded from the GEO database. The DEGs were identified by "limma" packages. WGCNA and Machine Learning were used to choose key module genes highly related to PMOP. GSEA, DO, GO, and KEGG enrichment analysis was performed on all DEGs and the selected key hub genes. The PPI network was constructed through the GeneMANIA database. ROC curves and AUC values validated the diagnostic values of the hub genes in both training and validation datasets. xCell immune infiltration and single-cell analysis identified the hub genes' function on immune reaction in PMOP. Pan-cancer analysis revealed the role of the hub genes in cancers.

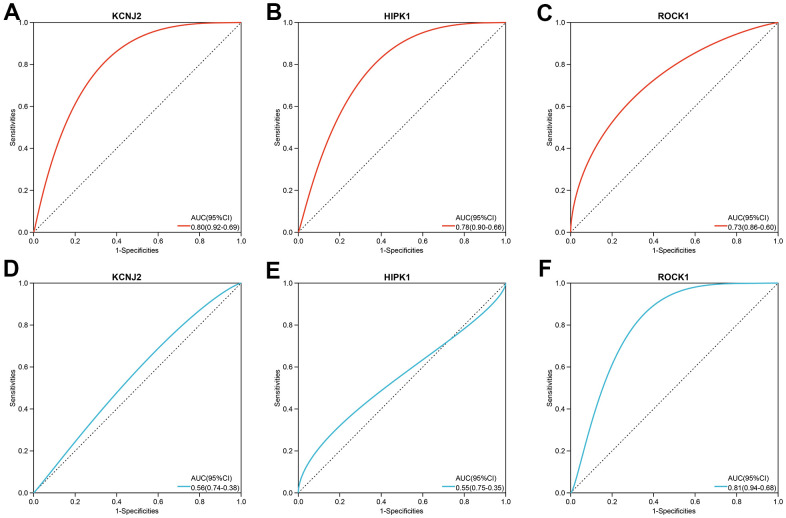
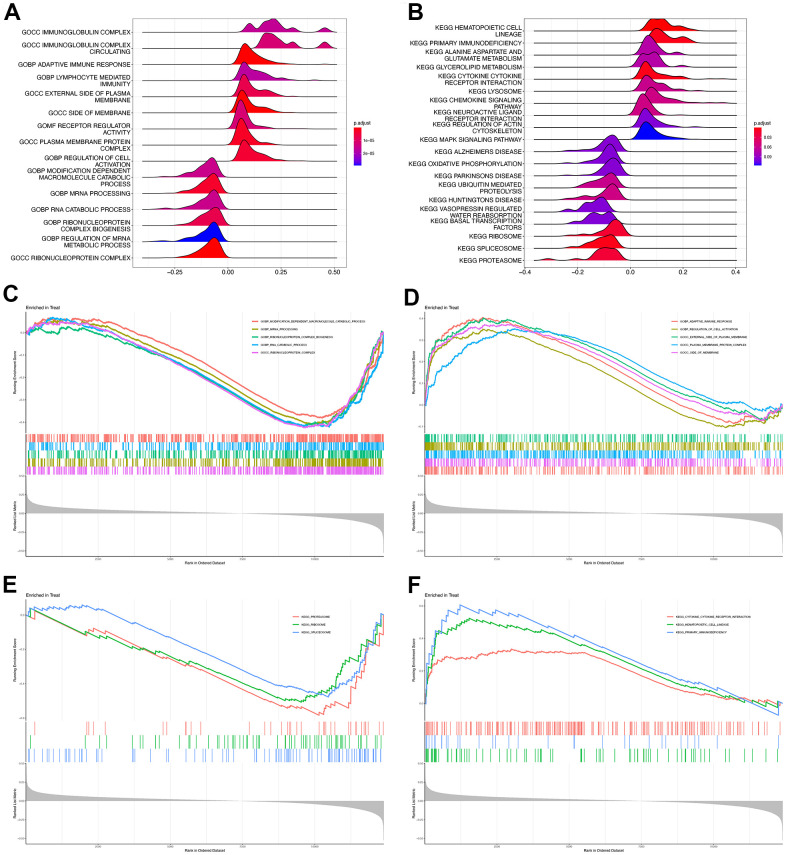
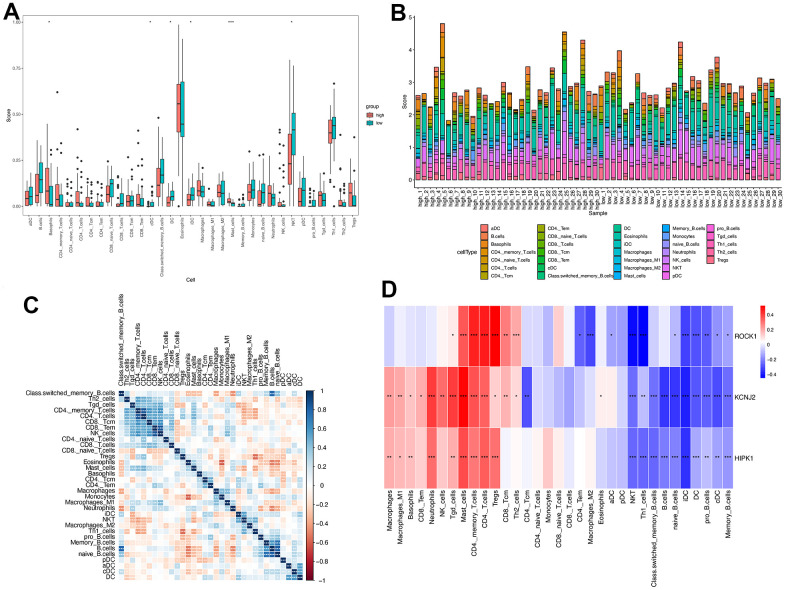
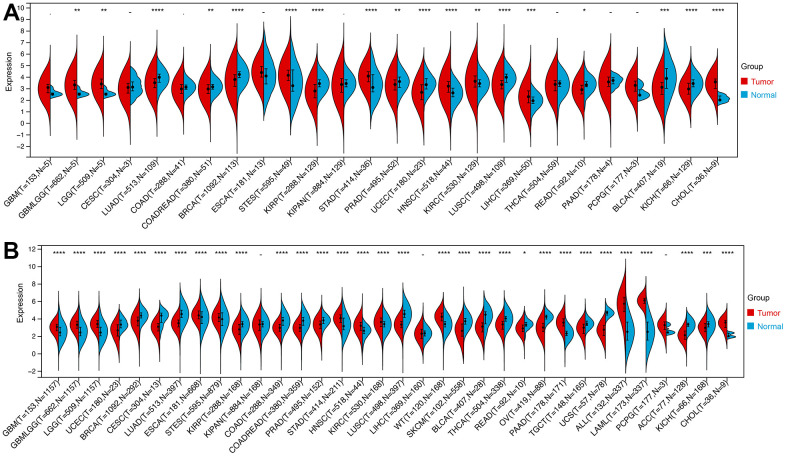
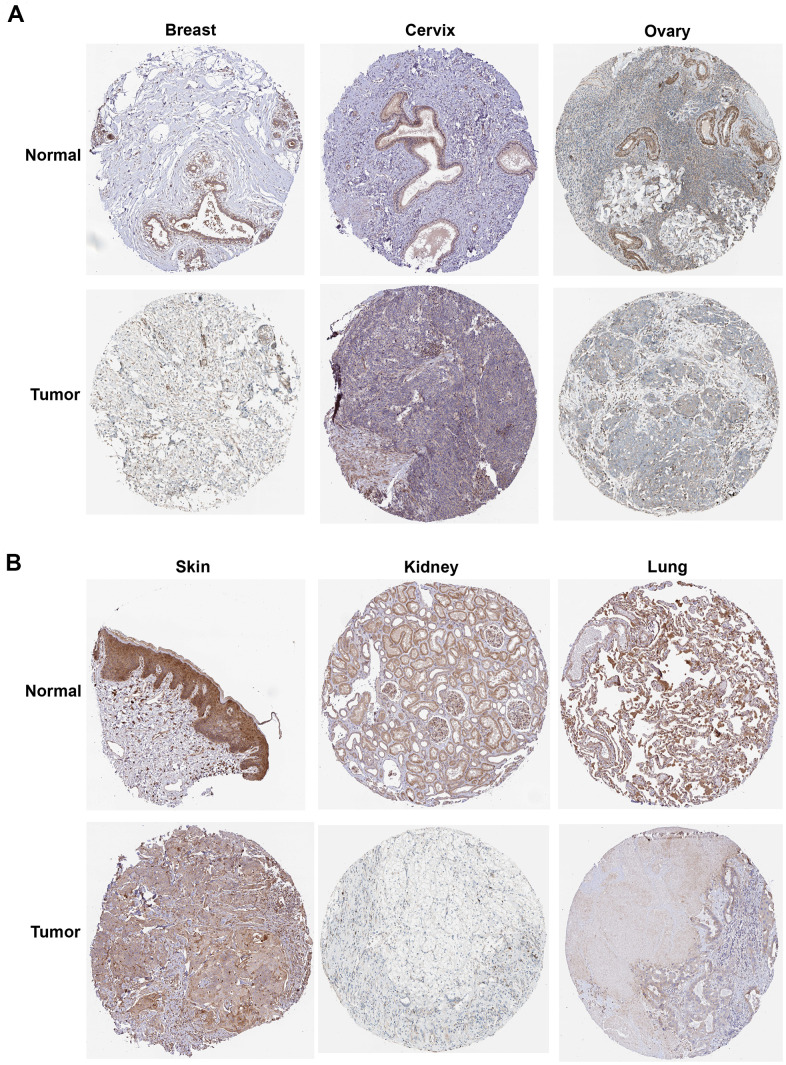
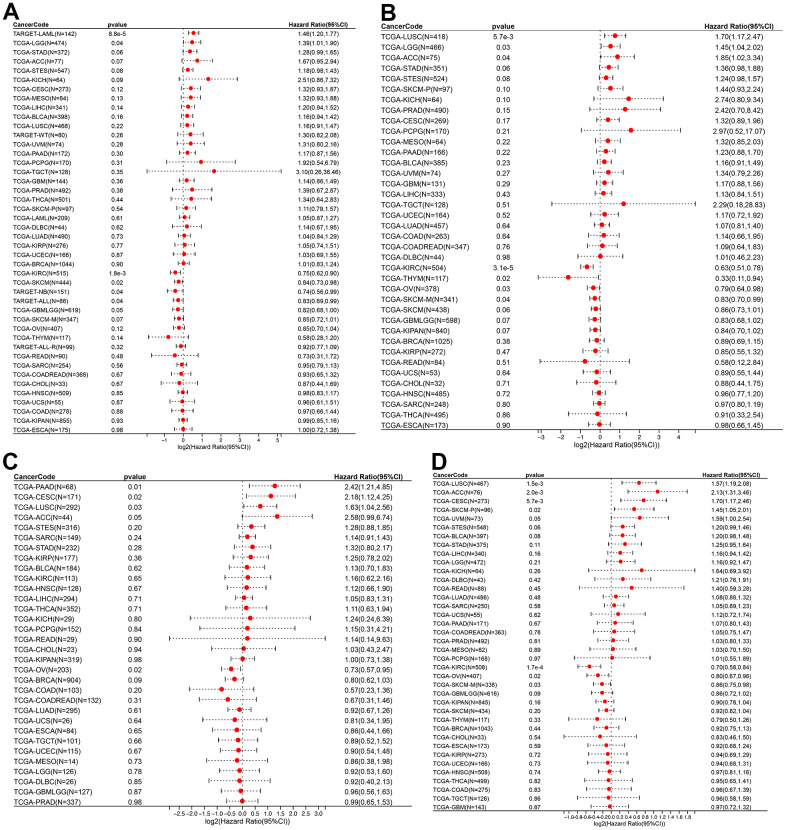
Results: A total of 1278 DEGs were identified between PMOP patients and the healthy controls. The purple module and cyan module were selected as the key modules and 112 common genes were selected after combining the DEGs and module genes. Five Machine Learning algorithms screened three hub genes (KCNJ2, HIPK1, and ROCK1), and a PPI network was constructed for the hub genes. ROC curves validate the diagnostic values of ROCK1 in both the training (AUC = 0.73) and validation datasets of PMOP (AUC = 0.81). GSEA was performed for the low-ROCK1 patients, and the top enriched field included protein binding and immune reaction. DCs and NKT cells were highly expressed in PMOP. Pan-cancer analysis showed a correlation between low ROCK1 expression and SKCM as well as renal tumors (KIRP, KICH, and KIRC).

Conclusions: ROCK1 was significantly associated with the pathogenesis and immune infiltration of PMOP, and influenced cancer development, progression, and prognosis, which provided a potential therapy target for PMOP and tumors. However, further laboratory and clinical evidence is required before the clinical application of ROCK1 as a therapeutic target.

Keywords: ROCK1; immune infiltration; machined Learning; pan-cancer; postmenopausal osteoporosis.


Conflict of interest statement

CONFLICTS OF INTEREST: The authors declare that the research was conducted in the absence of any commercial or financial relationships that could be construed as a potential conflict of interest.

Figures

Figure 1
Figure 1
The flowchart of the study process.
Figure 2
Figure 2
DEGs screening. Volcano plot (A) and heatmap (B) for the DEGs identified from the integrated PMOP dataset. Top regulated genes were texted in the volcano plot. The top 10 up-regulated genes are highlighted in bold red on the heatmap while the top 10 down-regulated genes are in bold blue.
Figure 3
Figure 3
Construction of WGCNA co-expression network. (A) Sample clustering dendrogram and the samples whose height > 31 were identified as outliers. (B) Sample clustering dendrogram after cutting the outliers. (C) Soft threshold b = 7 and scale-free topological fit index (R2). (D) Shows the modules with different colors under the clustering tree. (E) Heat map of module-trait correlations. (F) MM vs. GS scatter plot of the purple module. (G) MM vs. GS scatter plot of the cyan module. Red represents positive correlations and blue represents negative correlations.
Figure 4
Figure 4
Functional enrichment analysis of the common key genes. (A) The Venn plot identified 112 shared genes among 522 module genes and 1278 DEGs. Bar plot (B) and dot plot (C) showed the results of DO enrichment analysis of 112 common genes. Bar plot (D) and dot plot (E) showed the results of GO enrichment analysis of 112 common genes. Bar plot (F) and dot plot (G) showed the results of KEGG enrichment analysis of 112 common genes.
Figure 5
Figure 5
Machine learning identified three hub genes of PMOP. (A) SVM-RFE screening of candidate diagnostic genes. (B, C) LASSO screening of candidate diagnostic genes. (D) Random forest error rate versus the number of classification trees. (E) Random forest calculated the top 30 relatively important genes of PMOP. (F) GBM screening of candidate diagnostic genes and the bar chart showed the genes ranked by importance. (G) XGboost screening of candidate diagnostic genes and he bar chart showed the genes ranked by importance. (H) Venn plot between five machine learning methods resulted in three common hub genes. (I) Correlation between three hub genes. Blue represents positive correlations and red represents negative correlations. *, p < 0.05, **, p < 0.01, ***, p < 0.001.
Figure 6
Figure 6
PPI network construction. (A) Interaction analysis of hub genes and the construction of gene co-expression network. (B) Dot plot showed the results of GO enrichment analysis of three hub genes and 20 related genes. (C) Dot plot showed the results of KEGG enrichment analysis of three hub genes and 20 related genes.
Figure 7
Figure 7
Validation of the hub genes expression. The expression of three hub genes in high BMD group and low BMD (PMOP) group of the training datasets (A) and the validation datasets (B).
Figure 8
Figure 8
The three hub genes’ diagnostic value in PMOP training datasets (AC) and validation datasets (DF). ROC curves and AUC statistics are used to evaluate the capacity to discriminate PMOP from healthy controls with excellent sensitivity and specificity.
Figure 9
Figure 9
GSEA of high and low ROCK1 subgroup. Ridge map showed the GO (A) and KEGG (B) enrichment analysis results of all DEGs by GSEA. GSEA plot with DEGs and the top five GO terms enriched in high ROCK1 (C) and low ROCK1 (D) subgroup. GSEA plot with DEGs and the top three KEGG terms enriched in high ROCK1 (E) and low ROCK1 (F) subgroup.
Figure 10
Figure 10
Immune cell infiltration analysis on PMOP. The proportion of 33 kinds of immune cells in PMOP patients and controls was visualized from the box plot (A) and the bar plot (B). (C) Correlation of 33 immune cell type compositions in PMOP. (D) Correlation between the expression of 33 immune cells and three hub genes in PMOP. *, p < 0.05, **, p < 0.01, ***, p < 0.001.
Figure 11
Figure 11
Single-cell RNA analysis on bone marrow-derived mesenchymal stem cells (BM-MNCs) from PMOP patients. (A) UMAP plot showed 13 clusters of BM-MNCs from PMOP patients. (B) UMAP distributions of single cells from the 10 defined cell types annotated by SingleR. Feature plot (C) and dot plot (D) showed the expression of three hub genes in identified clusters and cell types.
Figure 12
Figure 12
The expression of ROCK1 in Pan-cancer. (A) Pan-cancer expression levels of ROCK1 in the TCGA dataset. (B) Pan-cancer expression levels of ROCK1 in the TCGA and GTEx datasets. *p <0.05, **p <0.01, ***p <0.001, ****p <0.0001, -no significance.
Figure 13
Figure 13
The protein expression of ROCK1 in pan-cancer. (A) The protein expression level of ROCK1 in women-specific cancers (Breast tumors, Cervical tumors, and Ovarian tumors versus normal tissues. (B) The protein expression level of ROCK1 in Skin tumors, Renal tumors, and Lung tumors versus normal tissues.
Figure 14
Figure 14
ROCK1 and survival situations. (AD) Forest plots of ROCK1 expression and OS, DSS, DFI, and PFA. OS, overall survival; DSS, disease-specific survival; DFI, disease-free interval; PFI, progression-free interval; HR, hazard ratio.
Figure 15
Figure 15
ROCK1’s role in tumor immune response. (A) Correlation between the expression levels of ROCK1 and immune infiltration pan-cancer by TIMER database. (B) Correlation between the expression of ROCK1 and ImmuneScore derived from the ESTIMATE algorithm. *p <0.05, **p <0.01, ***p <0.001, ****p <0.0001.

Similar articles

Cited by

References

    1. Black DM, Rosen CJ. Clinical Practice. Postmenopausal Osteoporosis. N Engl J Med. 2016; 374:254–62. 10.1056/NEJMcp1513724 - DOI - PubMed
    1. International Osteoporosis Foundation. About Osteoporosis. 2023. https://www.osteoporosis.foundation/patients/about-osteoporosis.
    1. International Osteoporosis Foundation. Diagnosis of Osteoporosis. 2023. https://www.osteoporosis.foundation/patients/diagnosis.
    1. Estrada K, Styrkarsdottir U, Evangelou E, Hsu YH, Duncan EL, Ntzani EE, Oei L, Albagha OM, Amin N, Kemp JP, Koller DL, Li G, Liu CT, et al.. Genome-wide meta-analysis identifies 56 bone mineral density loci and reveals 14 loci associated with risk of fracture. Nat Genet. 2012; 44:491–501. 10.1038/ng.2249 - DOI - PMC - PubMed
    1. Trajanoska K, Morris JA, Oei L, Zheng HF, Evans DM, Kiel DP, Ohlsson C, Richards JB, Rivadeneira F, and GEFOS/GENOMOS consortium and the 23andMe research team. Assessment of the genetic and clinical determinants of fracture risk: genome wide association and mendelian randomisation study. BMJ. 2018; 362:k3225. 10.1136/bmj.k3225 - DOI - PMC - PubMed

Publication types