. 2023 Oct:66:102870.
doi: 10.1016/j.redox.2023.102870. Epub 2023 Sep 1.

TNFα is a key trigger of inflammation in diet-induced non-obese MASLD in mice

Affiliations

TNFα is a key trigger of inflammation in diet-induced non-obese MASLD in mice

Katharina Burger et al. Redox Biol. 2023 Oct.

Abstract

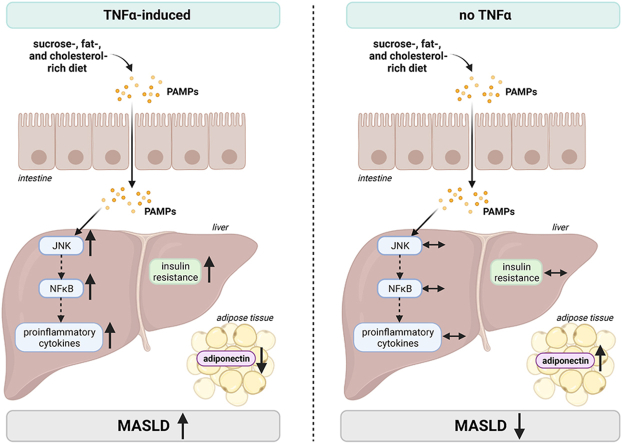
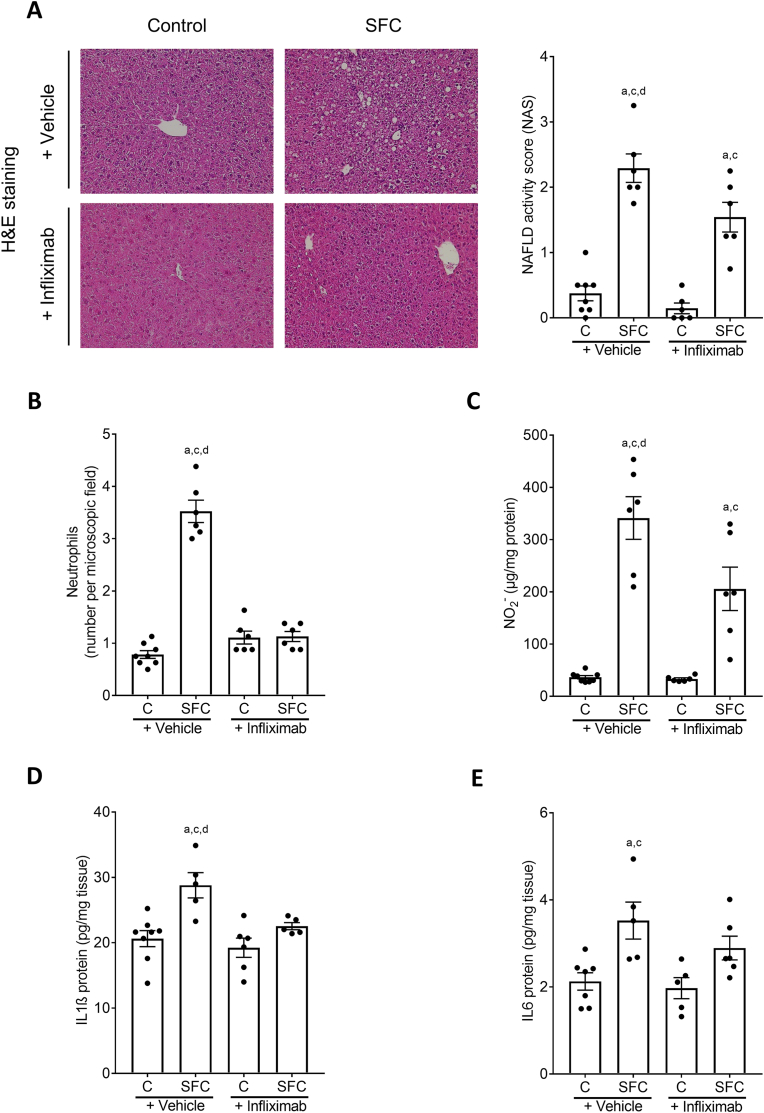
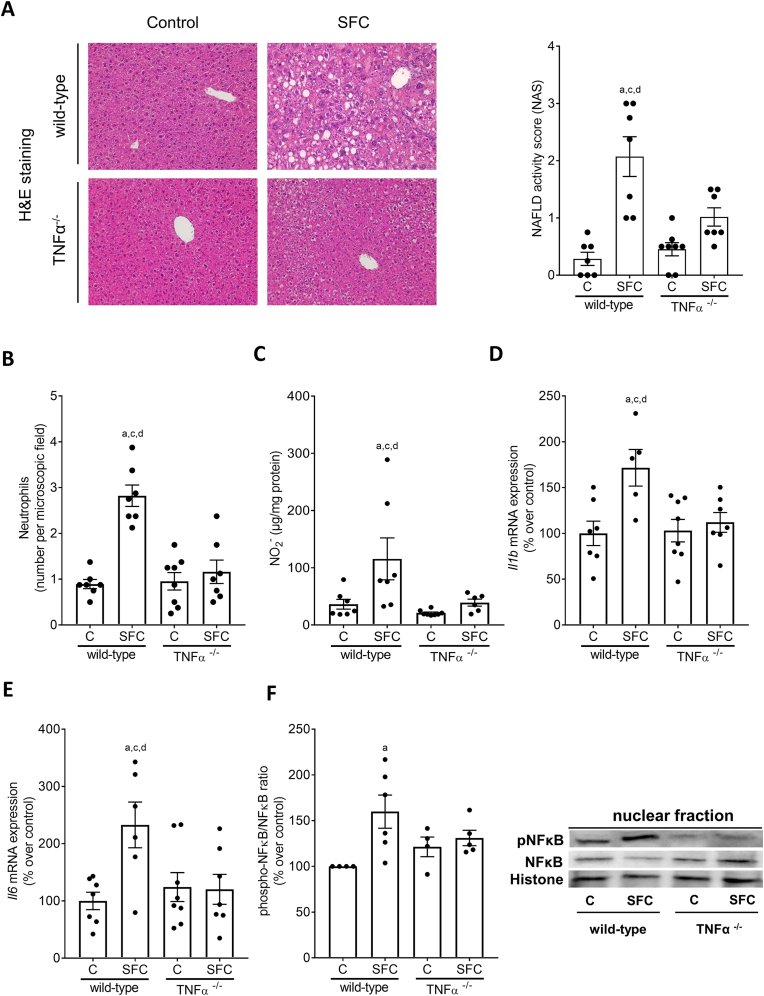
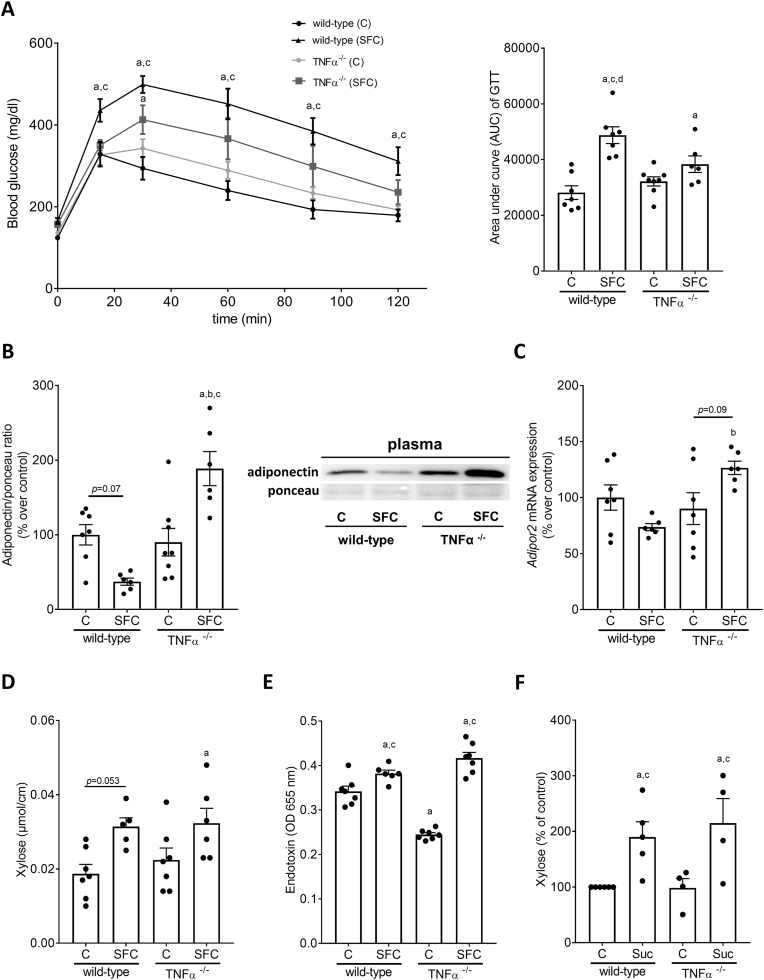
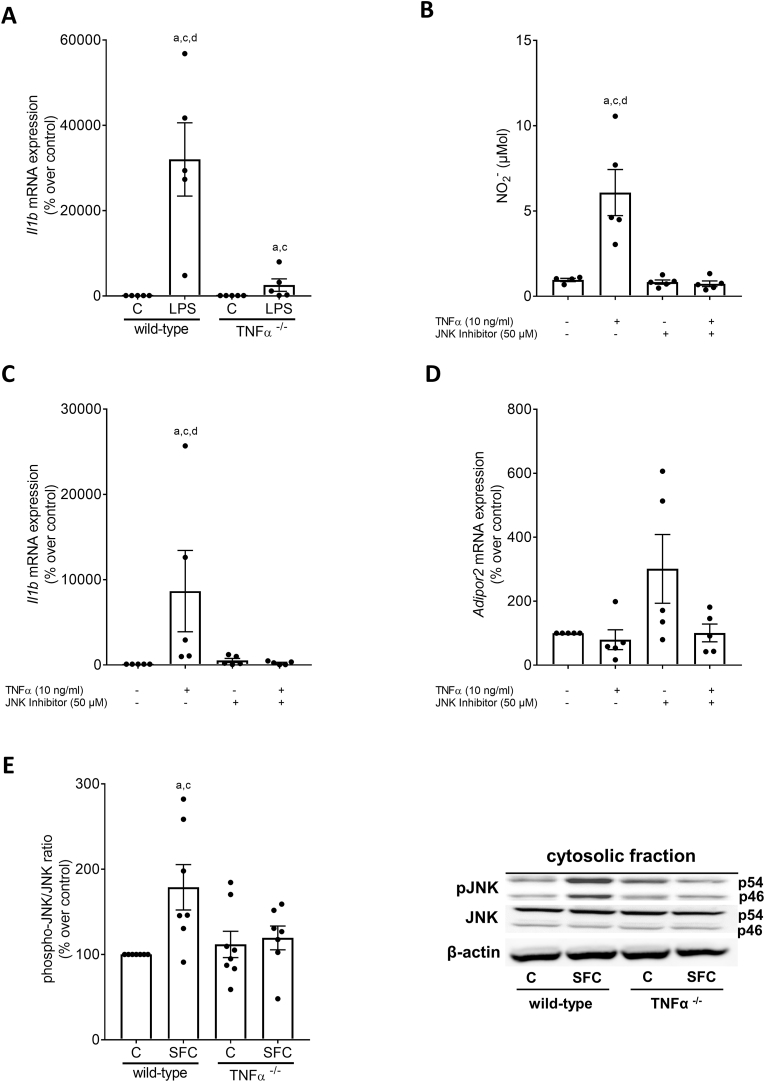
Tumor necrosis factor alpha (TNFα) is thought to be a critical factor in the development of metabolic dysfunction-associated steatotic liver disease (MASLD). Here, we determined the effects of a treatment with the anti-TNFα antibody infliximab and a genetic deletion of TNFα, respectively, in the development of non-obese diet-induced early metabolic dysfunction-associated steatohepatitis (MASH) in mice. The treatment with infliximab improved markers of liver damage in mice with pre-existing early MASH. In TNFα-/- mice, the development of early signs of MASH and insulin resistance was significantly attenuated compared to wild-type animals. While mRNA expression of proinflammatory cytokines like interleukin 1β (Il1b) and interleukin 6 (Il6) were significantly lower in livers of MASH-diet-fed TNFα-/- mice compared to wild-type mice with early MASH, markers of intestinal barrier function were similarly impaired in both MASH-diet-fed groups compared to controls. Our data suggest that TNFα is a key regulator of hepatic inflammation and insulin resistance associated with the development of early non-obese MASH.

Keywords: Endotoxin; Fatty liver; Insulin resistance; Intestinal barrier; MASH.


Conflict of interest statement

Declaration of competing interest All authors declare no conflict of interest.

Figures

Image 1
Graphical abstract
Fig. 1
Fig. 1
Effect of infliximab on indices of liver damage and inflammatory markers in C57BL/6J mice fed a SFC for 8 weeks. (A) Representative pictures (magnification 200×) of hematoxylin and eosin (H&E) staining in liver tissue and NAFLD activity score (NAS) in liver tissue, (B) number of neutrophil granulocytes per microscope field in liver tissue, (C) NO2 concentration and protein concentration of (D) interleukin 1β (IL1β) as well as (E) interleukin 6 (IL6) in liver tissue. Data are shown as mean ± SEM, n = 6–8, except for (D) and (E): n = 5–8. ap < 0.05 compared to C-fed + Vehicle-treated mice, cp < 0.05 compared to C-fed + Infliximab-treated mice, dp < 0.05 compared to SFC-fed + Infliximab-treated mice. C, control diet; SFC, sucrose-, fat-, and cholesterol-rich diet.
Fig. 2
Fig. 2
Effect of a SFC fed for 9 weeks on indices of liver damage, inflammation, and pro-inflammatory markers as well as phosphorylation of NFκB in livers of wild-type and TNFα−/−mice. (A) Representative pictures (magnification 200×) of hematoxylin and eosin (H&E) staining in liver tissue and NAFLD activity score (NAS) in liver tissue, (B) number of neutrophil granulocytes per microscope field in liver tissue, (C) hepatic NO2 concentration, mRNA expression of (D) interleukin 1b (Il1b) and (E) interleukin 6 (Il6) in liver tissue, (F) relative levels of phosphorylated NFκB protein in the nuclear fraction of the liver as well as representative pictures of the blots. Data are shown as mean ± SEM, n = 6–8, except for (F) n = 4–6. ap < 0.05 compared to C-fed wild-type mice, cp < 0.05 compared to C-fed TNFα−/− mice, dp < 0.05 compared to SFC-fed TNFα−/− mice. C, control diet; SFC, sucrose-, fat-, and cholesterol-rich diet.
Fig. 3
Fig. 3
Effect of a SFC fed for 9 weeks on glucose tolerance, adiponectin in plasma and adiponectin receptor 2 (Adipor2) expression in liver tissue as well as markers of intestinal permeability in wild-type and TNFα−/−mice. (A) Blood glucose levels during glucose tolerance test (GTT) and area under the curve (AUC) of blood glucose concentration, (B) adiponectin protein concentration in plasma and representative pictures of the blots, (C) mRNA expression of Adipor2 in liver tissue of wild-type C57BL/6J mice and TNFα−/− mice. (D) Xylose permeation in small intestine tissue and (E) endotoxin levels in plasma of wild-type C57BL/6J mice and TNFα−/− mice. (F) Xylose permeation in everted gut sacs of naïve wild-type C57BL/6J mice and TNFα−/− mice challenged with 10 mM sucrose (Suc). Data are shown as mean ± SEM, n = 6–8, except for (C) and (E): n = 6–7, for (D): n = 5–7 and for (F): n = 4–6. ap < 0.05 compared to C-fed wild-type mice, cp < 0.05 compared to C-fed TNFα−/− mice, dp < 0.05 compared to SFC-fed TNFα−/− mice. C, control diet; SFC, sucrose-, fat-, and cholesterol-rich diet.
Fig. 4
Fig. 4
Pro-inflammatory markers in peritoneal cavity cells (PCCs) isolated from wild-type and TNFα−/−mice challenged with LPS as well as J774A.1 cells challenged with TNFα in the presence of a JNK inhibitor (SP600125) and phosphorylation of JNK in livers of SFC-fed wild-type and TNFα−/− mice. (A) Expression of interleukin 1b (Il1b) mRNA of PCCs stimulated with LPS (50 ng/ml) for 2h, (B) NO2 concentration in supernatant, mRNA expression of (C) interleukin 1b (Il1b) and (D) adiponectin receptor 2 (Adipor2) of J774A.1 cells preincubated with an JNK Inhibitor (50 μM) for 2h and stimulated with TNFα (10 ng/ml) also for 2h. (E) Relative phospho-JNK protein concentration and representative pictures of blots in SFC-and C-fed wild-type and TNFα−/− mice. Data are shown as mean ± SEM, n = 5, except for (B) n = 4–5 and for (E) n = 6–8. For (A): ap < 0.05 compared to untreated PCCs of wild-type mice, cp < 0.05 compared to untreated PCCs of TNFα−/− mice, dp < 0.05 compared to LPS-treated PCCs of TNFα−/− mice. For (B)–(D): ap < 0.05 compared to untreated J774A.1 cells, cp < 0.05 compared to J774A.1 cells preincubated with a JNK inhibitor, dp < 0.05 compared to J774A.1 cells incubated with TNFα and a JNK inhibitor. For (E): ap < 0.05 compared to C-fed wild-type mice, cp < 0.05 compared to C-fed TNFα−/− mice. C, control; SFC, sucrose-, fat-, and cholesterol-rich diet; LPS; endotoxin-stimulated cells.

References

    1. Rinella M.E., et al. A multi-society Delphi consensus statement on new fatty liver disease nomenclature. Ann. Hepatol. 2023 - PubMed
    1. Younossi Z.M., et al. The global epidemiology of nonalcoholic fatty liver disease (NAFLD) and nonalcoholic steatohepatitis (NASH): a systematic review. Hepatology. 2023;77:1335–1347. - PMC - PubMed
    1. Riazi K., et al. The prevalence and incidence of NAFLD worldwide: a systematic review and meta-analysis. Lancet Gastroenterol Hepatol. 2022;7:851–861. - PubMed
    1. Chakravarthy M.V., et al. Nutrition and nonalcoholic fatty liver disease: current perspectives. Gastroenterol. Clin. N. Am. 2020;49:63–94. - PubMed
    1. Marušić M., et al. NAFLD, insulin resistance, and diabetes mellitus type 2. Chin. J. Gastroenterol. Hepatol. 2021;2021 - PMC - PubMed

Publication types