. 2023 Sep 7;30(9):1179-1198.e7.
doi: 10.1016/j.stem.2023.08.004.

Lgr5-expressing secretory cells form a Wnt inhibitory niche in cartilage critical for chondrocyte identity

Affiliations

Lgr5-expressing secretory cells form a Wnt inhibitory niche in cartilage critical for chondrocyte identity

Angela Ruscitto et al. Cell Stem Cell. .

Abstract

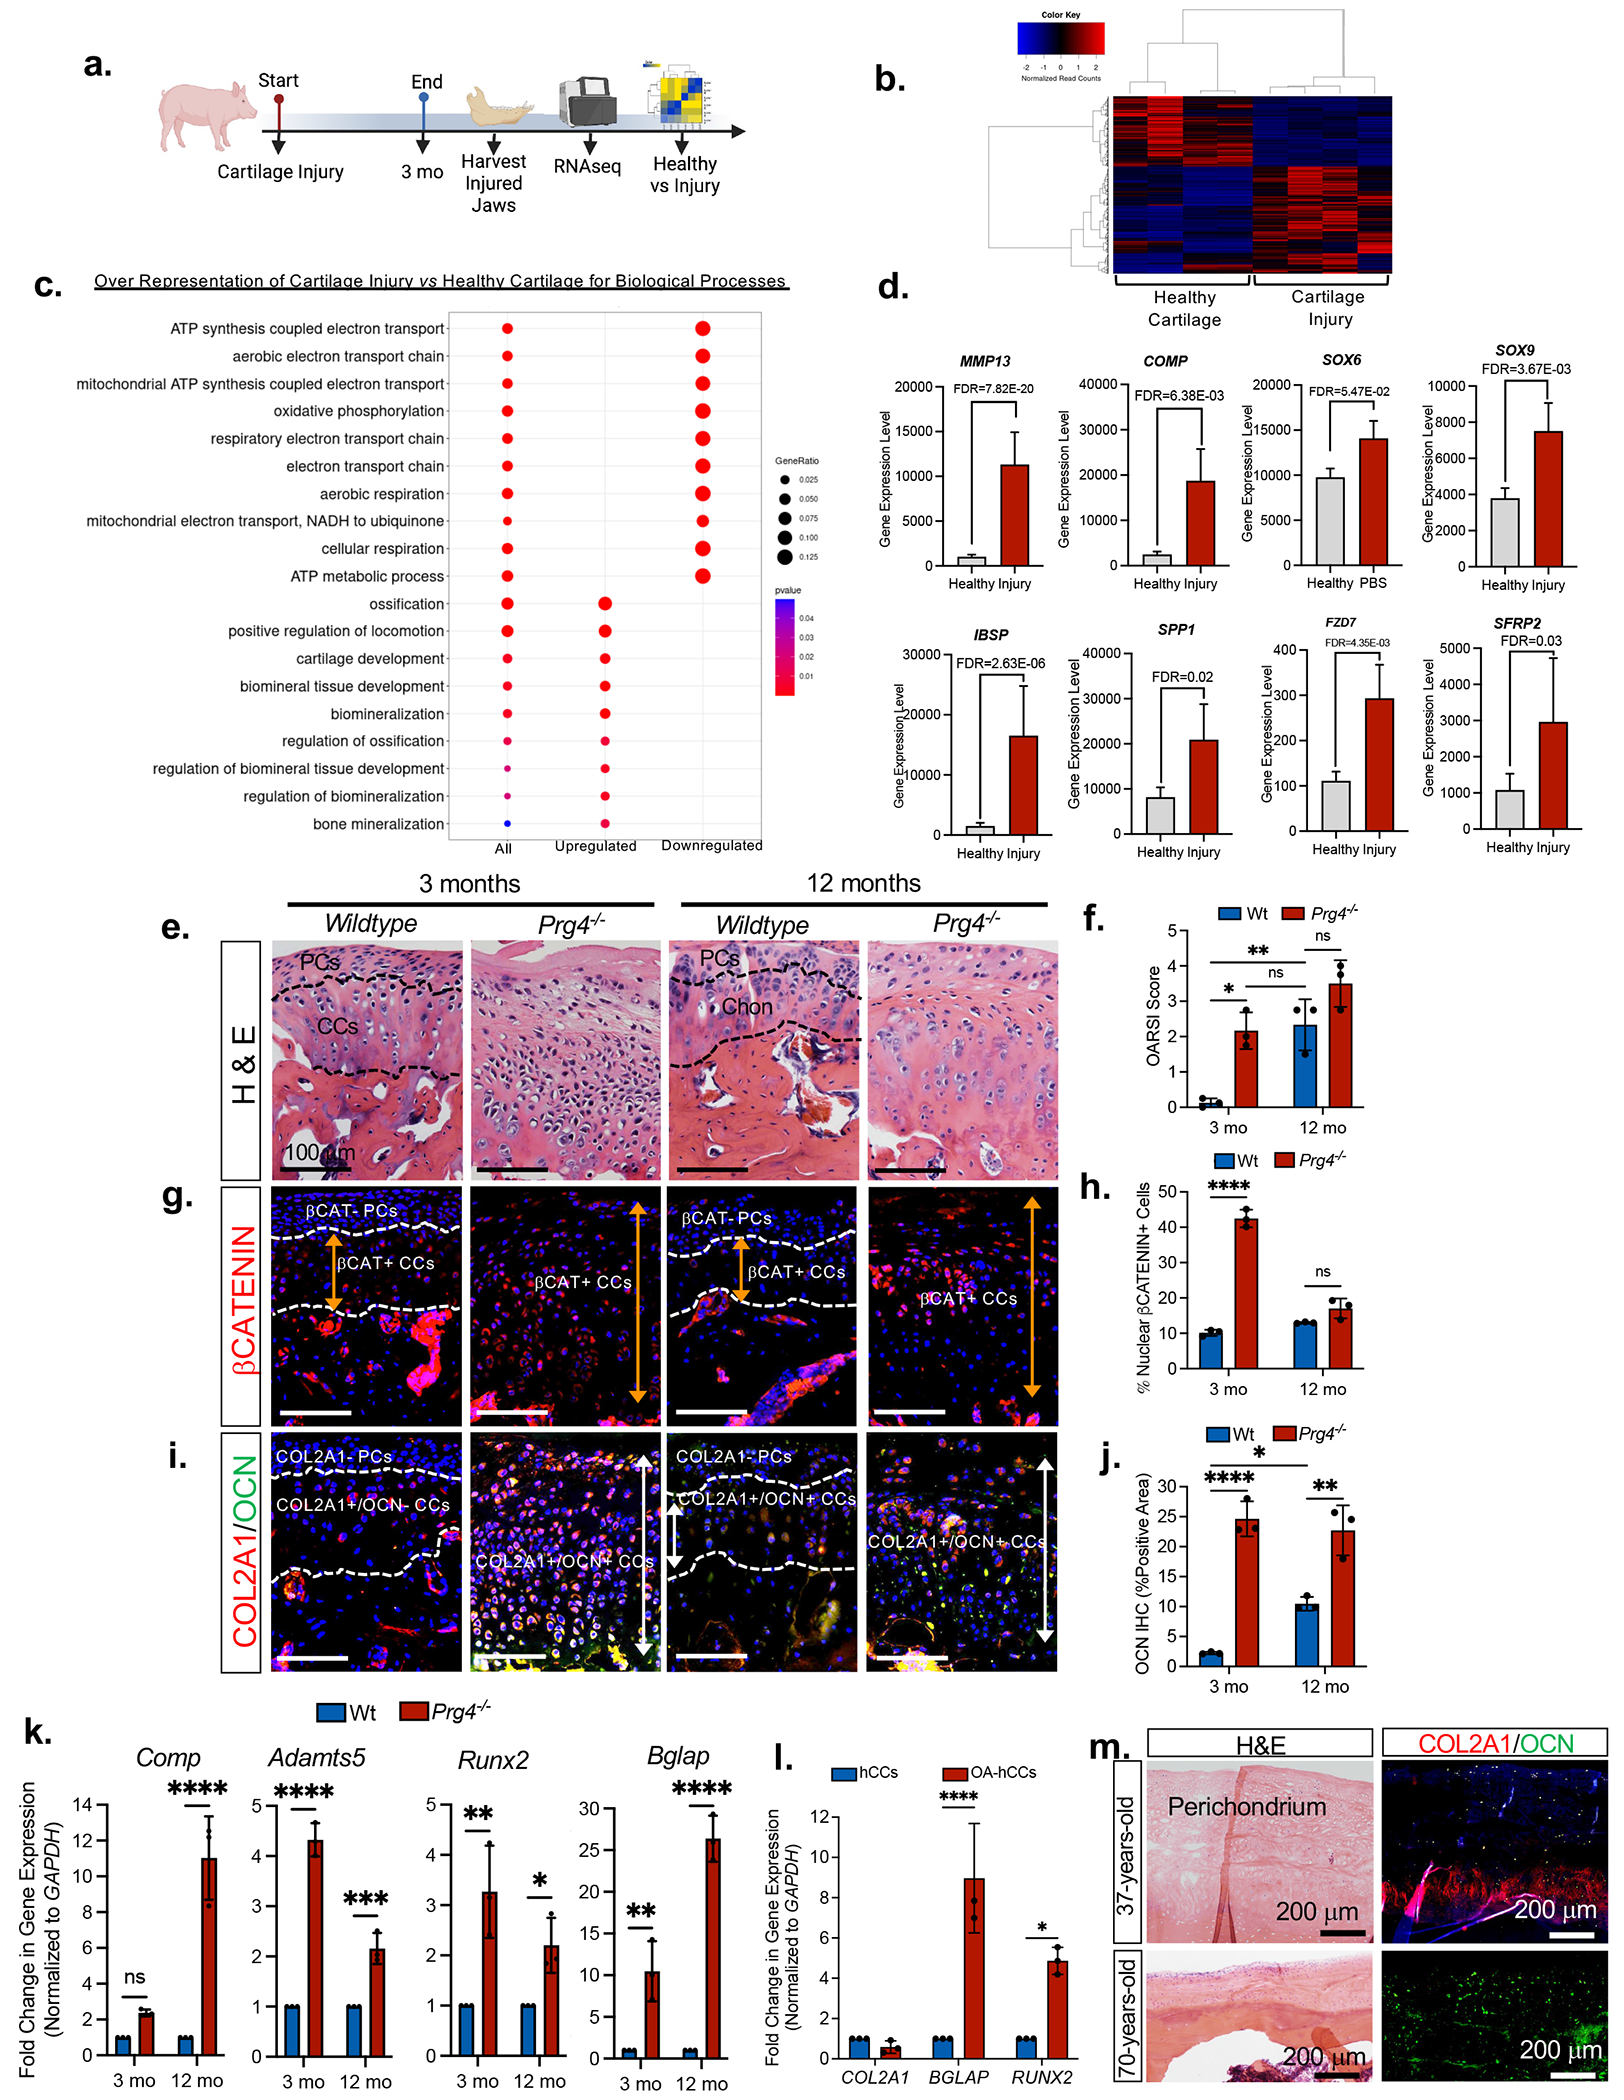
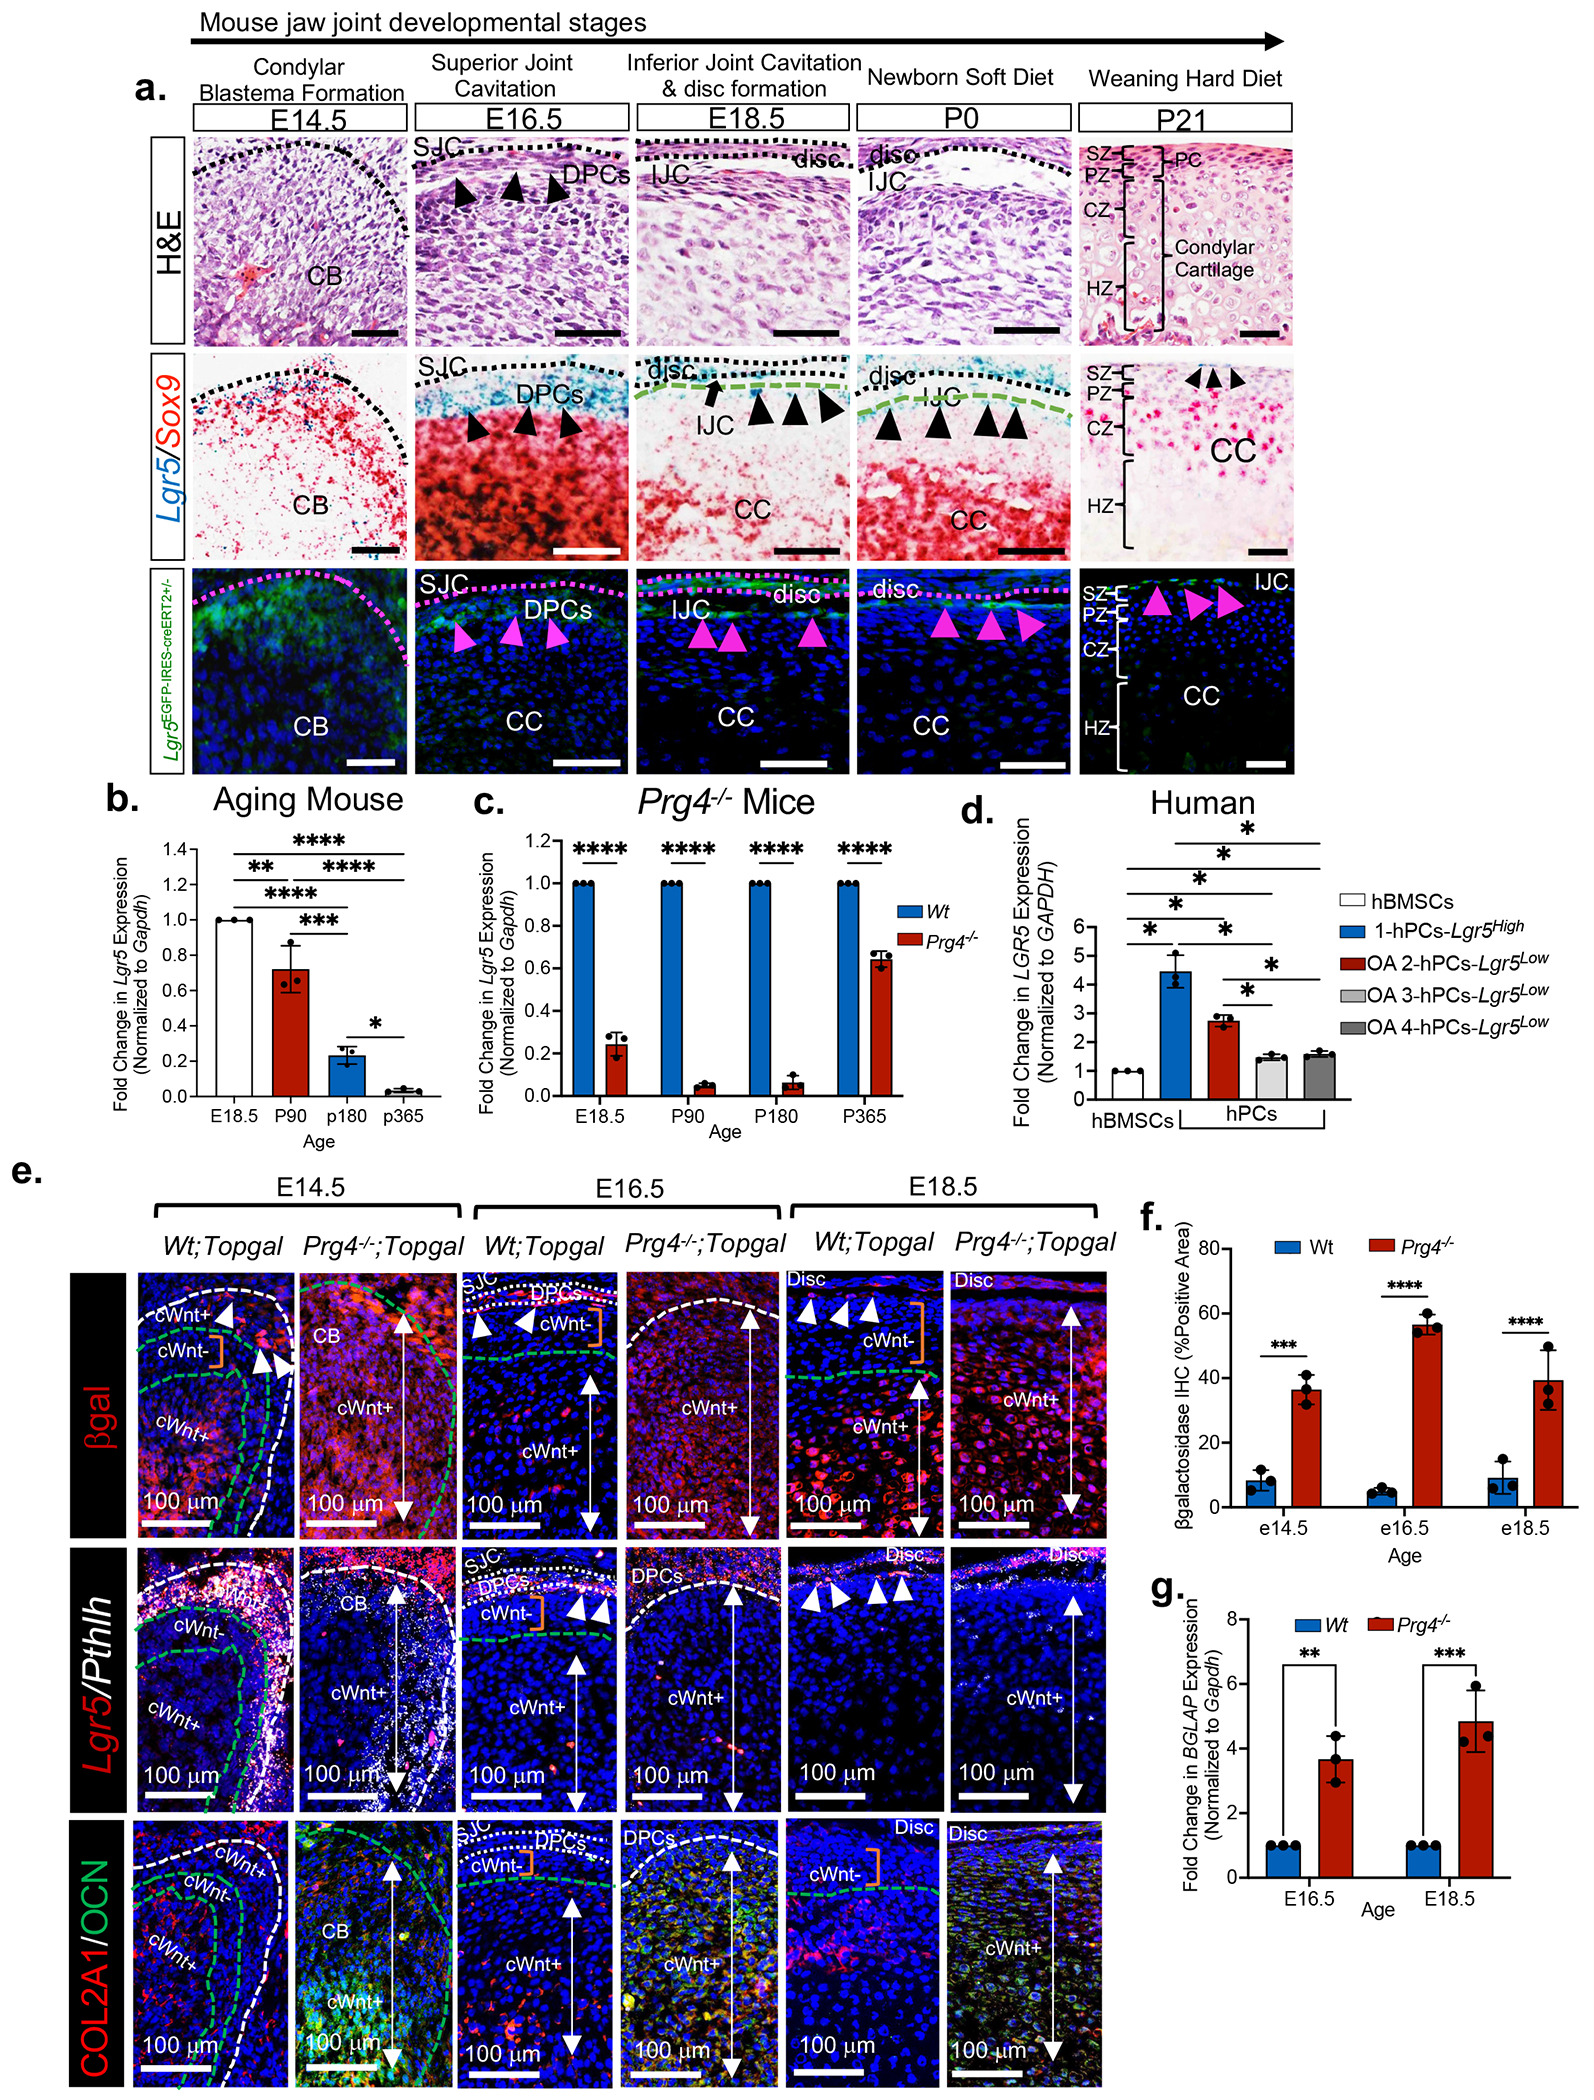
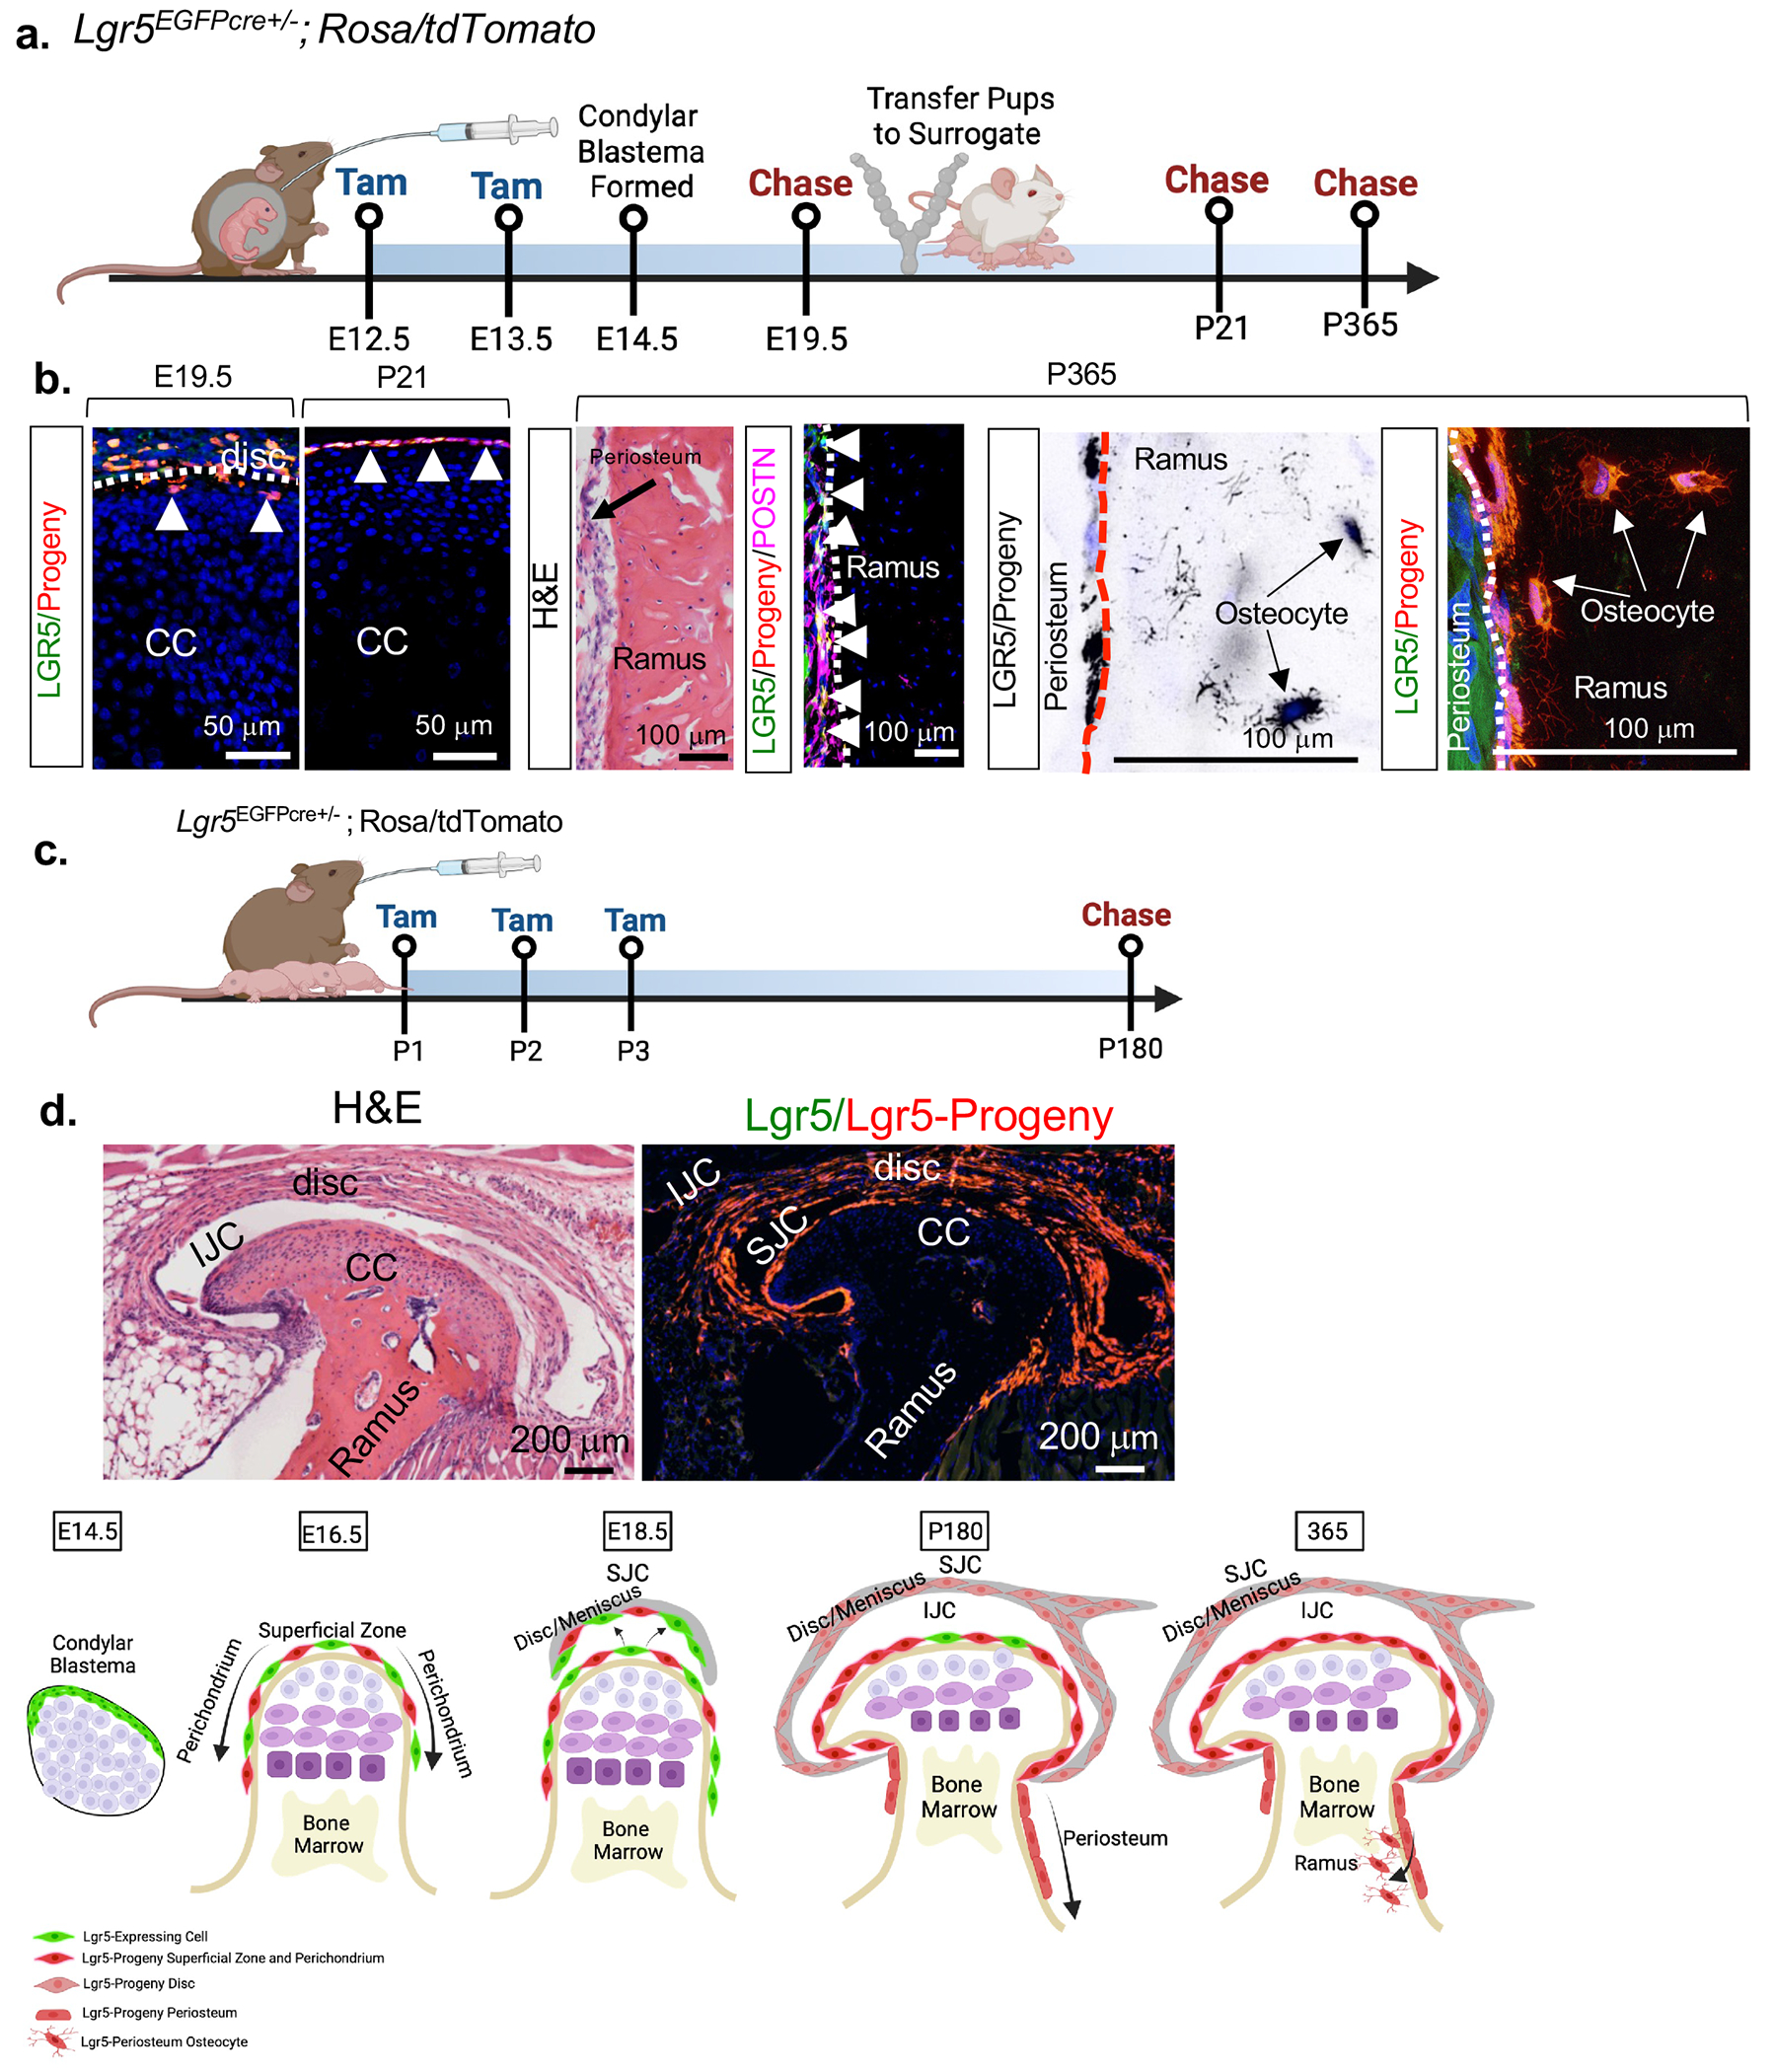
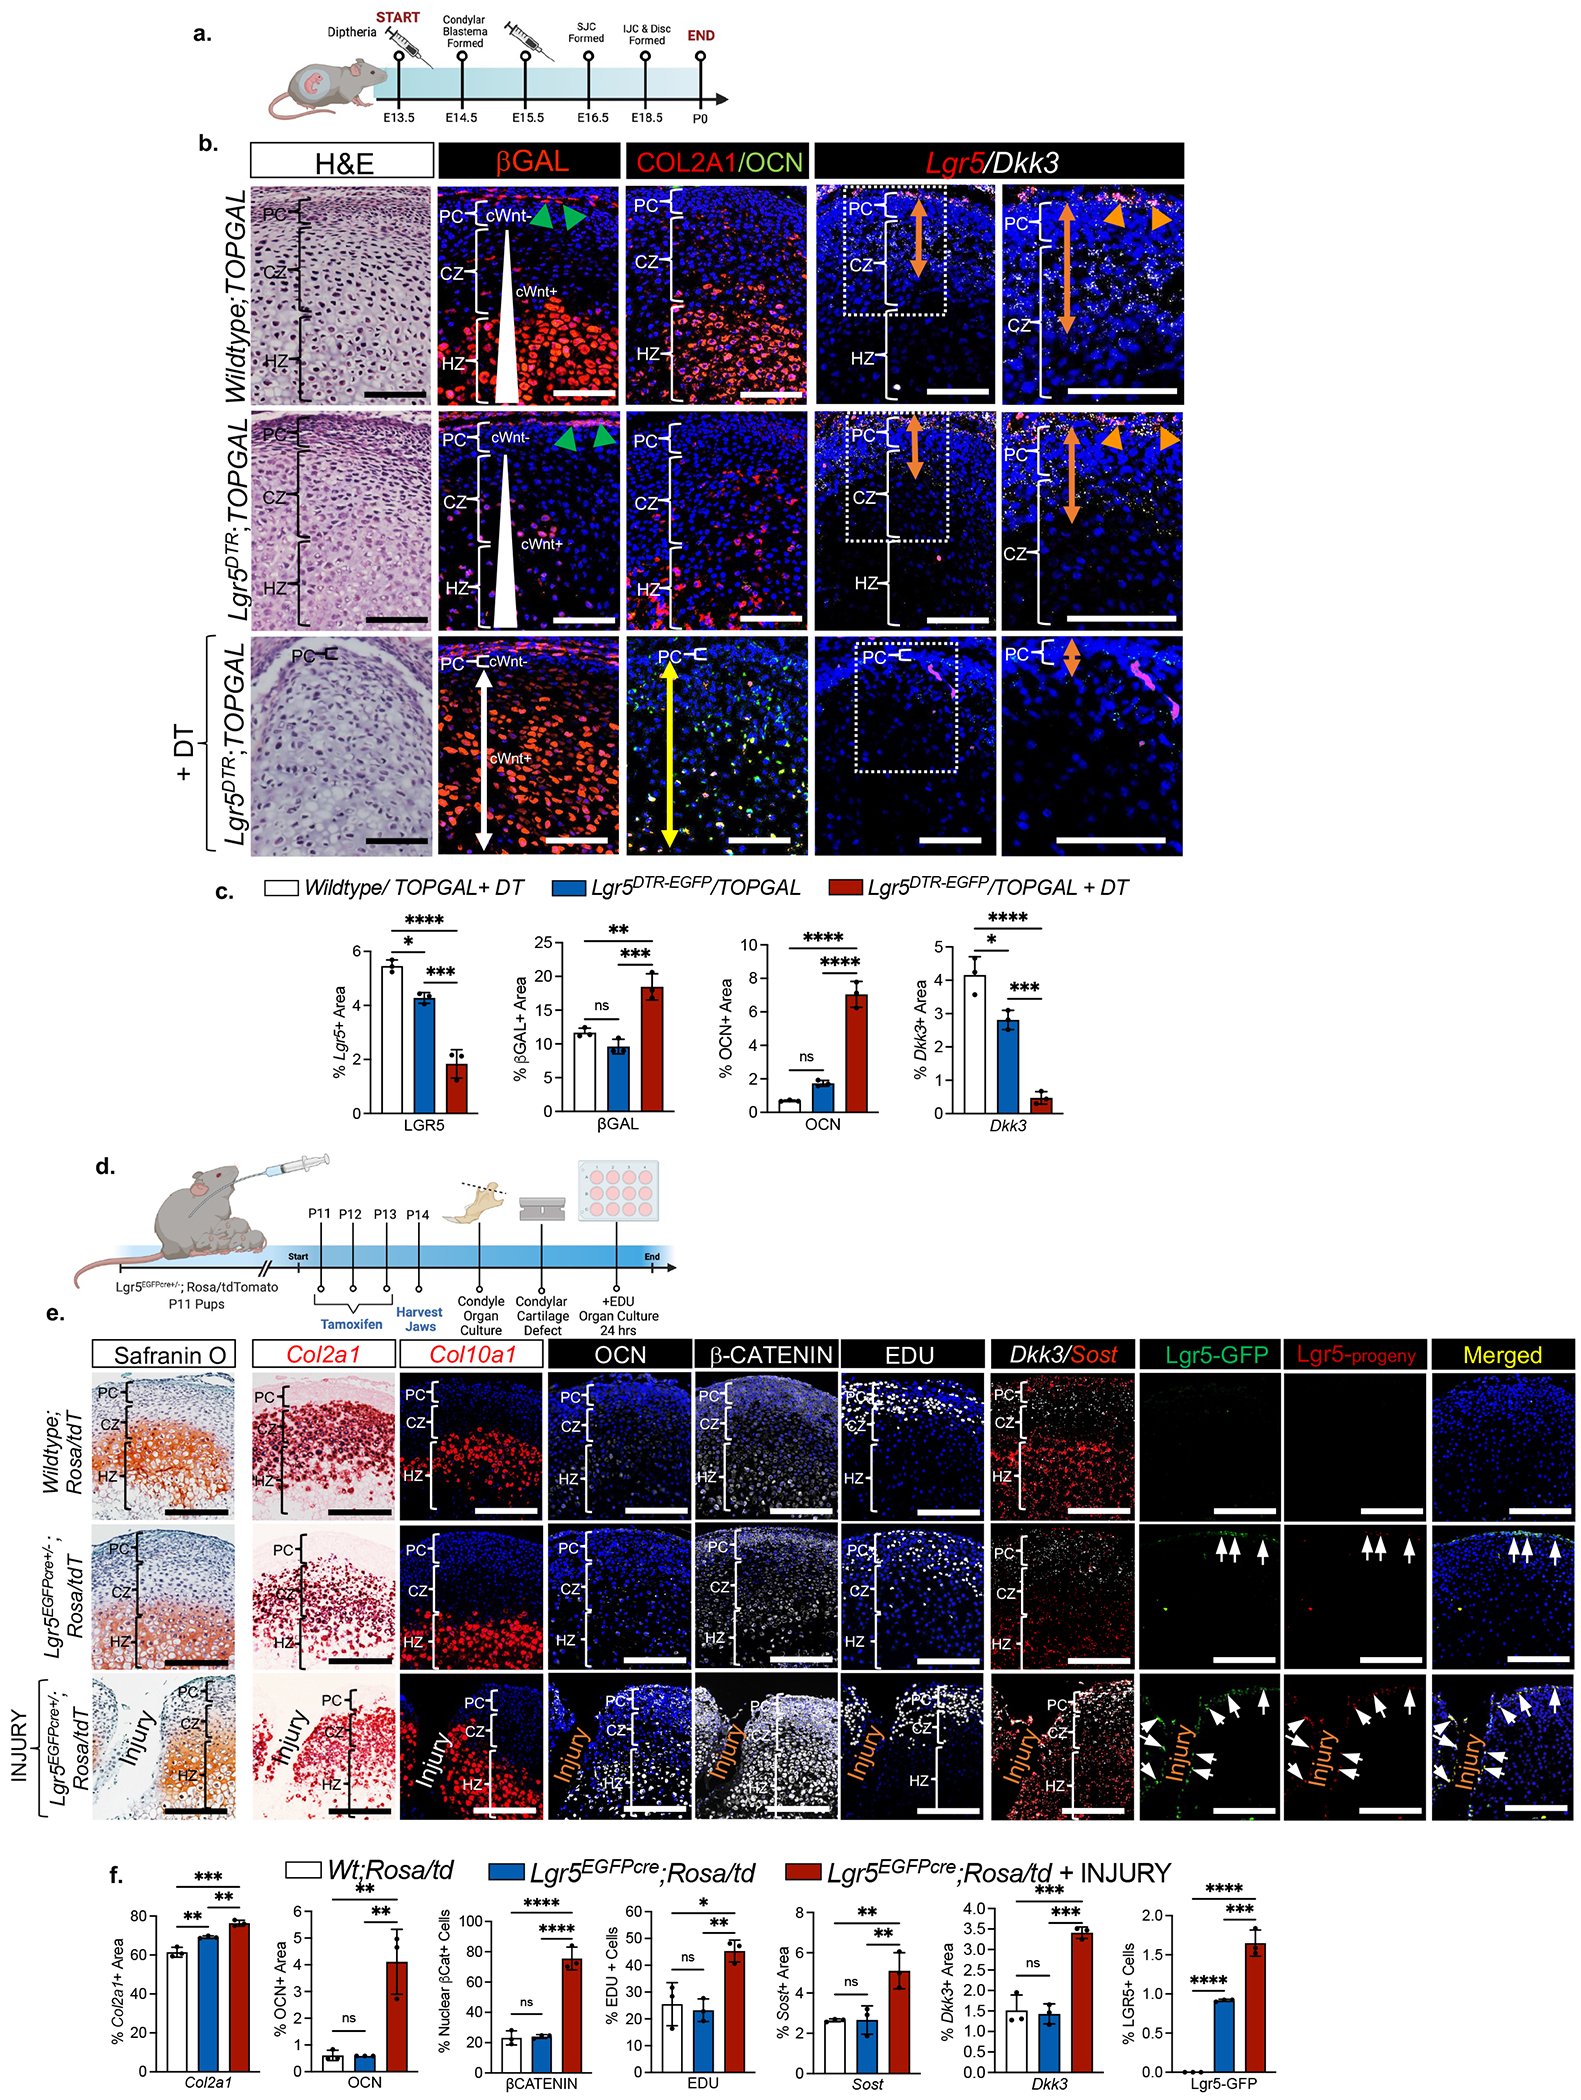
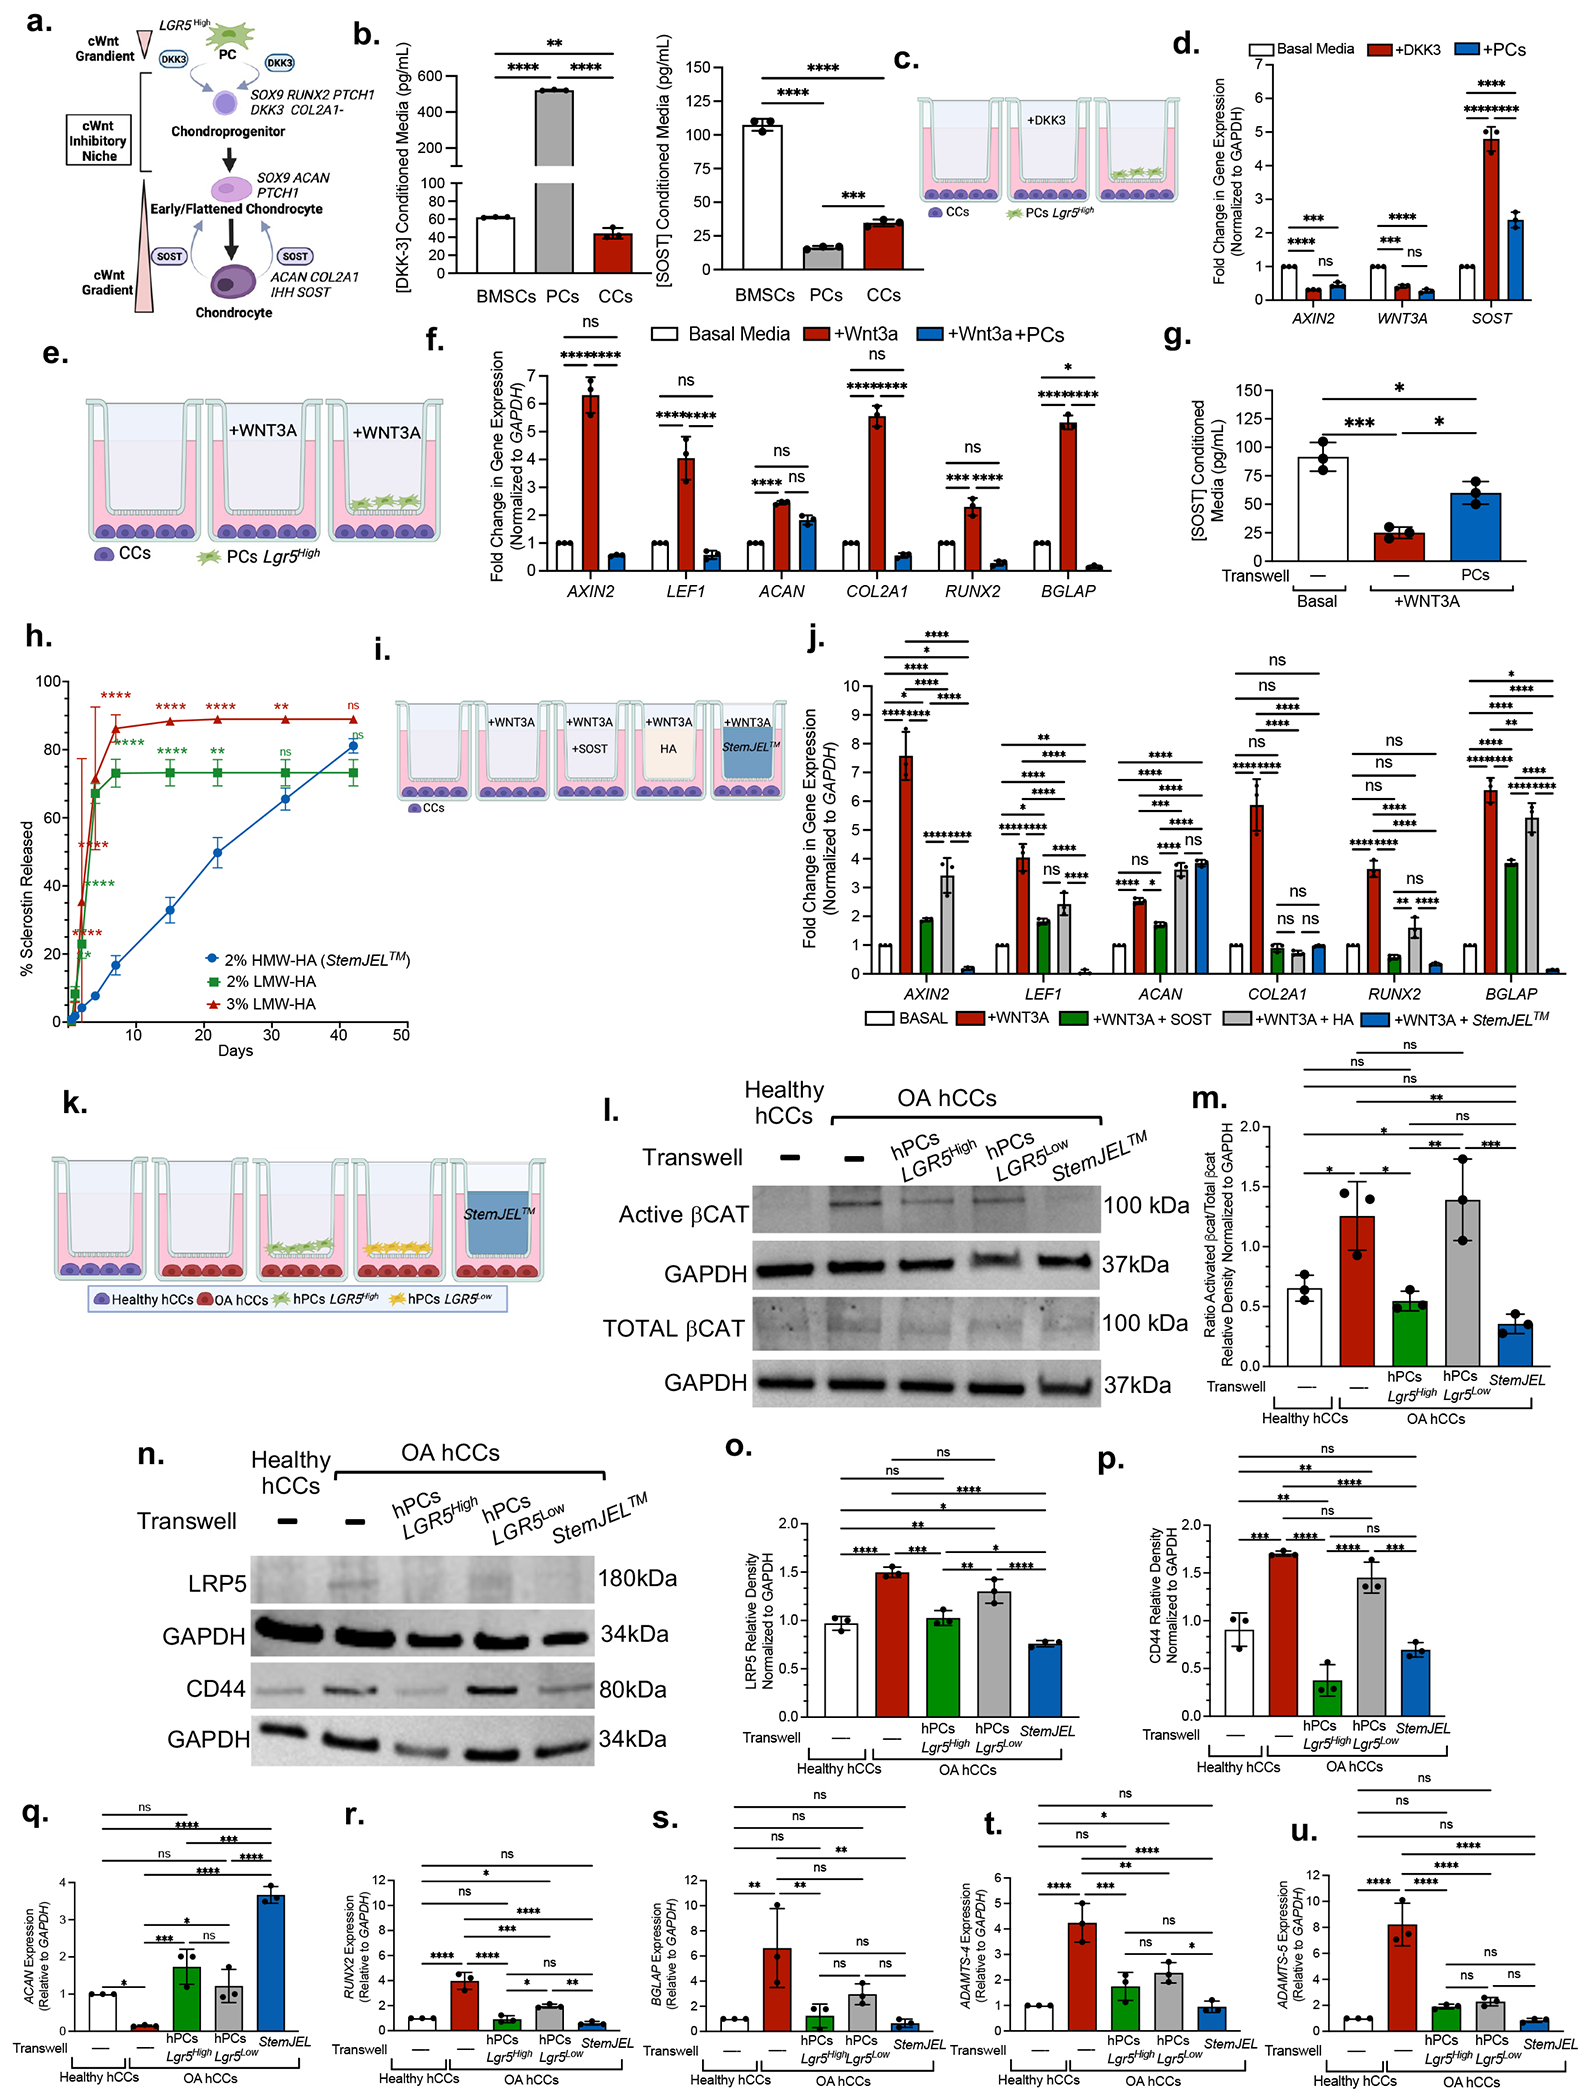
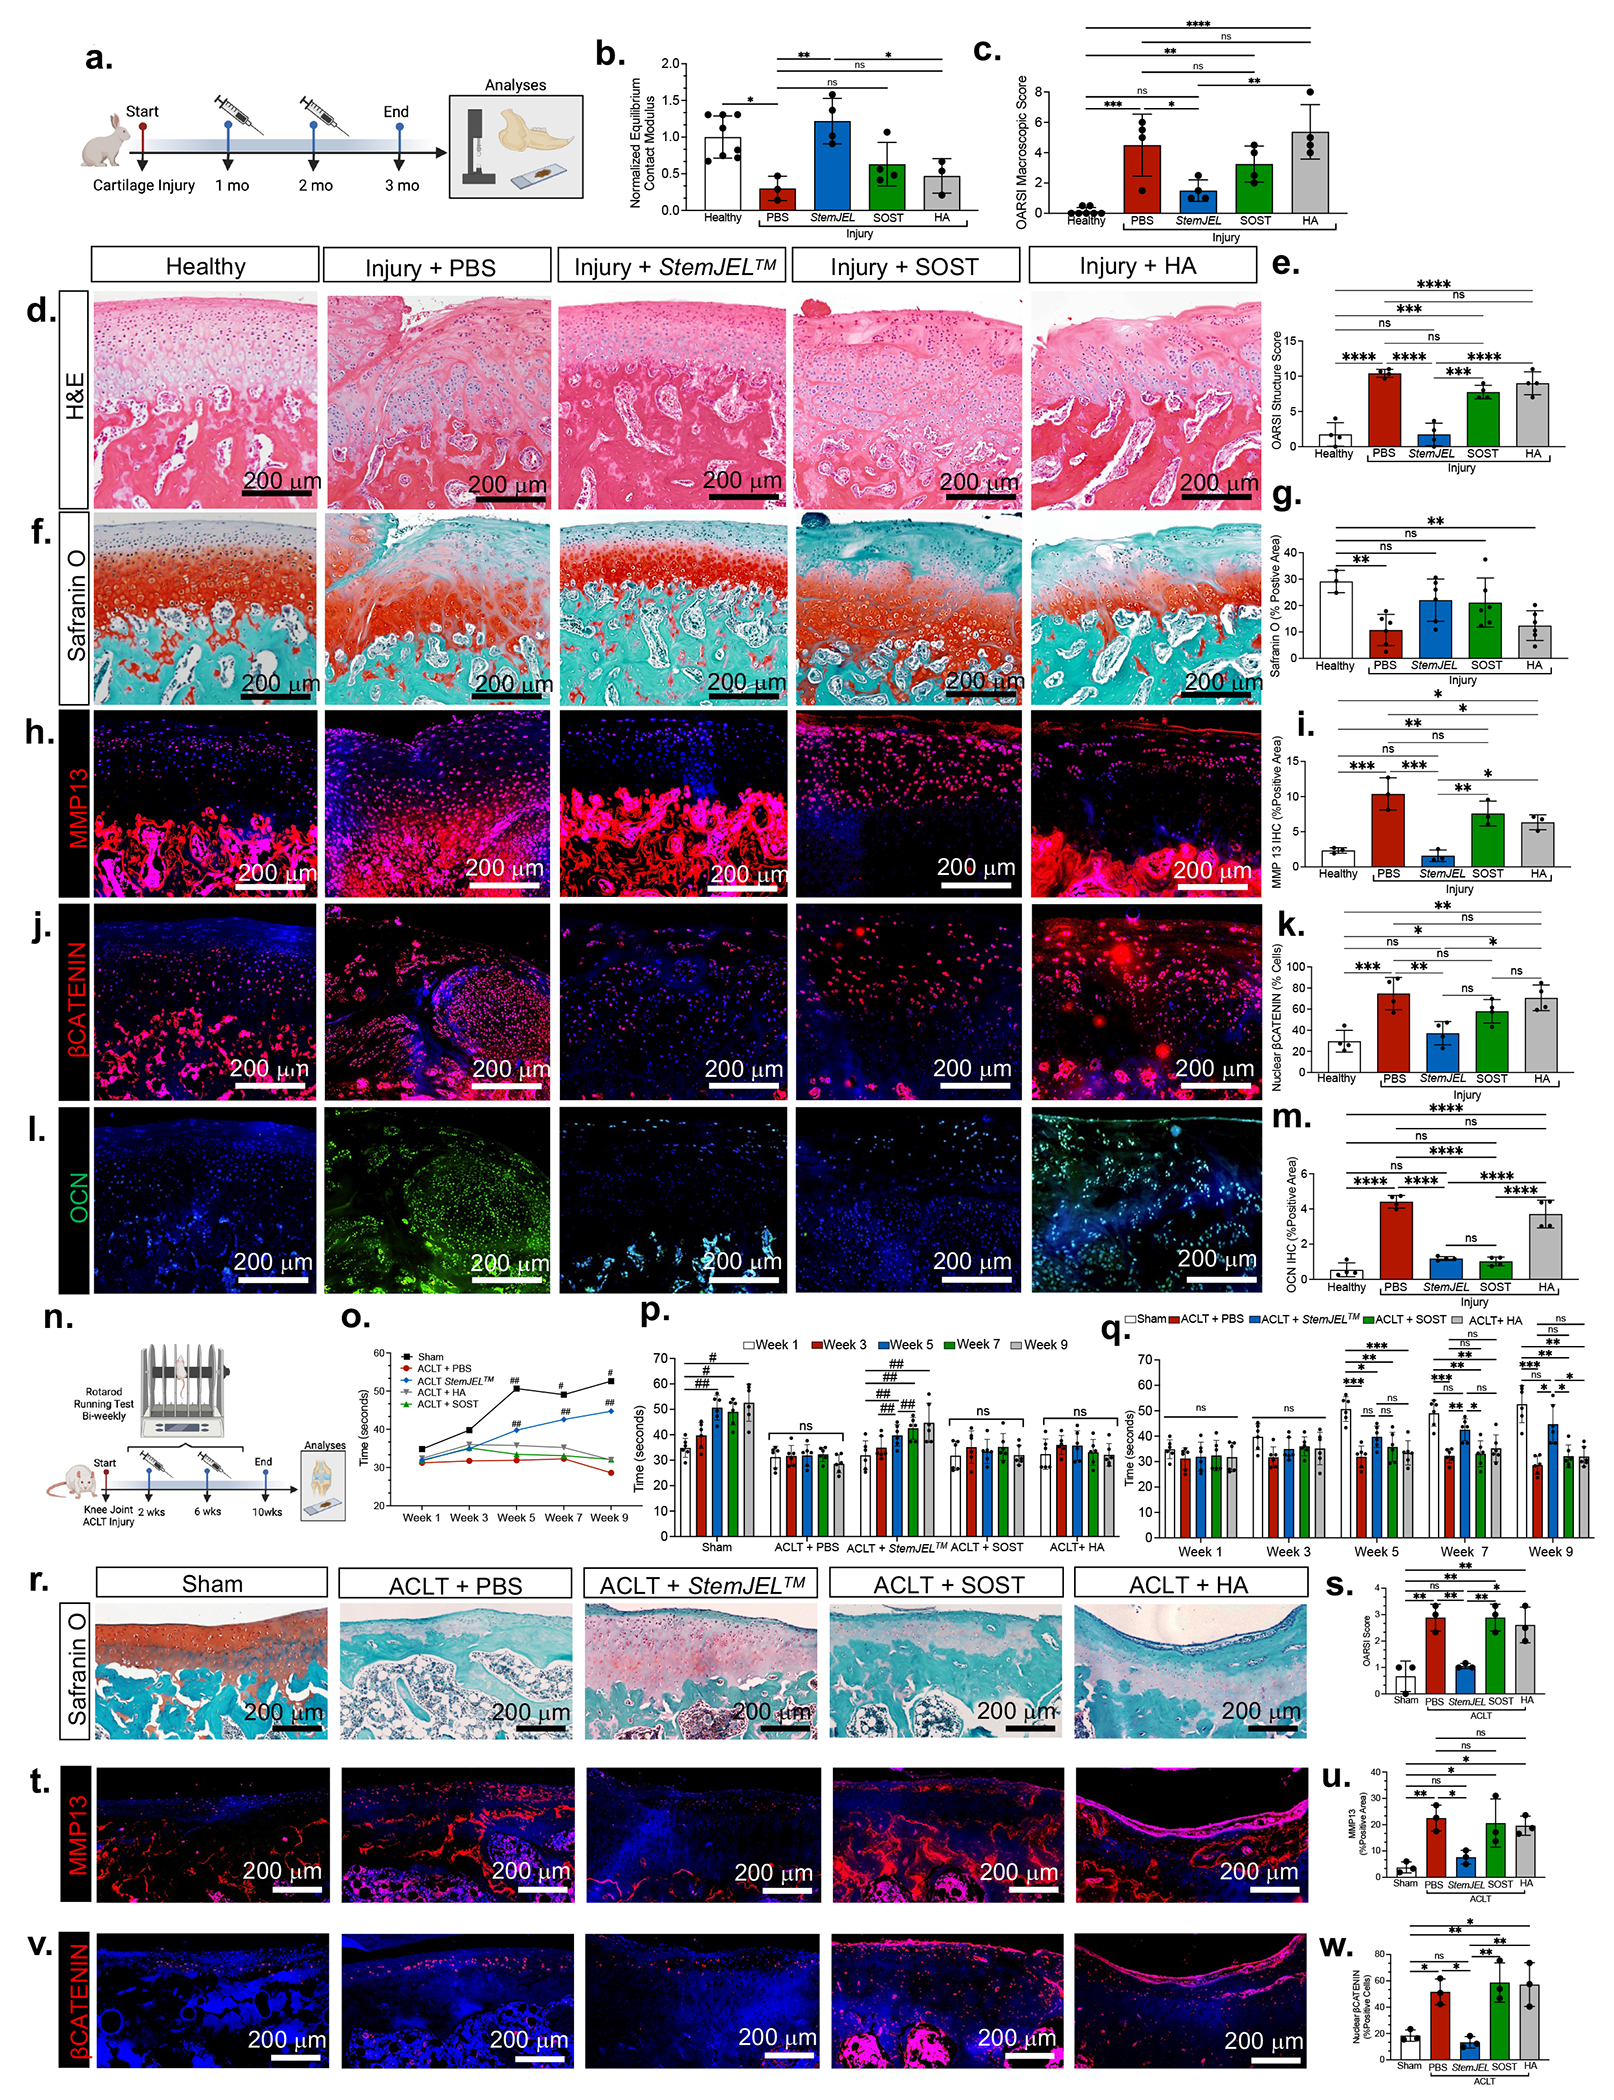
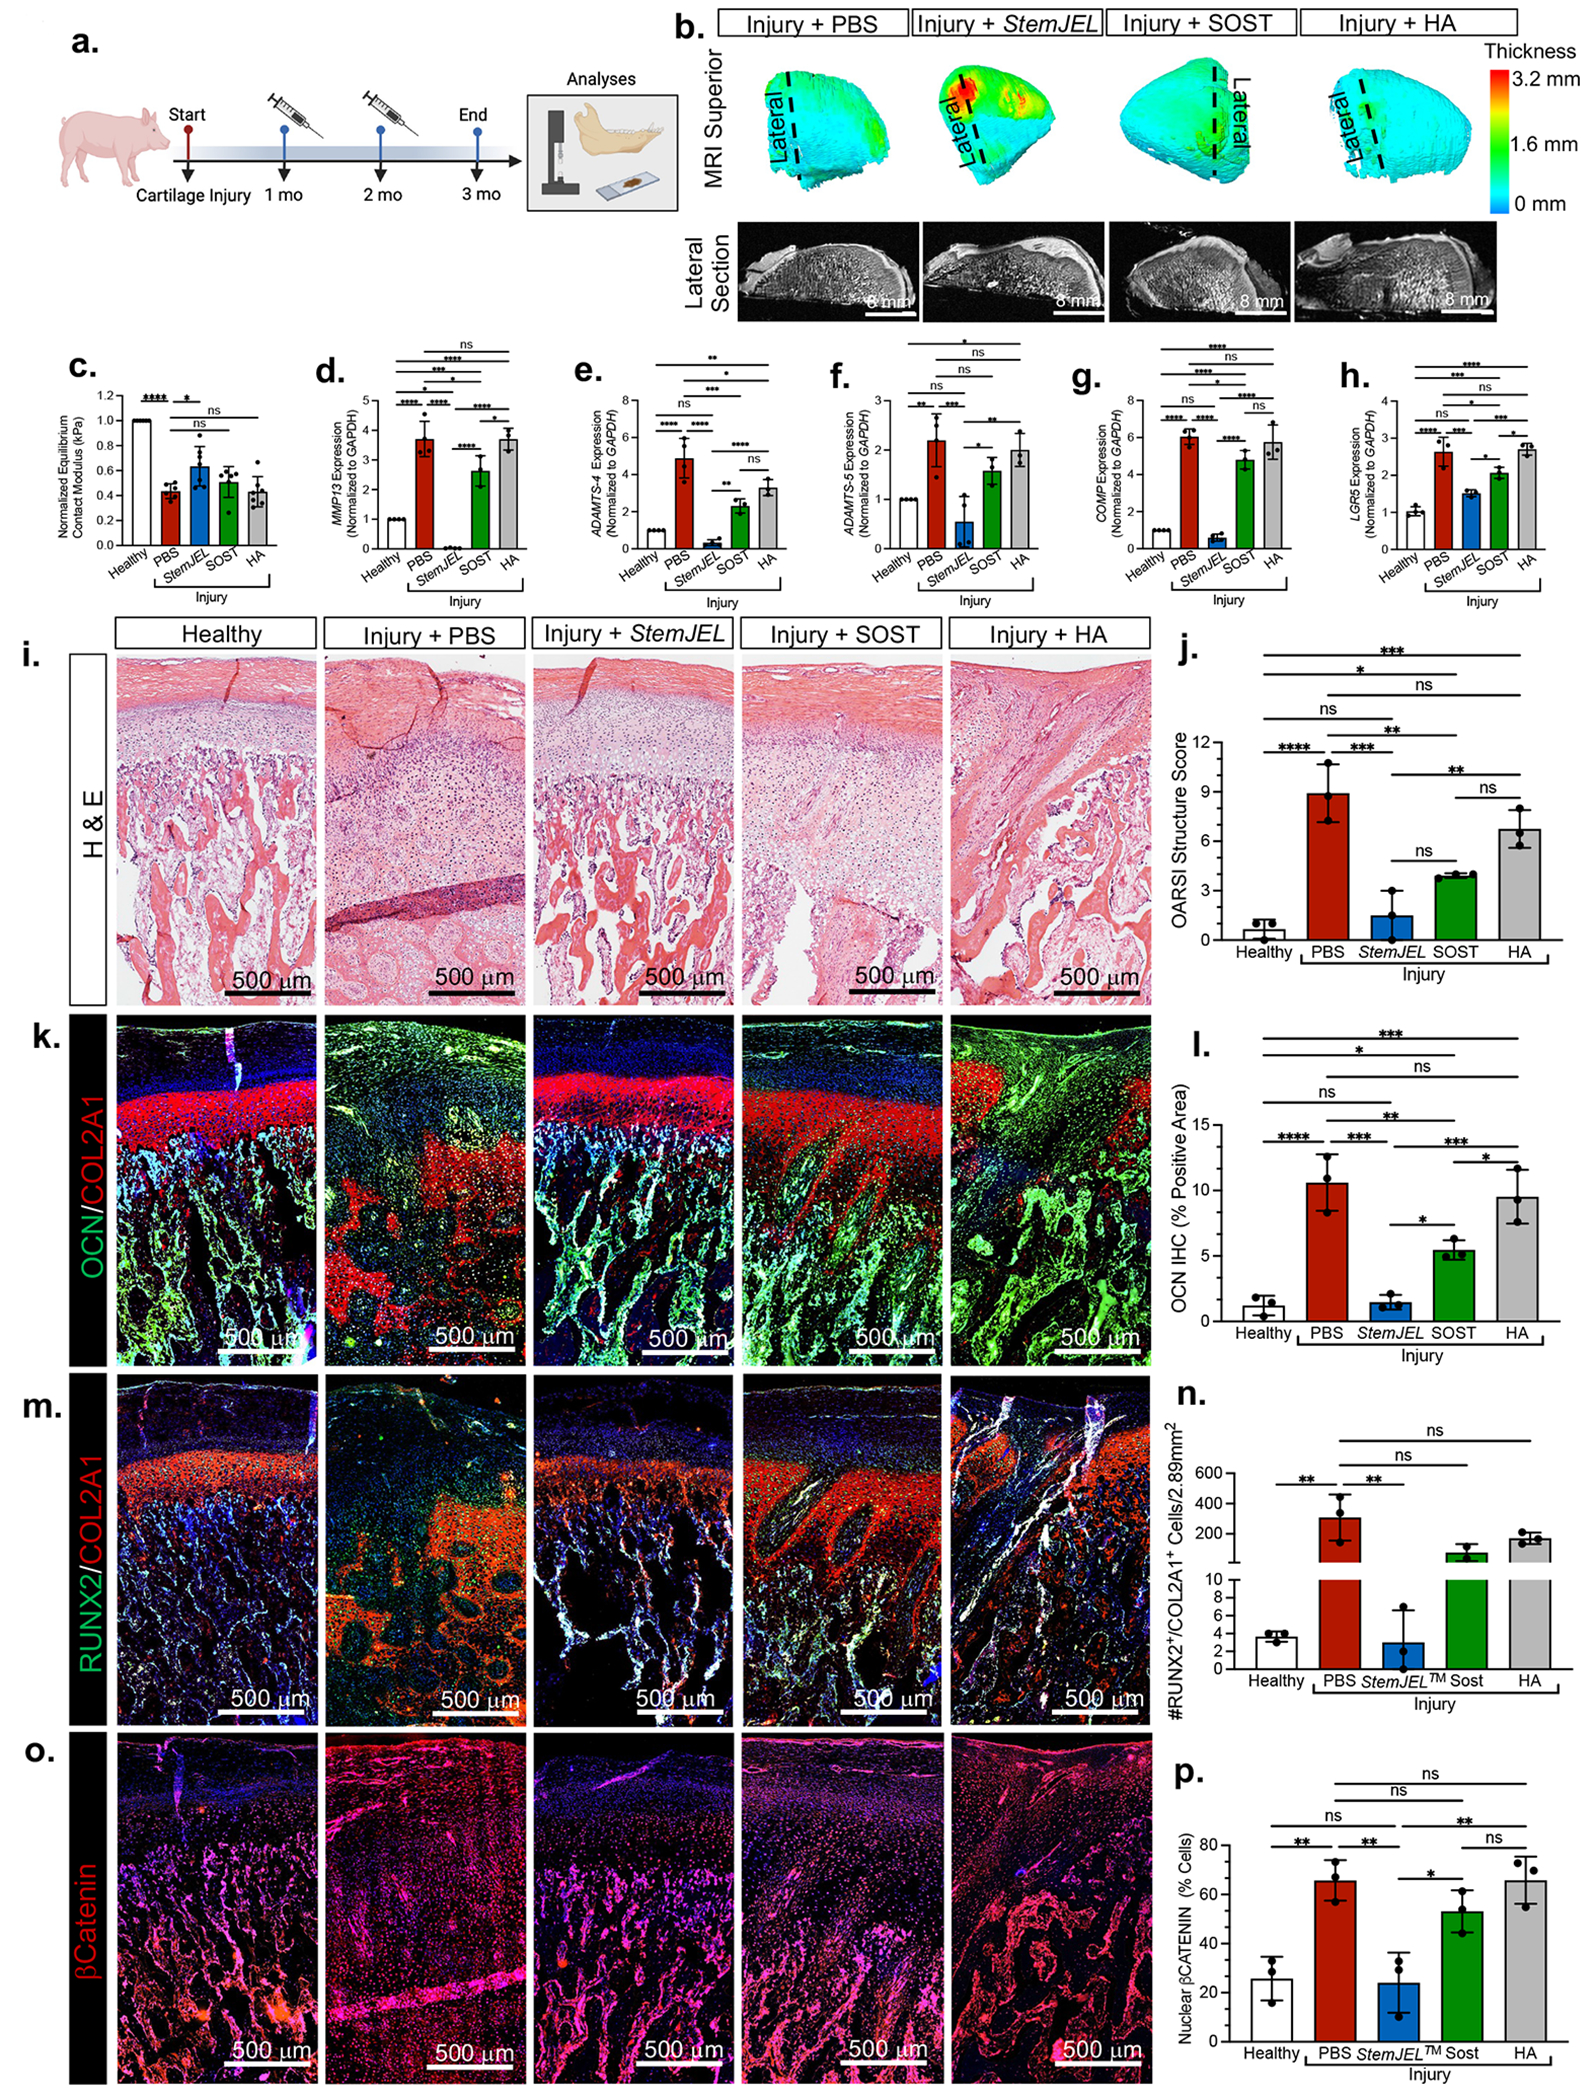
Osteoarthritis is a degenerative joint disease that causes pain, degradation, and dysfunction. Excessive canonical Wnt signaling in osteoarthritis contributes to chondrocyte phenotypic instability and loss of cartilage homeostasis; however, the regulatory niche is unknown. Using the temporomandibular joint as a model in multiple species, we identify Lgr5-expressing secretory cells as forming a Wnt inhibitory niche that instruct Wnt-inactive chondroprogenitors to form the nascent synovial joint and regulate chondrocyte lineage and identity. Lgr5 ablation or suppression during joint development, aging, or osteoarthritis results in depletion of Wnt-inactive chondroprogenitors and a surge of Wnt-activated, phenotypically unstable chondrocytes with osteoblast-like properties. We recapitulate the cartilage niche and create StemJEL, an injectable hydrogel therapy combining hyaluronic acid and sclerostin. Local delivery of StemJEL to post-traumatic osteoarthritic jaw and knee joints in rabbit, rat, and mini-pig models restores cartilage homeostasis, chondrocyte identity, and joint function. We provide proof of principal that StemJEL preserves the chondrocyte niche and alleviates osteoarthritis.

Keywords: Lgr5; WNT signaling; articular cartilage; biomaterials; chondroprogenitor cells; hydrogels; osteoarthritis; regeneration; skeletal development; stem cell niche; synovial joint; temporomandibular joint.


Conflict of interest statement

Declaration of interests M.C.E. and M.C. are inventors of a patent application on an osteoarthritis therapy related to this work (US patent 17/253993), which has been licensed to Wnt Scientific for commercialization. M.C. is a founder and equity holder of Wnt Scientific. H.Y. is an advisor and equity holder of Wnt Scientific.

Figures

Figure 1.
Figure 1.. Osteoarthritic chondrocytes are phenotypically unstable and have high Wnt/β–CATENIN.
(a) Schematic depicting miniature pig cartilage injury model. (b) Gene expression heat map and hierarchical clustering for 993 genes significantly up- or downregulated (FC > ±2, FDR-adjusted p value=0.05) in injured cartilage (versus healthy). (c) Dot plot of GO terms of biological processes from B. (d) Relative gene expression levels from GO enrichment analyses. (e) H&E staining and (f) OARSI scores of Wildtype and Prg4−/− mice. Data presented are mean score from 3 reviewers ± SD. *p≤0.05, **p≤0.01; Two-way ANOVA followed by Tukey’s post hoc; n=3 mice. (g) Immunohistochemistry of βCatenin expression in Wildtype and Prg4−/− mice. PCs=perichondrial cells, CCs=condylar chondrocytes (h) Percentage of nuclear β-CATENIN-expressing cells in Wildtype and Prg4−/− mice. Data are mean percentage ± SD normalized to total cell number; ***p≤0.001; Two-way ANOVA followed by Tukey’s post hoc; n=3 mice. (i) Representative image of immunohistochemistry of type II collagen (COL2A1) and osteocalcin (OCN) in Wildtype and Prg4−/− mice. (j) Area of OCN expression from immunohistochemistry in Wildtype and Prg4−/− mice. Data are mean % area ± SD normalized to total area; *p≤0.05; **p≤0.01; ****p≤0.0001; Two-way ANOVA followed by Tukey’s post hoc; n=3 mice. (k) qRT-PCR using Wildtype and Prg4−/− mouse condyles. Data presented are mean fold change ± SD normalized to GAPDH. *p≤0.05, **p≤0.01, ***p≤0.001, ****p≤0.0001; two-way ANOVA followed by Tukey’s post hoc; n=3 mice. (l) qRT-PCR using healthy human mandibular condylar chondrocytes (hMCCs) relative to osteoarthritic human mandibular condylar chondrocytes (OA-hMCCs). Data are mean fold change ± SD normalized to GAPDH. *p≤0.05, ***p≤0.001; two-way ANOVA followed by Tukey’s post hoc; n=3 experiments. (m) H&E and immunohistochemistry of type II collage (COL2A1) and osteocalcin (OCN) in the mandibular condylar cartilages of a healthy 37-year-old and a 70-year-old OA patient .
Figure 2.
Figure 2.. Lgr5 expression is enriched in the superficial zone of articular cartilage perichondrium, but decreases in aging and osteoarthritis.
(a) H&E images (top row) of key mouse jaw joint developmental stages. in situ hybridization (middle row) of Lgr5 (black triangles) and Sox9 genes in mice. Lgr5-GFP cells (bottow row, pink triangles) in jaw joint superficial zone of Lgr5EFPcre+/− mice. CB=condylar blastema; DPCs=disc progenitor cells; SJC=superior joint cavity; CC=mandibular condylar cartilage; IJC=inferior joint cavity (black arrow), SZ=superficial zone, PZ=polymorphic zone, PC= perichondrium, CZ=chondrocyte zone, HZ=hypertrophic zone. (b) qRT-PCR of Lgr5 in aging mice. (c) qRT-PCR of Lgr5 in Wildtype and Prg4−/− mouse condyles. Data are mean fold change ± SD normalized to GAPDH. ****p≤0.0001; two-way ANOVA followed by Tukey’s post hoc; n=3 mice. (d) qRT-PCR using human bone marrow stromal cells (hBMSCs), healthy human perichondral cells (hPCCs LGR5High) and osteoarthritic human perichondrial cells (OA-2-4-hPCCs LGR5Low). Data are mean fold change ± SD normalized to GAPDH. *p≤0.05; two-way ANOVA followed by Tukey’s post hoc; n=3 experiments. (e) in situ hybridization of Lgr5 and Pthlh and immunohistochemistry of βgalactosidase (βgal), type II collagen (COL2A1) and osteocalcin (OCN) Wt;Topgal and Prg4−/−;Topgal mouse condyles. CB=condylar blastema, SJC=superior joint cavity, DPCs=disc progenitor cells, cWnt+=canonical WNT activity (white arrows), cWnt− = cWnt inactivity (orange bar), white triangles=Lgr5-expressing cells. (f) Quantification of βgal immunostainings from 2e. Data presented are mean % area ± SD normalized to total area; ***p≤0.001; ****p≤0.0001; Two-way ANOVA followed by Tukey’s post hoc; n=3 mice. ***p≤0.01 (g) qRT-PCR of Wildtype and Prg4−/− condyles. Data are mean fold change in gene expression ± SD normalized to GAPDH. **p≤0.01, ***p≤0.001; two-way ANOVA followed by Tukey’s post hoc; n=3 mice.
Figure 3.
Figure 3.. Lor5-expressing cells supply progeny to synovial joint meniscus/disc, articular cartilage superficial zone, perichondrium, periosteum and bone, but do not become chondroprogenitor cells or chondrocytes.
(a) Schematic of lineage tracing experiment in b. (b) Fluorescent imaging and immunostainings for lineage tracing in A. CC=mandibular condylar cartilage. (c) Schematic of lineage tracing experiment in d. (d) Fluorescent imaging for lineage tracing in C. CC=mandibular condylar cartilage, IJC=inferior joint cavity, SJC=superior joint cavity. (e) Proposed model.
Figure 4.
Figure 4.. Lar5-expressing cells provide a Wnt inhibitory niche critical for maintaining chondroprogenitor cell pool and chondrocyte phenotypic identity.
(a) Experimental timeline of Lgr5 ablation. (b) H&E staining, immunohistochemistry of βgalactosidase (βgal), type II collagen (COL2A1) and osteocalcin (OCN), and in situ hybridization of Lgr5 and Dkk3 in P0 mice from experiment in 4a. PC=perichondrium, CZ=chondrocyte zone, HZ=hypertrophic zone. Green triangles=cWnt-activated superficial zone cells in perichondrium, white triangle = cWnt gradient, white arrow=cWnt activated cells, yellow arrow=area of OCN expression, orange arrow = area of Dkk3 expression, orange triangles= Lgr5/Dkk3-expressing cells. (c) Quantification of immunohistochemistry and in situ hybridization from 4b. Data are mean % area expression ± SD normalized to total area; *p≤0.05, **p≤0.01, ***p≤0.001, ****p≤0.0001; one-way ANOVA followed by Tukey’s post hoc; n=3 mice. (d) Schematic of cartilage injury model using organ cultures. (e) Safranin O staining, in situ hybridization of Col2a1, Col10a1, Dkk3, and Sost, immunohistochemistry of osteocalcin (OCN) and βCatenin, EDU uptake, and Lgr5-GFP+ cells (green) and Lgr5-progeny (red) in mice from experiment in 4d. Quantification of immunohistochemistry, in situ hybridization, EDU+ cells, and Lgr5-GFP+ cells from experiment in 4d. Data are mean % area expression ± SD normalized to total area; **p≤0.01, ***p≤0.001, ****p≤0.0001; one-way ANOVA followed by Tukey’s post hoc; n=3 mice.
Figure 5.
Figure 5.. StemJEL recapitulates the Wnt inhibitory niche in cartilage and rescues chondrocyte phenotypic identity.
(a) Schematic model. (b) ELISA using conditioned media from mini-pig-derived cells. Data are mean protein concentration ± SD. **p≤0.01, ***p≤0.001, ****p≤0.0001; one-way ANOVA followed by Tukey’s post hoc; n=3 experiments. (c) Experimental schematic in d. (d) qRT-PCR of CCs from c. Data presented are mean fold change ± SD normalized to GAPDH. ***p≤0.001, ****p≤0.0001; two-way ANOVA followed by Tukey’s post hoc; n=3 experiments. (e) Experimental schematic in f-g. (f) qRT-PCR of CCs in e. Data are mean fold change ± SD normalized to GAPDH; *p≤0.05, **p≤0.01, ***p≤0.001, ****p≤0.0001; two-way ANOVA followed by Tukey’s post hoc; n=3 experiments. (g) ELISA using conditioned media in e. Data presented are mean ± SD. *p≤0.05, ***p≤0.001; one-way ANOVA followed by Tukey’s post hoc; n=3 experiments. (h) SOST release curve. Data are mean ± SD; *p≤0.05 **p≤0.01; ***p≤0.001; ****p≤0.0001 relative to Day 0, two-way ANOVA followed by Tukey’s post hoc; n=3 experiments. (i) Experimental schematic in j. (j) qRT-PCR of CCs in i. Data are mean fold change ± SD normalized to GAPDH; *p≤0.05, **p≤0.01, ***p≤0.001, ****p≤0.0001; two-way ANOVA followed by Tukey’s post hoc; n=3 experiments. (k) Experimental schematic of l-u (I) Western blot analyses in k. (m) Quantification of westerns in k-l. Data are mean ± SD normalized to GAPDH; *p≤0.05, **p≤0.01, ***p≤0.001; one-way ANOVA followed by Tukey’s post hoc; n=3 experiments. (n) Western blot in k. (o,p) Quantification of western blots n. Data presented are mean ± SD normalized to GAPDH; *p≤0.05, **p≤0.01, ***p≤0.001; one-way ANOVA followed by Tukey’s post hoc; n=3 experiments. (q-u) qRT-PCR of OA hCCs in k. Data are mean fold change ± SD normalized to GAPDH; *p≤0.05, **p≤0.01, ***p≤0.001, ****p≤0.0001; one-way ANOVA followed by Tukey’s post hoc; n=3 experiments.
Figure 6.
Figure 6.. StemJEL ameliorates post-traumatic osteoarthritis and restores chondrocyte identity in rabbit temporomandibular joints and rat knee joints.
(a) Schematic of rabbit TMJ injury model. (b) Normalized equilibrium contact modulus in rabbit condyles in a. Data are normalized mean ± SD; *p≤0.05, **p≤0.01; one-way ANOVA followed by Tukey’s post hoc; n=3-8 rabbits. (c) OARSI macroscopic score of rabbits a. Data are mean ± SD; **p≤0.01, ***p≤0.001; one-way ANOVA followed by Tukey’s post hoc; n=3-8 rabbits. (d) H&E of rabbits in a. (e) OARSI structure score of rabbit condyles in a. Data are mean ± SD; ***p≤0.001, ****p≤0.0001; one-way ANOVA followed by Tukey’s post hoc; n=4 rabbits. (f) Safranin O of rabbit condyles in a. (g). Quantification of safranin O staining in f. Data are mean ± SD; **p≤0.01; one-way ANOVA followed by Tukey’s post hoc; n=3-6 rabbits. (h) Immunostaining of MMP13 in rabbits from a. (i) Area of MMP13 immunostaining in h. Data are mean ± SD; *p≤0.05, **p≤0.01, ***p≤0.001; one-way ANOVA followed by Tukey’s post hoc; n=3 rabbits. (j) Immunostaining of βCATENIN in rabbits from a. (k) Percentage of nuclear βCatenin+ cells j. Data are mean percent nuclear βCATENIN+ cells ± SD; *p≤0.05, **p≤0.01, ***p≤0.001; one-way ANOVA followed by Tukey’s post hoc; n=4 rabbits. (l) Immunohistochemistry of osteocalcin (OCN) in rabbits from a. (m) The area of OCN immunostaining in I. Data are mean area ± SD; ****p≤0.0001; one-way ANOVA followed by Tukey’s post hoc; n=4 rabbits. (n) Schematic of rat anterior cruciate ligament transection (ACLT) injury model. (o) Running time on rotarod of rats in n. Data are mean ± SD; *p≤0.05, **p≤0.01; significance is relative to time at week 1 within same group; repeated measures one-way ANOVA; n=6 rats. (p) Running time of rats depicted in n. Data presented are mean running time ± SD; #p≤0.05, ##p≤0.01; repeated measures one-way ANOVA; n=6 rats. (q) Running time on rotarod of rats depicted in n. Data presented are mean running time ± SD; *p≤0.01; **p≤0.01, ***p≤0.001; two-way ANOVA followed by Tukey’s post hoc; n=6 rats. (r) Safranin O staining of rat knees in n. (s) OARSI score of knee joints in n. Data are mean score ± SD; *p≤0.05, **p≤0.01; one-way ANOVA followed by Tukey’s post hoc; n=3 rats. (t) Immunohistochemistry of MMP13 in rat knee joints from n. (u) The area of MMP13 expression in t. Data are mean ± SD; *p≤0.05, **p≤0.01; one-way ANOVA followed by Tukey’s post hoc; n=3 rats. (v) Immunohistochemistry of βCATENIN in knee joints from rats in n. (w) The percentage of nuclear βCatenin+ cells from immunostaining in v. Data are mean percent ± SD; *p≤0.05, **p≤0.01; one-way ANOVA followed by Tukey’s post hoc; n=3 rats.
Figure 7.
Figure 7.. StemJEL ameliorates post-traumatic osteoarthritis and restores chondrocyte identity in pre-clinical mini-pig jaw joints.
(a) Schematic of mini-pig jaw joint injury model. (b) MRI of superior view of mini-pig condyles (top). Cross section of MRI (bottom). (c) Normalized equilibrium contact modulus in injured mini-pig condyles normalized to uninjured site within the same condyle. Data are normalized mean ± SD; *p≤0.05, ***p≤0.001; one-way ANOVA followed by Tukey’s post hoc; n=6-8 mini-pigs. (d-h) qRT-PCR using mini-pig mandibular condyles from a. Data are mean normalized to GAPDH ± SD; *p≤0.05, **p≤0.01; ***p≤0.001; ****p≤0.0001; one-way ANOVA followed by Tukey’s post hoc; n=3-4 mini-pigs. (i) H&E staining of mini-pigs from a. (j) OARSI macroscopic score of mini-pig condyles from a. Data are mean score ± SD; *p≤0.05, **p≤0.01; ***p≤0.001; ****p≤0.0001; one-way ANOVA followed by Tukey’s post hoc; n=3 mini-pigs. (k) Immunohistochemistry of osteocalcin (OCN, green) and type II collagen (COL2A1, red) in mini-pig condyles from a. (I) Area of OCN immunostaining in k. Data are mean area ± SD; *p≤0.05, **p≤0.01; ***p≤0.001; ****p≤0.0001; one-way ANOVA followed by Tukey’s post hoc; n=3 mini-pigs. (m) Immunohistochemistry of RUNX2 (green) and type II collagen (COL2A1, red) in mini-pig condyles from a. (n). The percentage of RUNX2+/COL2A1+ cells from immunostaining in m. Data are mean percent ± SD; **p≤0.01; ***p≤0.001; one-way ANOVA followed by Tukey’s post hoc; n=3 mini-pigs. (o) Immunohistochemistry of βCATENIN from mini-pigs in a. (p) The percentage of βCatenin+ cells from o. Data are mean ± SD; **p≤0.01; one-way ANOVA followed by Tukey’s post hoc; n=3 mini-pigs.

References

    1. Berenbaum F, Wallace IJ, Lieberman DE, and Felson DT (2018). Modern-day environmental factors in the pathogenesis of osteoarthritis. Nat Rev Rheumatol 14, 674–681. 10.1038/s41584-018-0073-x. - DOI - PubMed
    1. Hunter DJ, and Bierma-Zeinstra S (2019). Osteoarthritis. Lancet 393, 1745–1759. 10.1016/S0140-6736(19)30417-9. - DOI - PubMed
    1. Latourte A, Kloppenburg M, and Richette P (2020). Emerging pharmaceutical therapies for osteoarthritis. Nat Rev Rheumatol 16, 673–688. 10.1038/s41584-020-00518-6. - DOI - PubMed
    1. Huey DJ, Hu JC, and Athanasiou KA (2012). Unlike bone, cartilage regeneration remains elusive. Science 338, 917–921. 10.1126/science.1222454. - DOI - PMC - PubMed
    1. Mobasheri A, Rayman MP, Gualillo O, Sellam J, van der Kraan P, and Fearon U (2017). The role of metabolism in the pathogenesis of osteoarthritis. Nat Rev Rheumatol 13, 302–311. 10.1038/nrrheum.2017.50. - DOI - PubMed

Publication types

Substances