. 2023 Oct 26;186(22):4803-4817.e13.
doi: 10.1016/j.cell.2023.08.017. Epub 2023 Sep 7.

Genetic manipulation of Patescibacteria provides mechanistic insights into microbial dark matter and the epibiotic lifestyle

Affiliations

Genetic manipulation of Patescibacteria provides mechanistic insights into microbial dark matter and the epibiotic lifestyle

Yaxi Wang et al. Cell. .

Abstract

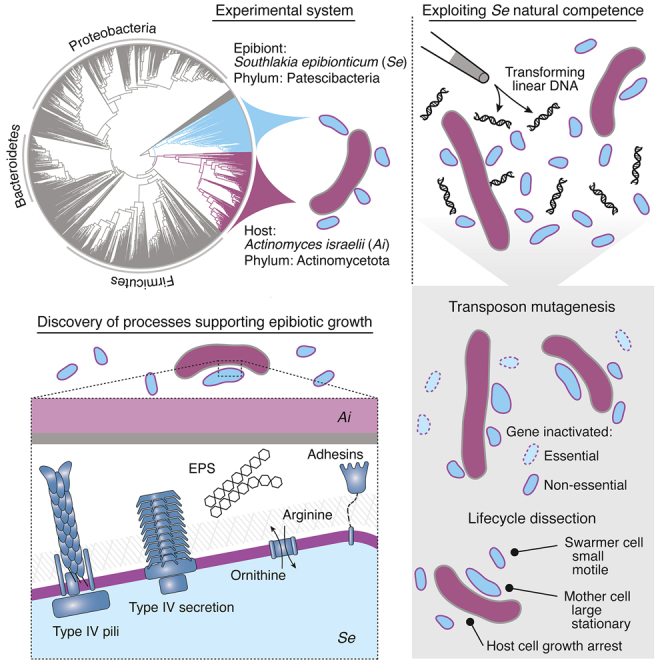
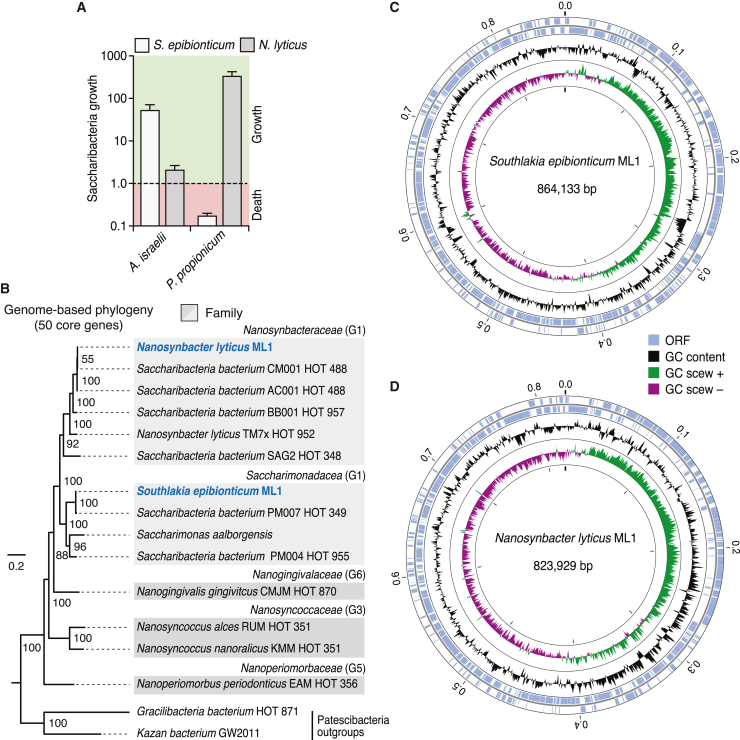
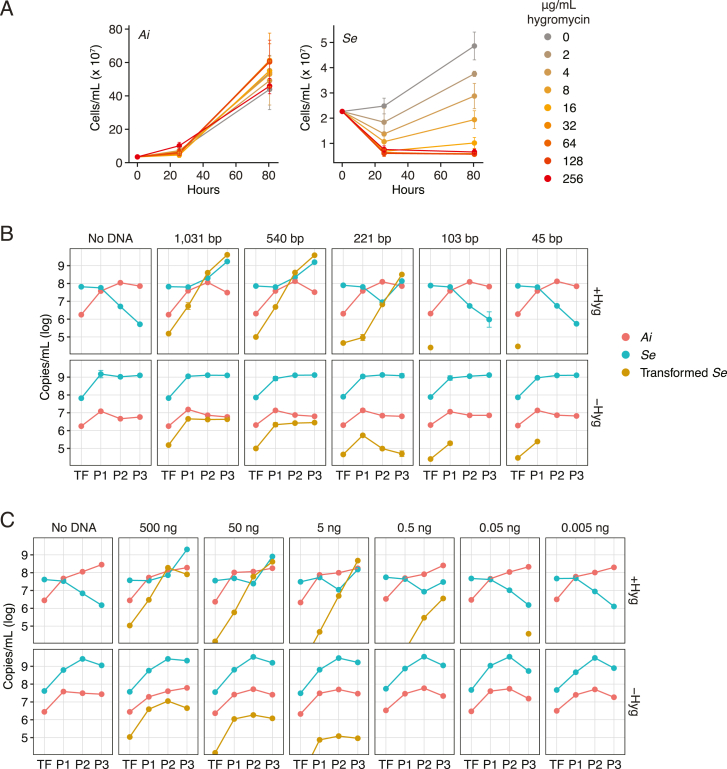
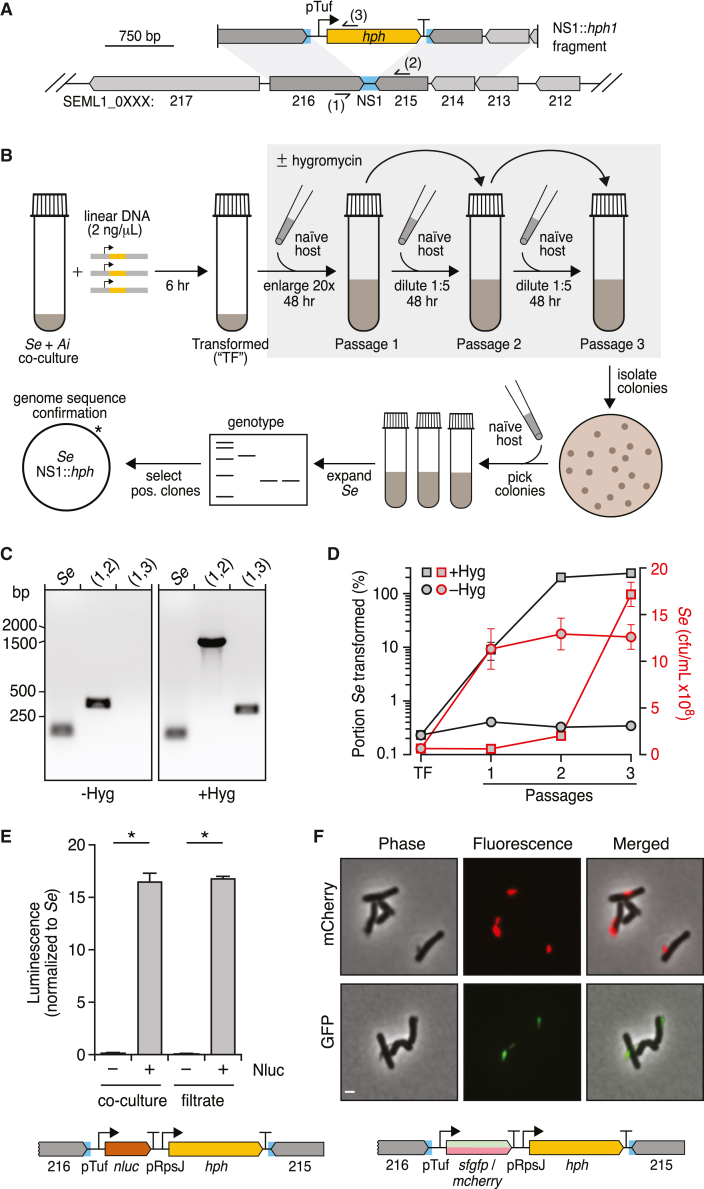
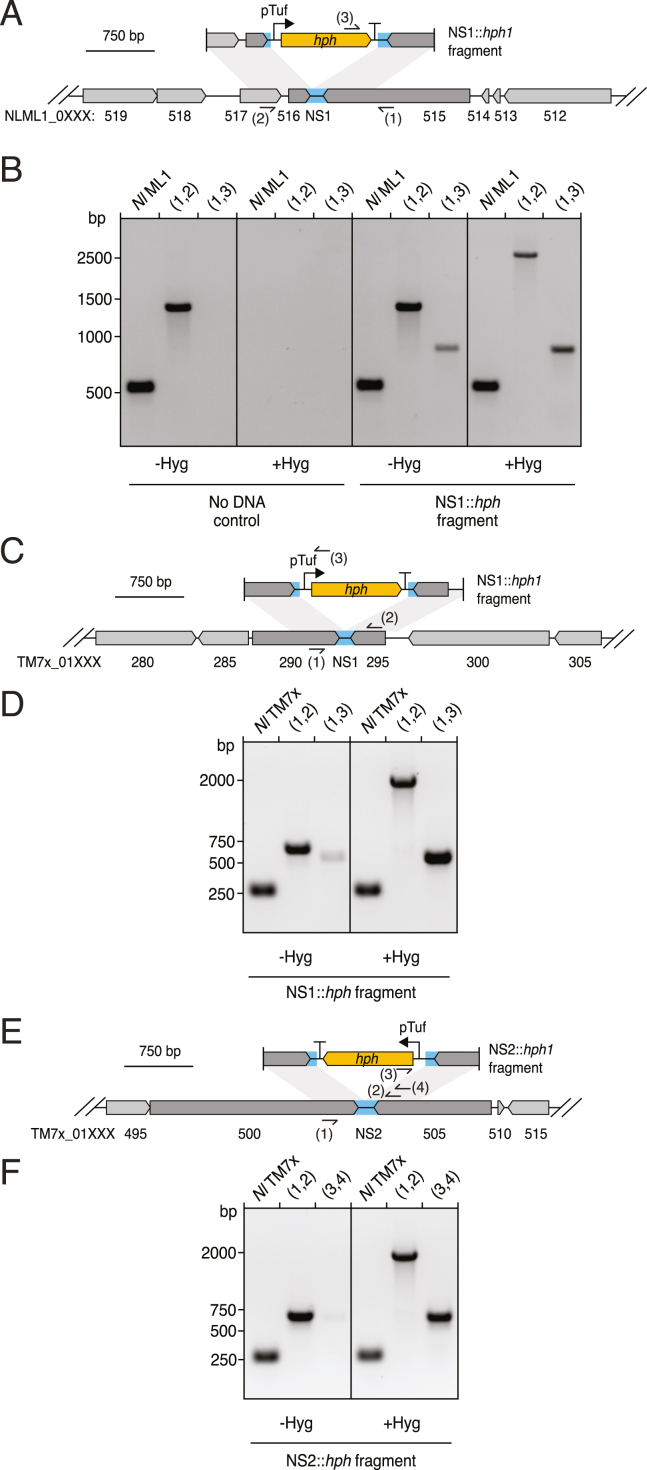
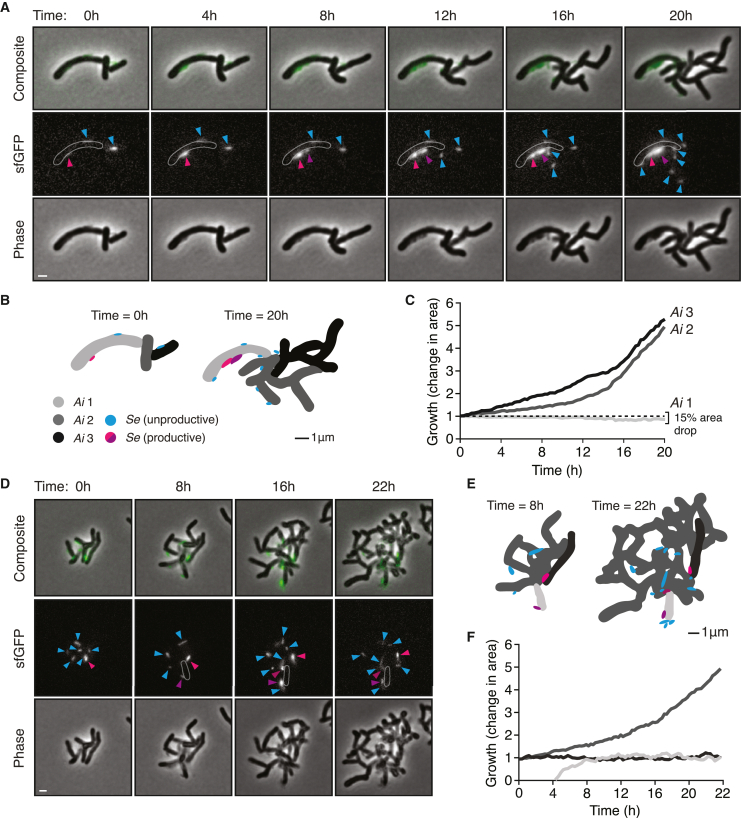
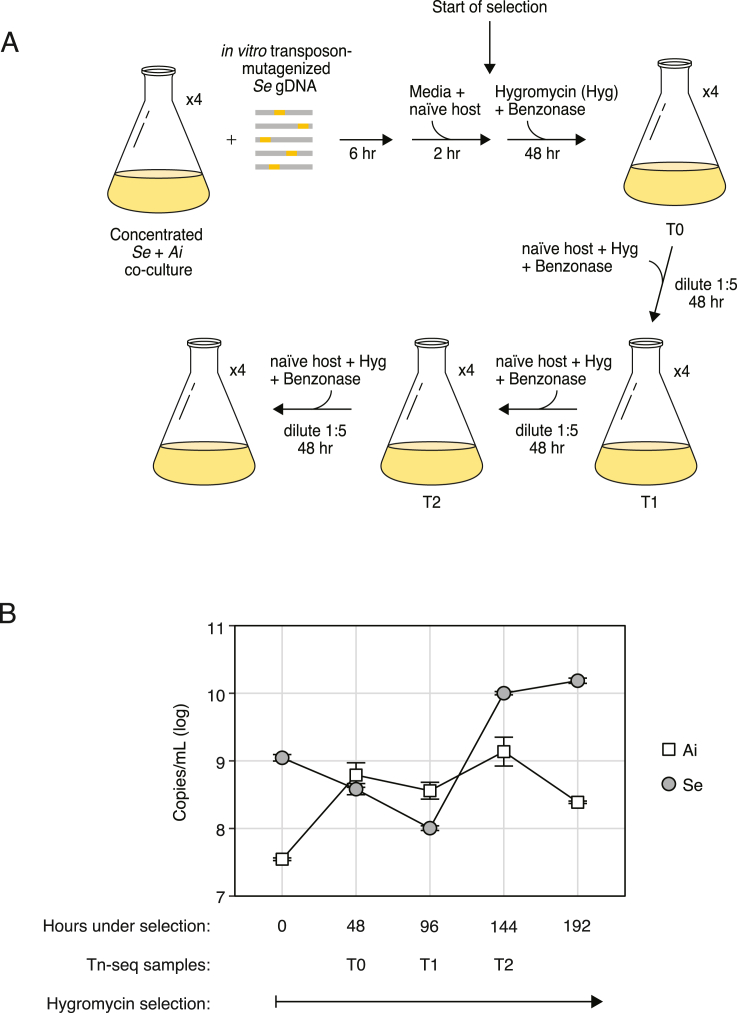
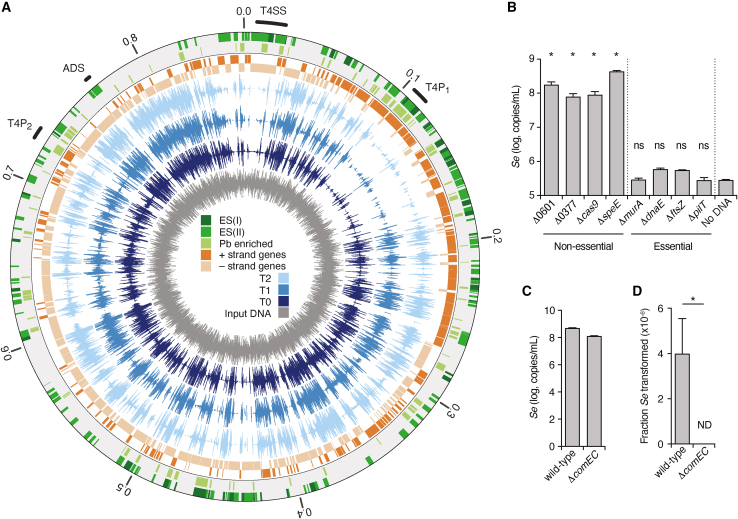
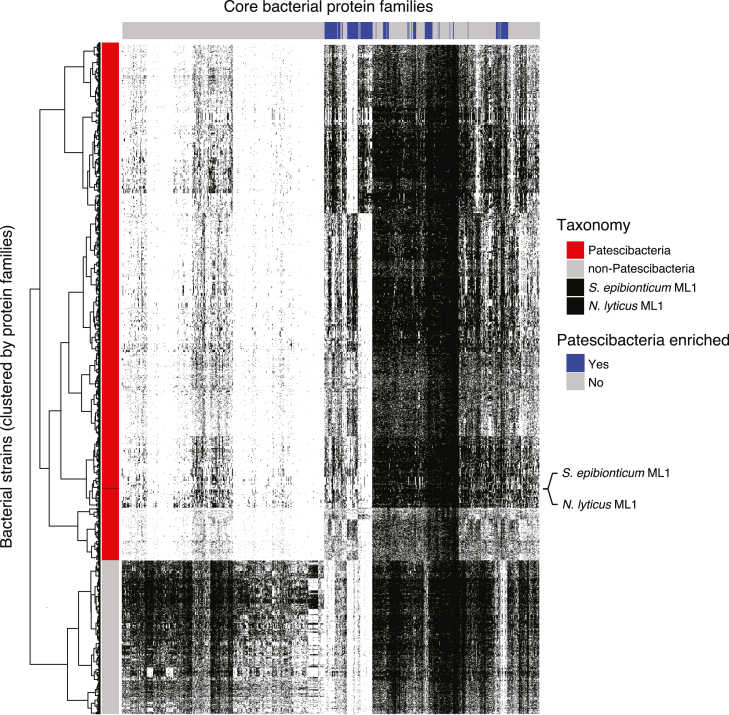
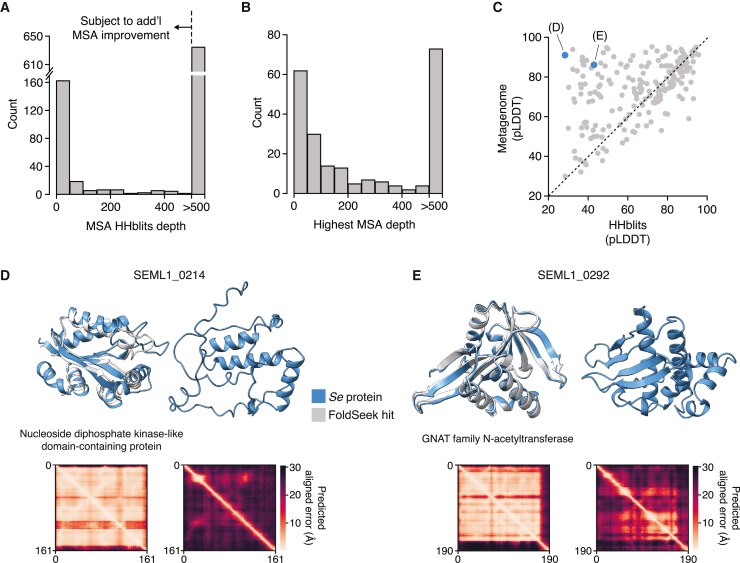
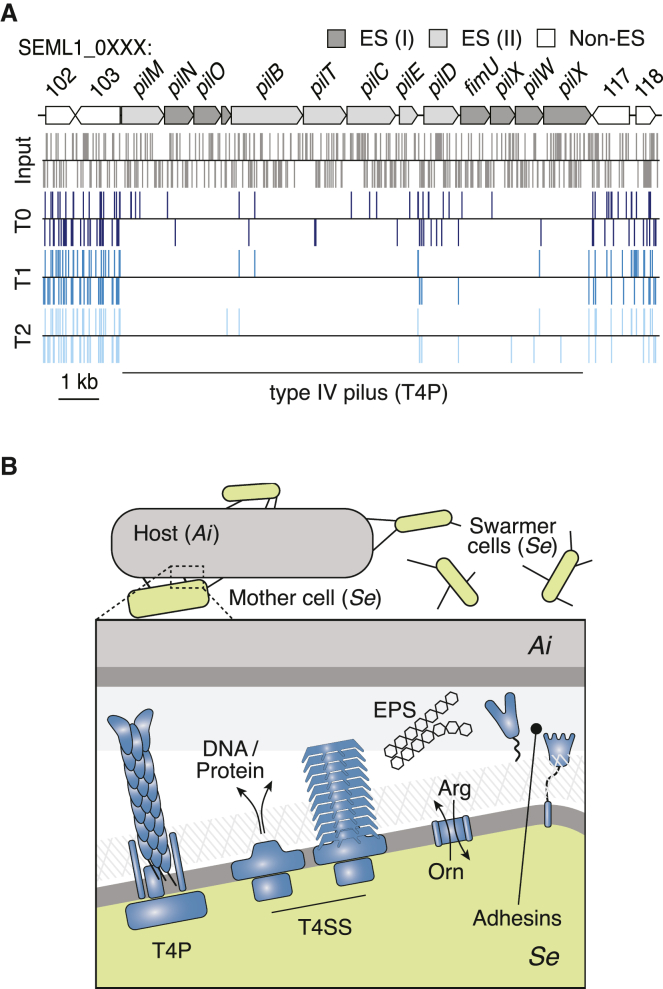
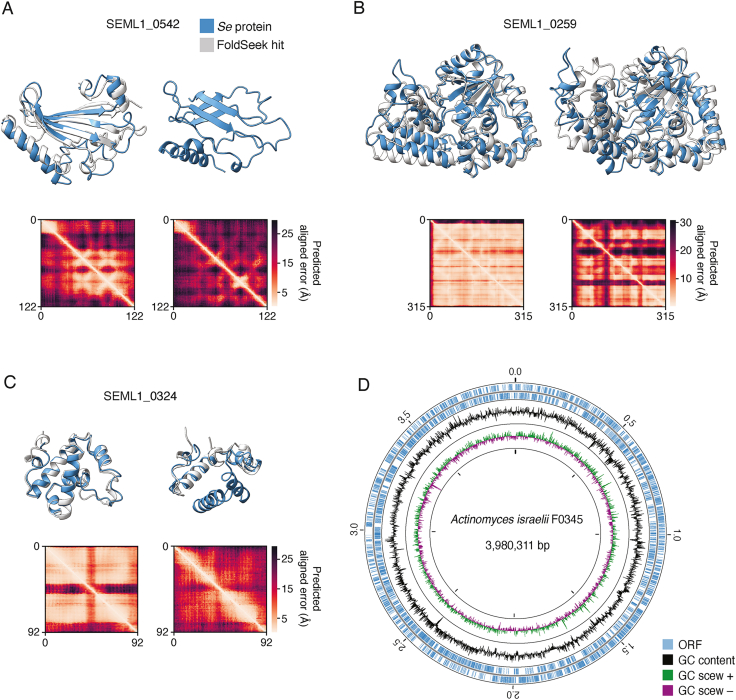
Patescibacteria, also known as the candidate phyla radiation (CPR), are a diverse group of bacteria that constitute a disproportionately large fraction of microbial dark matter. Its few cultivated members, belonging mostly to Saccharibacteria, grow as epibionts on host Actinobacteria. Due to a lack of suitable tools, the genetic basis of this lifestyle and other unique features of Patescibacteira remain unexplored. Here, we show that Saccharibacteria exhibit natural competence, and we exploit this property for their genetic manipulation. Imaging of fluorescent protein-labeled Saccharibacteria provides high spatiotemporal resolution of phenomena accompanying epibiotic growth, and a transposon-insertion sequencing (Tn-seq) genome-wide screen reveals the contribution of enigmatic Saccharibacterial genes to growth on their hosts. Finally, we leverage metagenomic data to provide cutting-edge protein structure-based bioinformatic resources that support the strain Southlakia epibionticum and its corresponding host, Actinomyces israelii, as a model system for unlocking the molecular underpinnings of the epibiotic lifestyle.


Conflict of interest statement

Declaration of interests The authors declare no competing interests.

Figures

None
Graphical abstract
Figure 1
Figure 1
Phylogenetic placement and genome sequencing of newly isolated Saccharibacteria strains S. epibionticum ML1 (Se) and N. lyticus ML1 (Nl) (A) Maximum growth (fold change) achieved by Se and Nl during co-culture with compatible host species A. israelii and Propionibacterium propionicum, respectively, and population change (growth or death) detected at equivalent time points with an incompatible host. (B) Phylogeny constructed using 50 core, universal proteins (6,042 total amino acid positions) indicating placement of Se and Nl (blue text) within Saccharibacteria. Family names (as designated by the Genome Taxonomy Database) and groups previously designated by McLean et al. (G1, etc.) are indicated for each clade. HOT, human oral taxon. (C and D) Overview of the genome sequences of S. epibionticum ML1 and N. lyticus ML1. Data in (A) represent mean ± SD. See also Data S1–S3.
Figure S1
Figure S1
Development and optimization of the Se transformation protocol, related to Figure 2 (A) Growth of Ai (left) and Se (right) in co-cultures containing the indicated concentrations of hygromycin. Data represent mean ± SD. (B and C) Quantification of Se, Ai, and transformed Se populations over the course of our transformation protocol (see Figure 2B) with varying lengths (B) or concentrations (C) of transforming DNA. Transformations were performed in the presence (top panels) and absence (bottom panels) of selection for transformants with hygromycin.
Figure 2
Figure 2
Harnessing natural transformation to generate mutant Saccharibacteria (A) Schematic depicting the intergenic neutral site (blue, NS1) targeted for insertion of a hygomycin resistance cassette (yellow) in the Se genome and the linear DNA fragment employed in transformation experiments. Primer binding sites used for genotyping are indicated (sites 1–3). (B) Overview of the Se transformation protocol. After incubation with linear DNA, Se + Ai co-cultures are enlarged concomitant with hygromycin addition and serially passage with addition of naive host at each dilution to promote Se growth (gray box). Clonal transformed Se populations were obtained by plating to isolate single colonies of Ai with accompanying Se cells, followed by growth in liquid culture, with additional Ai, to promote Se population expansion. The asterisk indicates the single insertion detected by genome sequencing. (C) PCR-based genotyping of Se clones obtained following transformation according to the protocol shown in (B) in the presence (right) or absence (left) of selection with hygromycin during the expansion and passaging steps. Binding sites for primers targeting NS1 (1, 2) and hph (3) are shown in (A). Positive control primers (Se) target a locus distant from NS1. (D) Se growth (red) and percent of Se transformed (black) over the course of transformation protocol depicted in (B), in the presence (squares) or absence (circles) of selection with hygromycin. (E) Luminescence production from Se-Ai co-cultures (left) or co-culture filtrates (right) in which Se contains a nanoluciferase expression cassette inserted at NS1 (shown at bottom). (F) Fluorescence and phase contrast micrographs of Se-Ai co-cultures in which Se carries an mCherry (top) or sfgfp (bottom) expression cassette inserted at NS1. Scale bar, 1 μm. Data in (D) and (E) represent mean ± SD. Asterisks indicate statistically significant differences (unpaired two-tailed Student’s t test; p < 0.05). See also Figures S1 and S2.
Figure S2
Figure S2
Transformation of two strains of Nanosynbacter lyticus, related to Figure 2 (A, C, and E) Schematics depicting the intergenic neutral sites (blue, NS1 and NS2) targeted for insertion of a hygomycin resistance cassette (yellow) in the N. lyticus ML1 (Nl ML1) (A) or N. lyticus TM7x (Nl TM7x) (C and E) genomes and the linear DNA fragment employed in transformation experiments with these strains. Primer binding sites used for genotyping are indicated (sites 1–3). (B) Genotyping of Nl ML1-P. propionicum co-cultures transformed with the linear DNA fragment depicted in (A) (right) or parallel negative control co-cultures with no DNA added (left) at the end of passage 4 (see STAR Methods) with primers targeting NS1 (1,2) or hph (3). Positive control Nl ML1 primers target a genomic locus distant from NS1. (D and F) Genotyping of Nl TM7x-Schaalia odontolytica co-cultures transformed with the linear DNA fragment depicting in (C) or (E), respectively, at the end of passage 4. Cultures were grown in the presence (right) or absence (left) of continuous selection with hygromycin. Primers targeted NS1 (D) or NS2 (F) (1,2) or hph (3). Positive control Nl TM7x primers target a genomic locus distant from NS1 and NS2.
Figure 3
Figure 3
Fluorescent protein expression and quantitative microscopy enable tracking of the S. epibionticum lifecycle (A and D) Snapshots captured at the indicated time points from time-lapse fluorescence and phase contrast microscopy of GFP-expressing Se grown in co-culture with Ai. Arrows indicate example Se cells exhibiting productive (pink, purple) and non-productive (blue) interactions with Ai cells. White outlines in the fluorescent channel depict an Ai cell affected by Se infection (Ai 1). Scale bar, 1 μm. (B and E) Omnipose-generated segmentation of Se and Ai cells depicted in (A) and (D), at the start (left) and end (right) of the 20- or 22-h growth period. (C and F) Growth of individual Ai cells as impacted by productive (light gray) or non-productive Se cells (black, dark gray). Colors correspond to cell masks shown in (B) and (E). Time-lapse fluorescence microscopy videos from which (A) and (D) derive, as well as additional raw and annotated videos of Se-Ai co-cultures, are open for access via https://mougouslab.org/data.
Figure S3
Figure S3
Population dynamics of Se and Ai during transposon mutagenesis, related to Figure 4 (A) Schematic depicting the protocol employed for transposon mutagenesis of Se. (B) Quantitative PCR-based measurements of Se and Ai levels during the course of the transposon mutagenesis experiment. Data in (B) represent mean ± SD.
Figure 4
Figure 4
Identification of genes important for fitness of S. epibionticum during co-culture with Ai identified by Tn-seq (A) Overview of normalized transposon-insertion frequency across the Se genome detected in input DNA used for mutagenesis (dark gray), and from samples collected 48 h after the onset of selection (T0, dark blue) and subsequent outgrowth time points (T1-T2, shades of blue). Genes encoding proteins belonging to Patescibacteria-enriched protein families (Pb enriched) and class I and II essential genes (ES I and II) are indicated in the outer circles (shades of green). The locations of the essential arginine deiminase system (ADS) genes, T4SS genes, and two loci containing T4P genes (T4P1 and T4P2) are indicated outside of the circle. (B) Se population levels detected in Se-Ai co-cultures following transformation with constructs designed to replace the indicated genes with hph. (C and D) Total Se population (C) and proportion transformed (D) following transformation with an unmarked cassette targeted to NS1 in the indicated strains of Se. See also Figures S4 and S5 and Table S1. Data in (B)–(D) represent mean ± SD. Asterisks indicate statistically significant differences (B, one-way ANOVA followed by Dunnett’s compared to no DNA control; D, unpaired two-tailed Student’s t test; p < 0.05, ns, not significant). See also Figures S3 and S4 and Table S1.
Figure S4
Figure S4
Distribution of 921 core protein families across Patescibacteria and other bacterial genomes, including Se and N. lyticus ML1, related to Figure 4 Columns represent core families (derived from Meheust et al.9) and rows represent individual genomes from the indicated bacterial groups. Patescibacteria-enriched protein families indicated at top (blue), and dendrogram at left represents clustering of bacterial strains based on protein family content.
Figure 5
Figure 5
Inclusion of extensive metagenomic data in MSAs enables proteome-wide AF modeling of S. epibionticum protein structures (A) Histograms depicting MSA depths obtained for Se proteins using HHblits. (B) Maximum depths obtained for Se protein MSAs that initially contained <500 sequences. Additional sequences were sourced from metagenomic sequence databases and incorporated into MSAs using Jackhmmer or Phmmer (see STAR Methods). (C) Comparison of the AF confidence metric (pLDDT) determined using Hhblits or Jackhmmer/Phmmer (metagenome)-generated MSAs for Se proteins with initially shallow MSAs (<500). Se proteins shown in (D) and (E) are highlighted in blue. (D and E) Example Se protein structure models and associated predicted alignment matrices obtained using shallow (right) or metagenomic sequence-improved (left) MSAs. Se protein models (blue) are aligned to models from top Foldseek (FS) hits (light gray, AF database50 numbers A0A1F6S045, D and A0A7W4ES58, E), when available. The annotation in (D) and (E) derives from the best FS hit. Some structures are trimmed to highlight the alignment. See also Figures S5A–S5C and Table S2.
Figure 6
Figure 6
Unusual essential genes of S. epibionticum encode numerous envelope-associated functions predicted to mediate host-cell interaction (A) Schematic of genes encoding the core T4P components (T4P1 locus, top), and locations of transposon insertions detected in input mutagenized DNA (gray) and Tn-seq samples T0-T2 (shades of blue). Gene essentiality is indicated by shading (class I essential genes [ES I], dark gray; class II essential genes [ES II], light gray). (B) Model of the Se/Ai interface during a productive infection, depicting selected envelope-associated functions found to be essential in our Tn-seq screen. These include macromolecular structures predicted to mediate adhesion (T4P) and DNA or protein delivery (T4SS), protein adhesins and the ADS system for arginine catabolism. Mother and swarmer cell designations derive from the analysis shown in Figure 3. See also Figure S5D. EPS, extracellular polysaccharide; Orn, ornithine; Arg, arginine.
Figure S5
Figure S5
Structural models for the Se proteome generated using metagenomic sequence enriched MSAs and the Ai genome, related to Figures 5 and 6 (A–C) Example Se protein structure models and associated predicted alignment matrices obtained using shallow (right) or metagenomic sequence-improved (left) MSAs. Se proteins models (blue) are aligned to models for top FS hits (light gray, AF database50 numbers A0A8B1YQG7, A; A0A660M2Z7, metagenome and R7KEI0, shallow, B; A0A563D6X1, metagenome and A0A563CX08, shallow, C), when available. Some structures are trimmed to highlight the alignment. (D) Overview of the genome sequence of A. israelii F0345.

Update of

References

    1. Hug L.A., Baker B.J., Anantharaman K., Brown C.T., Probst A.J., Castelle C.J., Butterfield C.N., Hernsdorf A.W., Amano Y., Ise K., et al. A new view of the tree of life. Nat. Microbiol. 2016;1 doi: 10.1038/nmicrobiol.2016.48. - DOI - PubMed
    1. Marcy Y., Ouverney C., Bik E.M., Lösekann T., Ivanova N., Martin H.G., Szeto E., Platt D., Hugenholtz P., Relman D.A., Quake S.R. Dissecting biological "dark matter" with single-cell genetic analysis of rare and uncultivated TM7 microbes from the human mouth. Proc. Natl. Acad. Sci. USA. 2007;104:11889–11894. doi: 10.1073/pnas.0704662104. - DOI - PMC - PubMed
    1. Katz M., Hover B.M., Brady S.F. Culture-independent discovery of natural products from soil metagenomes. J. Ind. Microbiol. Biotechnol. 2016;43:129–141. doi: 10.1007/s10295-015-1706-6. - DOI - PubMed
    1. Rinke C., Schwientek P., Sczyrba A., Ivanova N.N., Anderson I.J., Cheng J.F., Darling A., Malfatti S., Swan B.K., Gies E.A., et al. Insights into the phylogeny and coding potential of microbial dark matter. Nature. 2013;499:431–437. doi: 10.1038/nature12352. - DOI - PubMed
    1. Coleman G.A., Davín A.A., Mahendrarajah T.A., Szánthó L.L., Spang A., Hugenholtz P., Szöllősi G.J., Williams T.A. A rooted phylogeny resolves early bacterial evolution. Science. 2021;372 doi: 10.1126/science.abe0511. - DOI - PubMed

Publication types

LinkOut - more resources