. 2023 Oct 9;41(10):1817-1828.e9.
doi: 10.1016/j.ccell.2023.08.008. Epub 2023 Sep 7.

CMTM6 shapes antitumor T cell response through modulating protein expression of CD58 and PD-L1

Affiliations

CMTM6 shapes antitumor T cell response through modulating protein expression of CD58 and PD-L1

Beiping Miao et al. Cancer Cell. .

Abstract

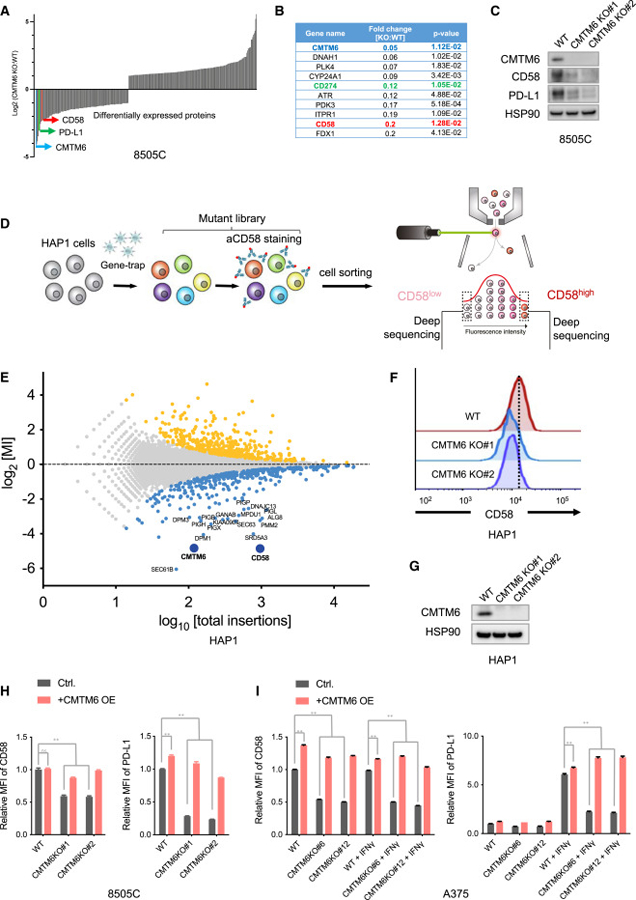
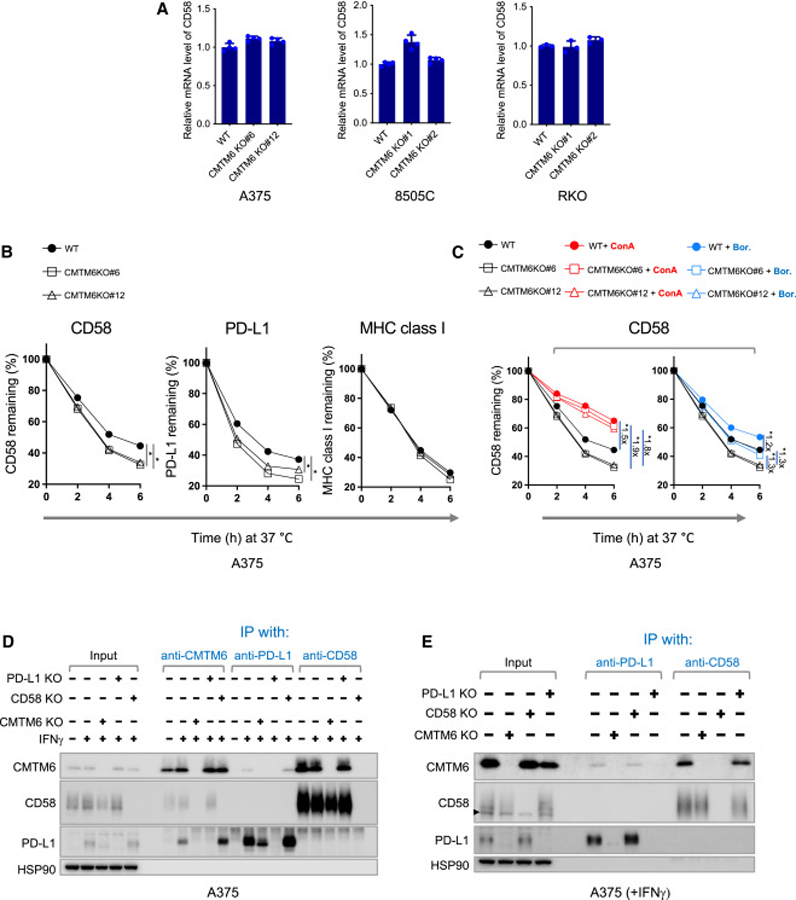
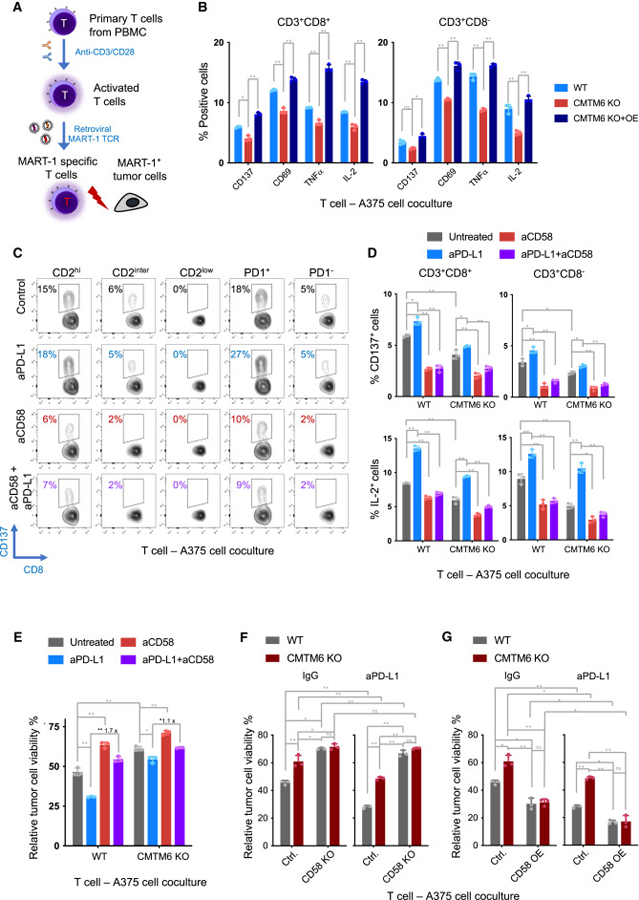
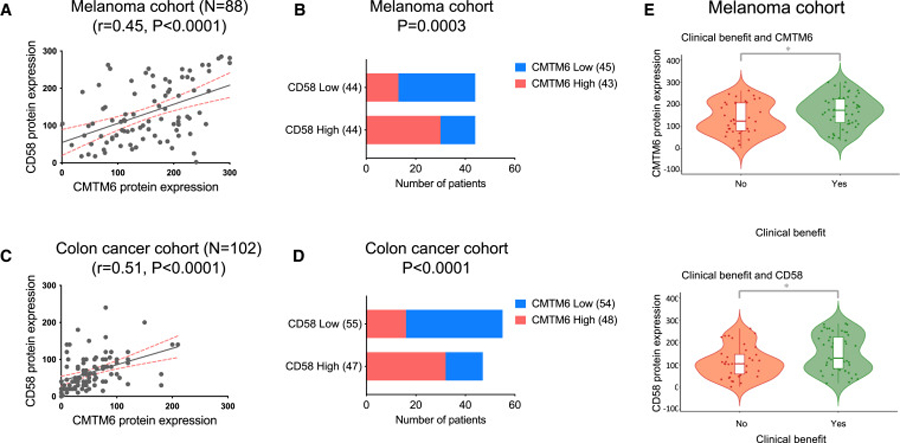
The dysregulated expression of immune checkpoint molecules enables cancer cells to evade immune destruction. While blockade of inhibitory immune checkpoints like PD-L1 forms the basis of current cancer immunotherapies, a deficiency in costimulatory signals can render these therapies futile. CD58, a costimulatory ligand, plays a crucial role in antitumor immune responses, but the mechanisms controlling its expression remain unclear. Using two systematic approaches, we reveal that CMTM6 positively regulates CD58 expression. Notably, CMTM6 interacts with both CD58 and PD-L1, maintaining the expression of these two immune checkpoint ligands with opposing functions. Functionally, the presence of CMTM6 and CD58 on tumor cells significantly affects T cell-tumor interactions and response to PD-L1-PD-1 blockade. Collectively, these findings provide fundamental insights into CD58 regulation, uncover a shared regulator of stimulatory and inhibitory immune checkpoints, and highlight the importance of tumor-intrinsic CMTM6 and CD58 expression in antitumor immune responses.


Conflict of interest statement

Declaration of interests R.M., T.R.B., T.N.M.S., and C.S. are listed as inventors on a patent application that covers the therapeutic and diagnostic use of CMTM6, CMTM4, and STUB1 as targets. C.S. has received research support from Bayer AG unrelated to the current study. T.N.M.S. serves as an advisor for Allogene Therapeutics, Celsius, Merus, Neogene Therapeutics, and Scenic Biotech, and is a stockholder in Allogene Therapeutics, Cell Control, Celsius, Merus, and Scenic Biotech. T.N.M.S. is also a venture partner at Third Rock Ventures, all outside the submitted work. T.R.B. is a cofounder and SAB member of Haplogen GmbH and cofounder and managing director of Scenic Biotech, all outside the submitted work. C.U.B. has received research grants from Novartis, BMS, and NanoString, is a paid advisory board member for BMS, MSD, Roche, Novartis, GlaxoSmithKline, AstraZeneca, Pfizer, Lilly, GenMab, and Pierre Fabre and holds ownership interest in Uniti Card, Neon Therapeutics, and Forty Seven, all outside this submitted work. S.W.L. is a founder and member of the scientific advisory board of Blueprint Medicines, Mirimus, ORIC Pharmaceuticals, and Faeth Therapeutics, and is on the scientific advisory board of Constellation Pharmaceuticals and PMV Pharmaceuticals, all outside the current work. H.M.H. reports consultancy fees from Roche Diagnostics paid to the institute and is an advisor for SlideScore and Ellogon from Roche Diagnostics, outside the submitted work. A.F. is currently employed at Bristol Myers Squibb, and R.G. is currently employed at Neogene Therapeutics; their contributions to this work were made prior to their respective positions and their current roles are not relevant to the content of this manuscript.

Figures

Figure 1.
Figure 1.. Identification of CMTM6 as a positive modulator of CD58
(A) Quantitative proteomics analysis of CMTM6-proficient (WT) and -deficient (KO) 8505C cells. Fold changes of significantly differentially expressed proteins (two-sided Student’s t test, p < 0.05) are depicted. (B) List of top 10 downregulated proteins in CMTM6-deficient 8505C cells. (C) Western blot analysis of CMTM6, CD58, and PD-L1 expression in parental 8505C cells (WT) and independent CMTM6-knockout clonal cells (CMTM6 KO). HSP90 served as a control. (D) Schematic illustration of the flow cytometry-based haploid genetic screen for modulators of CD58 expression. (E) Identification of modulators of CD58 expression by the haploid genetic screen depicted in (D). Each dot represents an individual gene, with the x axis indicating the number of disruptive insertions in each gene, and the y axis showing the fold changes in the frequency of unique insertions in the CD58high population compared to the CD58low population. Genes with a significant enrichment of insertions (two-sided Fisher’s exact test, FDR-corrected p < 0.05) in either the CD58high or CD58low populations are represented by light orange and blue dots, respectively. (F and G) CD58 expression levels in parental HAP1 cells (WT) and independent CMTM6-knockout clonal cells (CMTM6 KO). Levels of CD58 expression were determined by flow cytometry (F) and CMTM6 expression was analyzed by Western blot (G). HSP90 served as a control in the Western blot analysis. (H and I) Flow cytometry analysis of CD58 and PD-L1 expression in wild-type (WT), CMTM6-knockout (CMTM6 KO), CMTM6-overexpressing (WT + CMTM6 OE), and CMTM6-reconstituted (CMTM6 KO + CMTM6 OE) 8505C (H) and A375 cells with or without IFNγ exposure (I). Data represent the mean ± standard deviation of triplicates and were analyzed using a two-way ANOVA test (with Tukey’s multiple comparisons test). A p value greater than 0.05 indicates non-significance (ns), while a p value less than 0.0001 is denoted as **.
Figure 2.
Figure 2.. CMTM6 promotes stability of cell surface CD58 and interacts with CD58
(A) qPCR analysis of mRNA levels of CD58 in CMTM6-deficient and -proficient A375, 8505C, and RKO cells. (B) Stability of cell surface-expressed CD58, PD-L1, and MHC class I in parental (WT) and CMTM6-deficient (CMTM6 KO#6, CMTM6 KO#12) A375 cells. A375 cells were treated with IFNγ for 24 h and then individually incubated with APC-conjugated antibodies specific for CD58, PD-L1, or MHC class I at 4°C. After removing unbound antibodies, the cells were further incubated at 37°C for the indicated time periods, and the APC signal was measured by flow cytometry. The percentage of signal remaining at the indicated time points relative to time 0 is shown. (C) Stability of cell surface-expressed CD58 in the parental (WT) and CMTM6-deficient (CMTM6 KO#6, CMTM6 KO#12) A375 cells in the presence of the proteasome inhibitor bortezomib (Bor.) or the lysosome inhibitor concanamycin A (ConA). The untreated samples presented in (B) served as the control. Data acquisition and presentation were performed as described in (B). (D) Western blot analysis of cell lysates and indicated immunoprecipitates from A375 cells. HSP90 served as a control. (E) Western blot analysis of cell lysates and indicated immunoprecipitates by cell surface immunoprecipitation from A375 cells. For the cell surface immunoprecipitation, live cells were incubated with antibodies that recognize the extracellular domains of CD58 or PD-L1. After removal of unbound antibodies, the cells were lysed for (co)immunoprecipitation. HSP90 served as a control. The triangles indicate the position of background bands, which are present when the anti-CD58 antibody (R&D Cat# AF1689) was used for detection, whereas the anti-CD58 antibody (BioLegend, Cat# 330924) does not produce such background signal. Data represent mean ± standard deviation of at least triplicates (A–C) and were analyzed using unpaired Student’s t test. Statistical significance is indicated by *p < 0.05.
Figure 3.
Figure 3.. Influence of CMTM6, CD58, and PD-L1 on antigen-specific T cell-tumor cell interactions
(A) Schematic illustration of the antigen-specific T cell-tumor cell coculture system. Primary T cells were isolated from human PBMCs, activated, and transduced with a MART-1-specific TCR. HLA-A2-positive tumor cells were loaded with MART-1 peptide and incubated with the TCR-transduced T cells. (B) Effect of CMTM6 loss on T cell activation. MART-1 TCR-transduced T cells were cocultured with MART-1 peptide-loaded CMTM6 wild-type (WT), CMTM6-knockout (CMTM6 KO), or CMTM6-reconstituted (CMTM6 KO + OE) A375 cells. After 24 h, expression of indicated T cell activation markers and cytokines in CD8+ and CD8 T cells was determined by flow cytometry. To allow detection of TNFα and IL-2, brefeldin A was added 4 h before T cell harvesting. (C–E) Effect of PD-L1 blockade, CD58 blockade, and CMTM6 deletion on T cell activation and tumor cell viability. MART-1 TCR-transduced T cells were co-cultured with MART-1 peptide-loaded tumor cells in the presence of PD-L1-blocking antibody (atezolizumab, aPD-L1), CD58-blocking antibody (aCD58), or their combination. The coculture without antibody treatment (untreated) served as control. After 18–60 h of coculture, T cell activation and tumor cell viability were analyzed. (C) Flow cytometric analysis of T cells that were cocultured for 18 h with A375 cells in the absence or presence of the indicated blocking antibodies. Expression of CD137 was analyzed within CD3+CD8+ cell populations stratified by CD2 expression (CD2high: top 33%, CD2inter: middle 33%, CD2low: bottom 33%), as well as PD-1 expression (PD-1+ or PD-1). Representative contour plots are presented. (D) Flow cytometric analysis of T cells that were cocultured with CMTM6 wild-type and -knockout A375 cells for 24 h. Percentages of CD137+, and IL-2+ cells within the CD8+CD3+ and CD8 CD3+ cell populations are depicted. (E) Viability of CMTM6 wild-type and -knockout A375 cells after coculture with T cells for 60 h was determined by CellTiter-Blue Cell Viability Assay. The data presented depict relative tumor cell viability (relative to tumor cells that were cultured in the absence of T cells). (F and G) Viability of A375 cells, genetically modified as indicated, was assessed using the CellTiter-Blue Cell Viability Assay after 60 h of coculture with T cells. A375 cells with wild-type CMTM6 (Ctrl.) or CMTM6 knockout (CMTM6 KO), with or without additional CD58 knockout (CD58 KO) (F), or CD58 overexpression (CD58 OE) (G), were examined separately. Cells were either treated with a PD-L1-blocking antibody or a control IgG antibody, as specified. The data presented depict tumor cell viability relative to tumor cells that were cultured in the absence of T cells. Data represent mean ± standard deviation of at least triplicates (B) (D–G) and were analyzed using two-way ANOVA (Tukey’s multiple comparisons test). The statistical significance levels are indicated as follows: ns (not significant; p ≥ 0.05), * (p < 0.05), and ** (p < 0.0001).
Figure 4.
Figure 4.. Correlation between CMTM6 and CD58 expression in tumor cells and their association with response to ICB therapies
(A–D) Tumor biopsies from 88 melanoma and 102 colon cancer patients were analyzed for CMTM6 and CD58 expression levels using immunohistochemistry. (A, C) Spearman correlation analysis was performed to evaluate the correlation between CMTM6 and CD58 expression levels in tumor cells. (B and D) The association between CMTM6 and CD58 expression levels in tumor cells was analyzed using chi-squared tests. The samples were divided into CMTM6-high, CMTM6-low, CD58-high, and CD58-low groups based on the median expression values, and the results were presented as contingency tables. (E) The association between CMTM6 and CD58 expression in tumor cells and the response to ICB therapies in the melanoma cohort. The expression levels of CMTM6 and CD58 were individually plotted against the patient’s response to therapy, classified as clinical benefit (Yes) or no clinical benefit (No). Patients with complete response (CR), partial response (PR), and stable disease (SD) lasting for 6 months or more were classified as having clinical benefit (Yes, n = 49), while patients with progressive disease or with an SD for less than 6 months were categorized as having no clinical benefit (No, n = 39). Comparisons were made between patients that showed clinical benefit (Yes) and those that showed no clinical benefit (No) using the Wilcoxon rank-sum test. Statistical significance is indicated by *p < 0.05.

References

    1. Chen DS, and Mellman I (2013). Oncology meets immunology: the cancer-immunity cycle. Immunity 39, 1–10. - PubMed
    1. Sharma P, and Allison JP (2015). Immune checkpoint targeting in cancer therapy: toward combination strategies with curative potential. Cell 161, 205–214. - PMC - PubMed
    1. Pardoll DM (2012). The blockade of immune checkpoints in cancer immunotherapy. Nat. Rev. Cancer 12, 252–264. - PMC - PubMed
    1. Robert C (2020). A decade of immune-checkpoint inhibitors in cancer therapy. Nat. Commun 11, 3801. - PMC - PubMed
    1. Brunet JF, Denizot F, Luciani MF, Roux-Dosseto M, Suzan M, Mattei MG, and Golstein P (1987). A new member of the immunoglobulin superfamily–CTLA-4. Nature 328, 267–270. - PubMed

Publication types