. 2023 Sep 21;83(18):3303-3313.e6.
doi: 10.1016/j.molcel.2023.08.008. Epub 2023 Sep 7.

eIF3d controls the persistent integrated stress response

Affiliations

eIF3d controls the persistent integrated stress response

Shaoni Mukhopadhyay et al. Mol Cell. .

Abstract

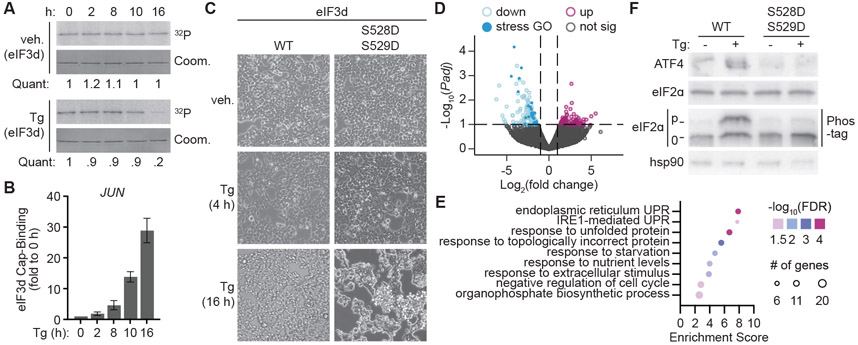
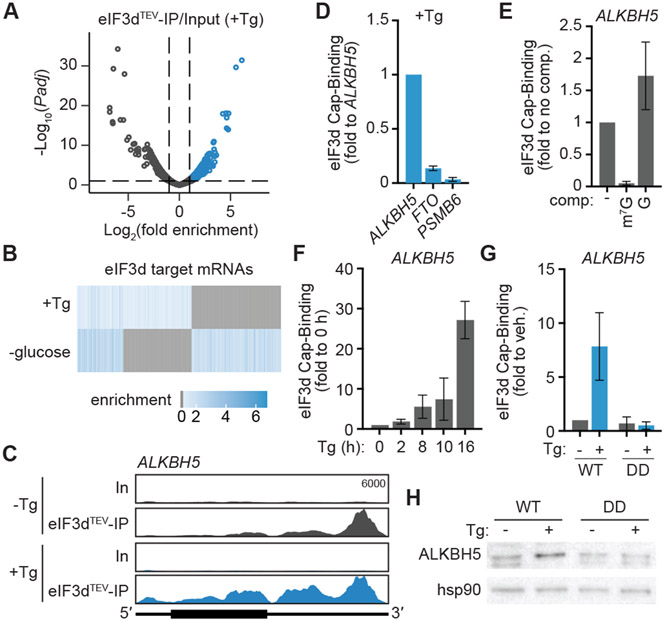
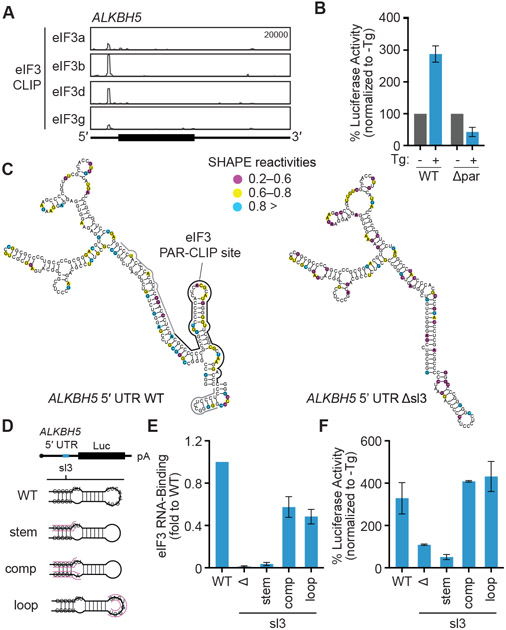
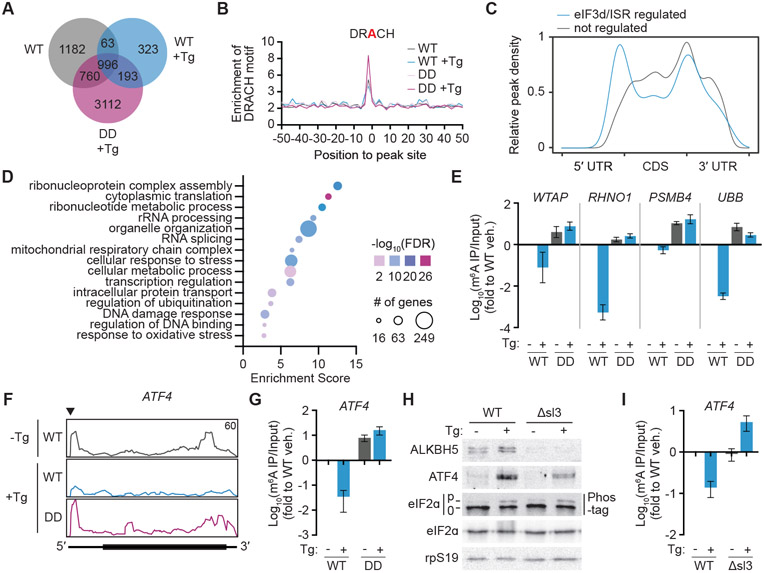
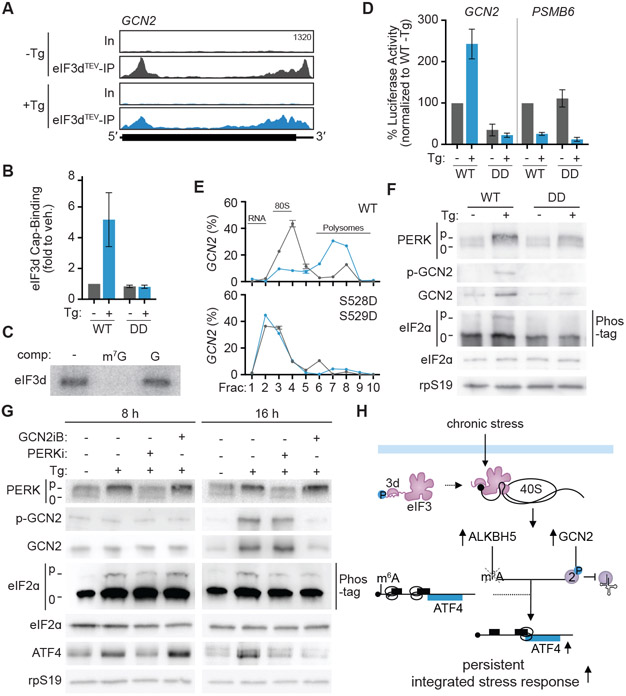
Cells respond to intrinsic and extrinsic stresses by reducing global protein synthesis and activating gene programs necessary for survival. Here, we show that the integrated stress response (ISR) is driven by the non-canonical cap-binding protein eIF3d that acts as a critical effector to control core stress response orchestrators, the translation factor eIF2α and the transcription factor ATF4. We find that during persistent stress, eIF3d activates the translation of the kinase GCN2, inducing eIF2α phosphorylation and inhibiting general protein synthesis. In parallel, eIF3d upregulates the m6A demethylase ALKBH5 to drive 5' UTR-specific demethylation of stress response genes, including ATF4. Ultimately, this cascade converges on ATF4 expression by increasing mRNA engagement of translation machinery and enhancing ribosome bypass of upstream open reading frames (uORFs). Our results reveal that eIF3d acts in a life-or-death decision point during chronic stress and uncover a synergistic signaling mechanism in which translational cascades complement transcriptional amplification to control essential cellular processes.

Keywords: ATF4; GCN2; RNA methylation; eIF3d; integrated stress response; m(6)A; translation regulation.


Conflict of interest statement

Declaration of interests The authors declare no competing interests.

Figures

Figure 1.
Figure 1.. Regulation of eIF3d phosphorylation is critical for the persistent integrated stress response.
(A) Phosphorylation of eIF3 subunits upon integrated stress response (ISR) induction with DMSO control (veh.) or thapsigargin (Tg). Phosphorylation was detected by [32P]-orthophosphate labeling of HEK293T cells, immunoprecipitation of the eIF3 complex, and resolution of subunits by SDS-polyacrylamide gel electrophoresis (PAGE) gel. Coomassie staining of the gel is shown as a loading control (Coom.). Quantification (Quant.) of orthophosphate signal normalized to Coomassie gel lane intensity is represented as fold change to cells at 0 h. (B) eIF3d binding to the 5′ cap of JUN mRNA upon ISR induction. eIF3d cap-binding is quantified as levels of JUN bound to eIF3d in HIV-1 PR-treated eIF3d immunoprecipitation samples compared to total input JUN RNA. Cap-binding is normalized to untreated (0 h) cells and represented as the mean ± s.d. of three independent experiments. (C) Representative images of cell morphology in HEK293T cells edited to express wild-type (WT) or phosphomimetic eIF3d (S528D/S529D) upon treatment with Tg or DMSO control (veh). (D) Volcano plot comparing fold change in transcript expression levels with adjusted P values in cells expressing phosphomimetic versus WT eIF3d upon ISR induction by 16 h treatment with Tg. (E) Gene ontology analysis of mRNAs downregulated in cells expressing phosphomimetic versus WT eIF3d upon ISR induction. (F) Immunoblot of ISR signaling cascade activation in eIF3d WT and phosphomimetic cells. Phos-tag gel allows electrophoretic separation of phosphorylated (p) and unmodified (0) eIF2ɑ protein. Tg treatment in (D – F) was performed for 16 h. The results of (A), (C) and (F) are representative of three independent experiments. See also Figures S1, S2, and Table S1.
Figure 2.
Figure 2.. eIF3d controls ISR-dependent upregulation of the m6A demethylase ALKBH5.
(A) Volcano plot comparing the eIF3dTEV Subunit-IP/Input log2(fold enrichment) versus – log10(adjusted P value) in cells with ISR induced by treatment with thapsigargin. Tg, 16 h thapsigargin treatment. Targets of eIF3d cap-binding activity are colored blue. (B) Heat map of eIF3d target mRNAs in cells with ISR induction versus glucose deprivation. Genes that are not bound by eIF3d in the given condition are colored gray. (C) Read mapping to ALKBH5 from eIF3dTEV Subunit-Seq during ISR induction with thapsigargin. The annotated y-axis maximum is equivalent for all samples. The transcript architecture is represented by the schematics: 5′ and 3′ UTRs (thin line), coding region (thick line). In, input; eIF3dTEV-IP, anti-HA eIF3d immunoprecipitant samples after TEV protease cleavage; Tg, 16 h thapsigargin treatment. (D) eIF3d does not bind to the 5′ cap of FTO mRNA upon ISR induction in HEK293T. Cap-binding is normalized to eIF3d–ALKBH5 cap-binding, as calculated by levels of ALKBH5 enriched by immunoprecipitation of the eIF3d cap-binding domain compared to total input ALKBH5 RNA. PSMB6 is a negative control mRNA that is not bound by eIF3d. (E) Specificity of eIF3d binding to the ALKBH5 5′ cap structure in cells. Results are normalized to samples that are not treated with an on-bead competitor ligand wash. m7G, competitor cap analog m7GpppG; G, unmethylated GpppG. (F) eIF3d binding to the 5′ cap of ALKBH5 mRNA in HEK293T upon ISR induction with thapsigargin (Tg). Cap-binding is normalized to untreated (0 h) cells. (G) eIF3d binding to the 5′ cap of ALKBH5 mRNA upon ISR induction in HEK293T cells expressing wild-type (WT) and phosphomimetic (DD) eIF3d. Cap-binding is normalized to untreated cells. Results in (D–G) are represented as the mean ± s.d. of three independent experiments. (H) Immunoblot of ALKBH5 levels in eIF3d cell lines upon Tg treatment. The results are representative of three independent experiments. See also Figure S3 and Table S2.
Figure 3.
Figure 3.. Stress-dependent translational control of ALKBH5 requires a cis-acting 5′ UTR stem loop.
(A) eIF3 PAR-CLIP cluster in the 5′ UTR of the ALKBH5 mRNA. (B) Luciferase activity in cells transfected with ALKBH5 5′ UTR mutant. Results are normalized to untreated cells. Δpar, deletion of eIF3 PAR-CLIP peak. (C) SHAPE-based secondary structure of the ALKBH5 WT 5′ UTR (nt 79-345) or with the eIF3 binding site (Δsl3) deleted. Nucleotides are color coded by SHAPE reactivity, with higher reactivity correlating with single-stranded probability. The results are representative of two independent experiments. Black line, main eIF3 PAR-CLIP peak; gray line, extended peak. (D) Schematic of ALKBH5 5′ UTR luciferase (Luc) reporter constructs. sl3, eIF3-binding stem loop identified by PAR-CLIP analysis. (E) eIF3 RNA-binding to ALKBH55′ UTR mutants during ISR induction. RNA-binding is normalized to eIF3 binding to WT ALKBH 5′ UTR. Δ, deletion of sl3. (F) Luciferase activity in vitro mediated by ALKBH5 5′ UTR mutants. Results are normalized to WT ALKBH5 5′ UTR luciferase activity in in vitro translation extracts made from untreated HEK293T cells. Results in (B), (E) and (F) are represented as the mean ± s.d. of three independent experiments. See also Figure S4.
Figure 4.
Figure 4.. eIF3d-specialized translational control remodels the m6A epitranscriptome during the persistent ISR.
(A) Venn diagram of overlapping m6A-modified transcripts in wild-type (WT) and phosphomimetic (DD) eIF3d expressing HEK293T. Tg, 16h of thapsigargin treatment. (B) Frequency plot of the canonical m6A DRACH motif in m6A-eCLIP peaks in eIF3d cell lines. (C) Distribution of m6A sites in transcript regions. eIF3d/ISR-regulated m6A sites (gray) are those that exhibit 1.5-fold more methylation in both untreated WT and Tg-treated eIF3d phosphomimetic cell lines when compared to Tg-treated WT eIF3d cells. Blue, sites not regulated by eIF3d/ISR signaling; UTR, untranslated region; CDS, coding sequence. (D) Gene ontology analysis of transcripts with eIF3d/ISR-downregulated m6A sites. (E) Levels of m6A in transcripts identified by m6A-eCLIP, measured by m6A RNA immunoprecipitation (RIP) and quantitative reverse transcription polymerase chain reaction (qRT-PCR). (F) Read mapping to ATF4 from m6A-eCLIP in eIF3d mutant cell lines. The annotated y-axis maximum is equivalent for all samples, and the regulated m6A site as determined by crosslinking-induced truncation sites analysis is annotated by a triangle. (G) Levels of m6A in ATF4 mRNA, measured by m6A-RIP and qRT-PCR. (H) Representative immunoblot showing reduced expression of ALKBH5 and ATF4 upon ISR induction in cells with dysregulated eIF3d-specialized translational control of ALKBH5. Δsl3, cells with the eIF3 binding site in the ALKBH5 5′ UTR deleted (Δsl3). The results are representative of three independent experiments. (I) Levels of m6A in ATF4 mRNA in cells with dysregulated eIF3d-specialized translational control of ALKBH5. Results in (E), (G) and (I) are normalized to untreated WT cells and represent the mean ± s.d. of three independent experiments. See also Figure S5 and Table S3.
Figure 5.
Figure 5.. eIF3d regulates GCN2 kinase during the persistent integrated stress response.
(A) Read mapping to GCN2 from eIF3dTEV Subunit-Seq during ISR induction with thapsigargin. Tg, 16 h treatment with thapsigargin; In, input; eIF3dTEV-IP, anti-HA eIF3d immunoprecipitant samples after TEV protease cleavage. (B) eIF3d binding to the 5′ cap of GCN2 mRNA during chronic ER stress in HEK293T cells expressing wild-type (WT) and phosphomimetic (DD) eIF3d. Cap-binding is normalized to untreated cells. (C) Specificity of in vitro eIF3d crosslinking to the 5′ cap structure of the GCN2 5′ UTR. Binding is specific to the methylated cap structure of addition of cap analog competes away eIF3d binding. m7G, competitor cap analog m7GpppG; G, unmethylated GpppG. (D) Luciferase activity in vitro mediated by the GCN2 5′ UTR is eIF3d/ISR-responsive. PSMB6 is a control transcript not targeted by eIF3. Results are normalized to luciferase activity from in vitro translation extracts made from WT eIF3d-expressing HEK293T cells. Results in (B) and (D) are represented as the mean ± s.d. of three independent experiments. (E) Association of GCN2 mRNA with translating ribosomes in eIF3d cell lines. GCN2 abundance is expressed as a percentage of total transcripts and plotted as the mean ± s.d. Blue, Tg-treated cells; gray, untreated cells. The results are representative of two biological replicates. (F) Immunoblot of GCN2 kinase activation in WT and phosphomimetic eIF3d-expressing cells. (G) Immunoblot of ISR signaling cascade activation upon pharmacological inhibition of PERK or GCN2 reveals contribution of both kinases during chronic ER stress. HEK293T cells were treated with DMSO or Tg for 8 or 16 h, followed by addition of indicated inhibitor for 45 min. PERKi, PERK inhibitor; GCN2iB, GCN2 inhibitor. The results in (F) and (G) are representative of three independent experiments. (H) Model for gene cascade controlled by eIF3d-mediated translation that drives synergized regulation of the persistent integrated stress response. See also Figure S5.

References

    1. Pakos-Zebrucka K, Koryga I, Mnich K, Ljujic M, Samali A, and Gorman AM (2016). The integrated stress response. EMBO reports 17, 1374–1395. 10.15252/embr.201642195. - DOI - PMC - PubMed
    1. Harding HP, Zhang Y, Zeng H, Novoa I, Lu PD, Calfon M, Sadri N, Yun C, Popko B, Paules R, et al. (2003). An integrated stress response regulates amino acid metabolism and resistance to oxidative stress. Molecular cell 11, 619–633. 10.1016/s1097-2765(03)00105-9. - DOI - PubMed
    1. Krishnamoorthy T, Pavitt GD, Zhang F, Dever TE, and Hinnebusch AG (2001). Tight binding of the phosphorylated alpha subunit of initiation factor 2 (eIF2ɑlpha) to the regulatory subunits of guanine nucleotide exchange factor eIF2B is required for inhibition of translation initiation. Molecular and cellular biology 21, 5018–5030. 10.1128/MCB.21.15.5018-5030.2001. - DOI - PMC - PubMed
    1. Harding HP, Novoa I, Zhang Y, Zeng H, Wek R, Schapira M, and Ron D (2000). Regulated translation initiation controls stress-induced gene expression in mammalian cells. Molecular cell 6, 1099–1108. 10.1016/s1097-2765(00)00108-8. - DOI - PubMed
    1. Starck SR, Tsai JC, Chen K, Shodiya M, Wang L, Yahiro K, Martins-Green M, Shastri N, and Walter P (2016). Translation from the 5' untranslated region shapes the integrated stress response. Science 351, aad3867. 10.1126/science.aad3867. - DOI - PMC - PubMed

Publication types

Substances