. 2023 Sep 19;4(9):101191.
doi: 10.1016/j.xcrm.2023.101191. Epub 2023 Sep 7.

PARP-1 improves leukemia outcomes by inducing parthanatos during chemotherapy

Affiliations

PARP-1 improves leukemia outcomes by inducing parthanatos during chemotherapy

Bruktawit Maru et al. Cell Rep Med. .

Abstract

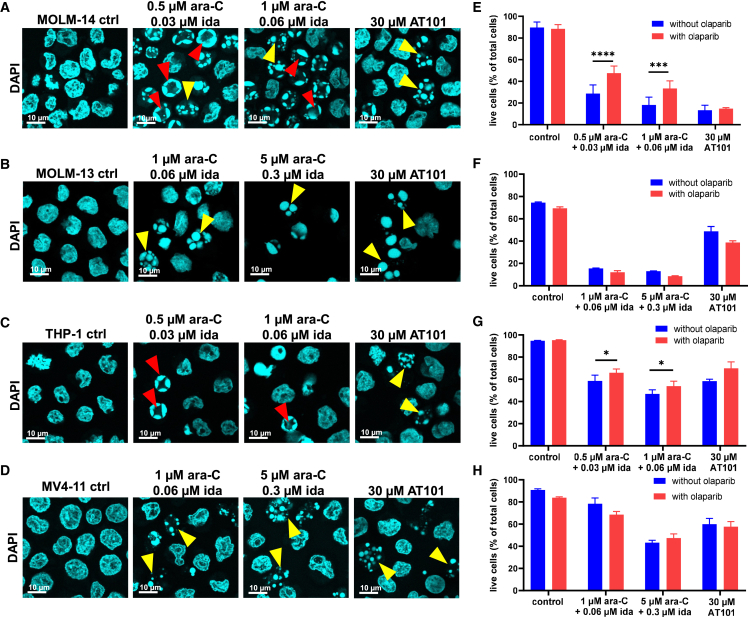
Previous chemotherapy research has focused almost exclusively on apoptosis. Here, a standard frontline drug combination of cytarabine and idarubicin induces distinct features of caspase-independent, poly(ADP-ribose) polymerase 1 (PARP-1)-mediated programmed cell death "parthanatos" in acute myeloid leukemia (AML) cell lines (n = 3/10 tested), peripheral blood mononuclear cells from healthy human donors (n = 10/10 tested), and primary cell samples from patients with AML (n = 18/39 tested, French-American-British subtypes M4 and M5). A 3-fold improvement in survival rates is observed in the parthanatos-positive versus -negative patient groups (hazard ratio [HR] = 0.28-0.37, p = 0.002-0.046). Manipulation of PARP-1 activity in parthanatos-competent cells reveals higher drug sensitivity in cells that have basal PARP-1 levels as compared with those subjected to PARP-1 overexpression or suppression. The same trends are observed in RNA expression databases and support the conclusion that PARP-1 can have optimal levels for favorable chemotherapeutic responses.

Keywords: NAD+ ADP-ribosyltransferase 1; PAR; PARP-1; acute myelomonocytic and monocytic leukemia; apoptosis; cancer biology; caspase-independent programmed cell death; nucleoside analog; poly(ADP-ribose); precision medicine; prognostic blood test.


Conflict of interest statement

Declaration of interests A.M. is an employee of Lonza Group AG

Figures

None
Graphical abstract
Figure 1
Figure 1
Cytarabine induces apoptosis in OCI-AML2 cells and parthanatos in OCI-AML3 cells (A) Phosphatidylserine exposure on the cell surface was detected by Annexin V staining, and membrane integrity was probed using propidium iodide (PI) following a 24-h treatment of OCI-AML2 cells (1 μM) or OCI-AML3 cells (10 μM) with ara-C for 24 h. Untreated (control) cells were >95% double negative for PI and Annexin V staining. (B) According to the cleavage of a fluorogenic substrate in live cells, ara-C treatment stimulated caspase-3 activity in OCI-AML2 cells (5 μM) but not OCI-AML3 cells (15 μM) after 8 h. Camptothecin (CPT) was used as positive control. Averaged values ± SD for n = 3 biological replicates are shown. (C) Fluorescence quenching revealed mitochondrial pore opening (MPO) in OCI-AML2 (black arrow), but not in OCI-AML3, cells according to the MitoProbe Transition Pore Assay and flow cytometry of OCI-AML2 cells treated with 1 μM ara-C and OCI-AML3 cells treated with 10 μM of ara-C for 24 h. Blue: untreated; red: ara-C treated; black: staining control calcein AM; gray: positive control ionomycin. (D) Mitochondrial membrane potentials (MPs) following ara-C treatment of OCI-AML2 cells (1 μM) and OCI-AML3 cells (10 μM) for 24 h. Blue: untreated; red: ara-C treated. (E) After 3 h of ara-C treatment, PAR accumulated in OCI-AML3 cells (10 μM), but was diminished in OCI-AML2 cells (1 μM), according to immunofluorescent staining. Blue: untreated; red: ara-C treated. (F) After 4 h of ara-C treatment, higher levels of AIF staining were observed in treated OCI-AML3 cells (10 μM) as compared with OCI-AML2 cells (1 μM). Blue: untreated; red: ara-C treated. (G) Immunostaining of AIF and microscopy revealed the release of AIF in OCI-AML3 cells treated with 10 μM ara-C for 4 h. The arrow highlights a cell with a characteristic “ring” structure of DNA and high abundance of released AIF. ∗∗∗∗p < 0.0001. Control (ctrl) samples were not treated with ara-C; n = 3 biological replicates (A–G).
Figure 2
Figure 2
Additional parthanatos features in OCI-AML3 cells (A) DAPI staining revealed globular chromatin fragments of highly variable sizes throughout the nuclei of OCI-AML2 cells treated with 1 μM ara-C for 24 h, whereas a relatively small number of large chromatin fragments are distributed in a ring-shaped pattern at the nuclear periphery of OCI-AML3 cells treated with 10 μM of ara-C for 24 h. ara-C concentrations were selected based on EC50 values for toxicity in each cell line. (B) The TUNEL assay confirmed a relatively broad distribution of small DNA fragments in OCI-AML2 as compared with OCI-AML3 cells following treatment with 1 and 10 μM ara-C, respectively, for 24 h. Blue: untreated; red: ara-C treated. (C) Nuclear morphologies in OCI-AML3 cells following 24-h treatment with a 17:1 mixture of ara-C and idarubicin as compared with 30 μM of the BH3 mimetic AT-101 (Gossypol) that selectively stimulates apoptosis. (D) Live/dead staining and flow cytometry analysis of OCI-AML3 cells treated with 1 μM of the PARP inhibitor olaparib for 24 h prior to treatment with a 17:1 mixture of ara-C and idarubicin (ida) for 24 h. (E) Live/dead staining and flow cytometry analysis of OCI-AML2 cells treated with 1 μM of the PARP inhibitor olaparib for 24 h prior to treatment with ara-C and ida for 24 h. (F) Trypan blue exclusion test of cell viability for OCI-AML3 cells treated with 10 μM of the caspase inhibitor Z-VAD-FMK 24 h prior to treatment with ara-C and ida for 24 h. (G) Trypan blue test of cell viability for OCI-AML2 cells treated with 10 μM of the caspase inhibitor Z-VAD-FMK 24 h prior to treatment with ara-C and ida for 24 h. Ctrl samples were not treated with ara-C or ida. ∗p < 0.05, ∗∗p < 0.01, and ∗∗∗∗p < 0.0001; DIC, differential interference contrast image; n = 3 biological replicates (A–C). Data are represented as mean ± SEM for n = 3 technical replicates of 3 biological replicates (D–G). (H) Relative viability (number of live cells in each experimental sample/control sample) of OCI-AML3 and OCI-AML2 cells receiving pre-treatment with a PARP-1-overexpressing plasmid for 72 h and/or 1 μM olaparib for 24 h prior to addition of ara-C and ida for 24 h. (I) Relative viability of OCI-AML3 and OCI-AML2 cells receiving pre-treatment with siRNA for 72 h and/or 1 μM olaparib for 24 h prior to addition of ara-C and ida for 24 h. Error bars: SEM; statistical tests for (H) and (I) were conducted using two-way ANOVA with Tukey’s multiple comparison test. ∗p < 0.03, ∗∗p < 0.002, ∗∗∗p < 0.0002, and ∗∗∗∗p < 0.0001. n = 3 technical replicates of 2 biological replicates (H and I).
Figure 3
Figure 3
Analyses of four common AML cell lines for parthanatos features following treatment with ara-C and ida (A–D) Nuclear fragmentation pattern analysis was conducted using DAPI staining, cytospin centrifugation, and confocal microscopy of cells 8 h following addition of ara-C and ida: (A) MOLM-14 (FAB M5); (B) MOLM-13 (FAB M5); (C) THP-1 (FAB M5); and (D) MV4-11 (FAB M5). Red arrowheads indicate ring-shaped nuclear fragmentation. Yellow arrowheads indicate globular nuclear fragmentation. (E–H) Percentage of live cells quantified by flow cytometry after 1 μM olaparib pre-treatment for 24 h and a 17:1 mixture of ara-C/ida treatment for 24 h: (E) MOLM-14 (FAB M5); (F) MOLM-13 (FAB M5); (G) THP-1 (FAB M5); and (H) MV4-11 (FAB M5). Statistical analysis was conducted using two-way ANOVA with Sidak multiple comparisons test; data are represented as mean ± SD for n = 3 replicates. ∗p < 0.03, ∗∗p < 0.002, ∗∗∗p < 0.0002, and ∗∗∗∗p < 0.0001.
Figure 4
Figure 4
Analysis of primary AML blasts and healthy PBMCs for two parthanatos features upon treatment with ara-C and ida ex vivo (A) PBMCs from healthy human donor (#7) treated with 1 μM of the PARP inhibitor olaparib (Olap) for 24 h prior to treatment with ara-C and ida for 24 h. Toxicity rescue was determined using a differential staining cytotoxicity assay, and nuclear fragmentation patterns were analyzed using DAPI staining, cytospin centrifugation, and confocal microscopy. Semi-quantitative image analyses of data from all 10 donor samples (Data S1) indicate that the ring-shaped nuclear patterns were observed in 14%–46% of the treated PBMCs as compared with only 0.3%–2.7% of the untreated PBMCs. Cells treated with either ara-C or ida alone also exhibited the characteristic DNA “ring” morphologies (Data S2). (B) Primary cells from a patient with AML (ID 17-008) exhibiting both parthanatos features following treatment with ara-C and ida for 24 h (see Data S4 for all 18 examples). Concentrations are given in terms of ara-C. (C) Primary cells from a patient with AML (ID 04-015) exhibiting neither parthanatos feature following treatment with ara-C and ida for 24 h. See Data S5 for all 21 examples of primary AML isolates exhibiting zero or one parthanatos feature. (D) Summary of percentage of cells rescued from ara-C/ida toxicity by Olap pre-treatment of PBMCs from healthy donors (n = 10), of primary AML cell samples exhibiting nuclear ring structures (ring positive [pos], n = 20), or of primary AML cells lacking ring structures (ring negative [neg], n = 19). (E) Caspase-3 activation in primary AML blast samples taken from parthanatos-pos and parthanatos-neg patient groups following 8-h incubations with ara-C and ida according to the cleavage of a fluorogenic caspase-3 substrate in live cells. Error bars: SD; statistical analysis was done by one-way ANOVA with Tukey’s multiple comparison test. ∗p < 0.03.
Figure 5
Figure 5
Kaplan-Meier survival estimates of parthanatos-pos (+) versus -neg (−) subgroups, and PARP1 mRNA expression versus overall survival (A) Overall percentage of survival (OS) versus time of parthanatos+/− subgroups according to assignment 1 (Table 1). See Figure S5 for survival analyses of assignments #2 and #3 and Figure S6 for event-free survival analyses. (B) OS analysis of 210 patients with M4/M5 de novo AML (≤60 years old) following 7+3 induction chemotherapy with ara-C and ida versus PARP1 mRNA quantities measured pre-treatment according to the GEO: GSE6891 microarray dataset. (C) OS analysis of M4/M5 AML FLT3 wild-type (i.e., FLT−) subgroup (n = 151) versus PARP1 mRNA quantities according to the microarray dataset. (D) OS analysis of M4/M5 AML FLT3 wild-type subgroup (n = 56) versus PARP1 mRNA quantities according to microarray RNA-seq (TCGA) dataset. (E) OS curves for M4/M5 FLT3-mutated AML subgroup versus PARP1 mRNA quantities prior to treatment according to the microarray dataset. Patients were grouped into three equal groups based on the relative mRNA expression (low: 0%–33%; middle: 33%–66%; and high: 66%–100%), and OSs were plotted using Kaplan-Meier survival estimates. (F) Boxplot with whiskers (25%–75% interquartile range) illustrating higher relative PARP1 mRNA levels in patients with FLT3 mutation (FLT3+) versus wild-type (FLT3−) according to microarray dataset. See Figure S6 for OS analyses of M1/M2 AML versus PARP1, PARP2, PARG, and ARH3. ∗p < 0.05, ∗∗p < 0.01, ∗∗∗p < 0.001, and ∗∗∗∗p < 0.0001.

References

    1. Costa A.F.O., Menezes D.L., Pinheiro L.H.S., Sandes A.F., Nunes M.A.P., Lyra Junior D.P., Schimieguel D.M. Role of new Immunophenotypic Markers on Prognostic and Overall Survival of Acute Myeloid Leukemia: a Systematic Review and Meta-Analysis. Sci. Rep. 2017;7:4138. doi: 10.1038/s41598-017-00816-2. - DOI - PMC - PubMed
    1. Cicconi L., Lo-Coco F. Current management of newly diagnosed acute promyelocytic leukemia. Ann. Oncol. 2016;27:1474–1481. doi: 10.1093/annonc/mdw171. - DOI - PubMed
    1. Kopmar N.E., Estey E.H. New drug approvals in acute myeloid leukemia: an unprecedented paradigm shift. Clin. Adv. Hematol. Oncol. 2019;17:569–575. - PubMed
    1. Estey E.H. Acute myeloid leukemia: 2019 update on risk-stratification and management. Am. J. Hematol. 2018;93:1267–1291. doi: 10.1002/ajh.25214. - DOI - PubMed
    1. Vincelette N.D., Yun S. Assessing the Mechanism of Cytarabine-Induced Killing in Acute Leukemia. Blood. 2014;124:5210. doi: 10.1182/blood.V124.21.5210.5210. - DOI

Publication types

Substances

Grants and funding