. 2024 Jul:61:179-192.
doi: 10.1016/j.jare.2023.09.002. Epub 2023 Sep 6.

Plasma glycoproteomics delivers high-specificity disease biomarkers by detecting site-specific glycosylation abnormalities

Affiliations

Plasma glycoproteomics delivers high-specificity disease biomarkers by detecting site-specific glycosylation abnormalities

Hans J C T Wessels et al. J Adv Res. 2024 Jul.

Abstract

Introduction: The human plasma glycoproteome holds enormous potential to identify personalized biomarkers for diagnostics. Glycoproteomics has matured into a technology for plasma N-glycoproteome analysis but further evolution towards clinical applications depends on the clinical validity and understanding of protein- and site-specific glycosylation changes in disease.

Objectives: Here, we exploited the uniqueness of a patient cohort of genetic defects in well-defined glycosylation pathways to assess the clinical applicability of plasma N-glycoproteomics.

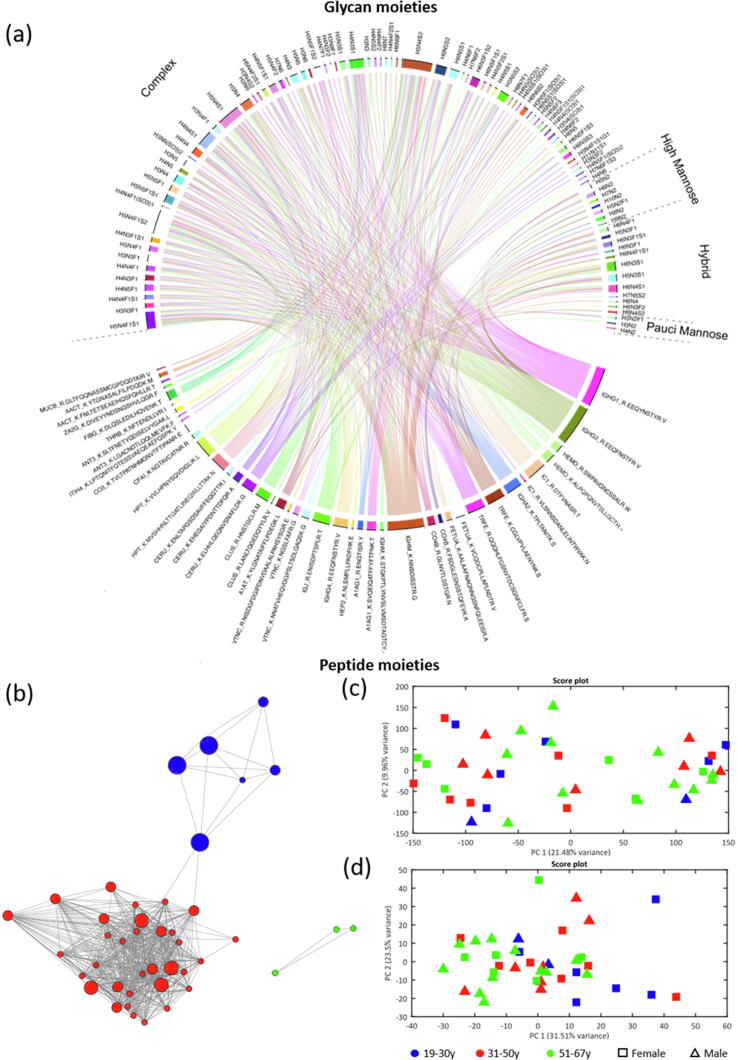
Methods: Comparative glycoproteomics was performed of blood plasma from 40 controls and 74 patients with 13 different genetic diseases that impact the protein N-glycosylation pathway. Baseline glycosylation in healthy individuals was compared to reference glycome and intact transferrin protein mass spectrometry data. Use of glycoproteomics data for biomarker discovery and sample stratification was evaluated by multivariate chemometrics and supervised machine learning. Clinical relevance of site-specific glycosylation changes were evaluated in the context of genetic defects that lead to distinct accumulation or loss of specific glycans. Integrated analysis of site-specific glycoproteome changes in disease was performed using chord diagrams and correlated with intact transferrin protein mass spectrometry data.

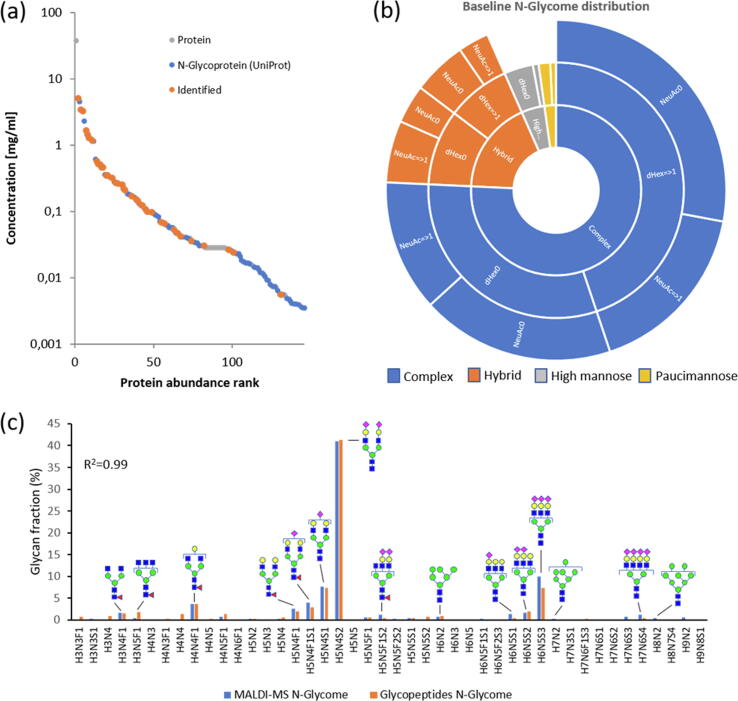
Results: Glycoproteomics identified 191 unique glycoforms from 58 unique peptide sequences of 34 plasma glycoproteins that span over 3 magnitudes of abundance in plasma. Chemometrics identified high-specificity biomarker signatures for each of the individual genetic defects with better stratification performance than the current diagnostic standard method. Bioinformatic analyses revealed site-specific glycosylation differences that could be explained by underlying glycobiology and protein-intrinsic factors.

Conclusion: Our work illustrates the strong potential of plasma glycoproteomics to significantly increase specificity of glycoprotein biomarkers with direct insights in site-specific glycosylation changes to better understand the glycobiological mechanisms underlying human disease.

Keywords: Blood plasma; Clinical applications; Congenital disorders of glycosylation; Glycoproteomics; Glycosylation.


Conflict of interest statement

Declaration of Competing Interest The authors declare the following financial interests/personal relationships which may be considered as potential competing interests: Contributing authors Pierre-Olivier Schmit, Stuart Pengelley, and Kristina Marx are employees of Bruker Daltonics which is the manufacturer of some of the hardware and software that were used in this work.

Figures

None
Graphical abstract
Fig. 1
Fig. 1
Overall glycoproteomics strategy and analytical performance. (a) Data generation workflow: Plasma proteins were subjected to in solution tryptic digestion and glycopeptides were enriched by solid phase extraction using Sepharose CL-4B material . Glycopeptide mixtures were analysed by C18 reversed phase liquid chromatography with online tandem mass spectrometry using low and high collision energies (CE) for glycan- and peptide-moiety fragmentation experiments, respectively . (b) Data processing workflow. Quantitative information was extracted from data files as feature maps and subsequently combined into a consensus feature map in OpenMS software. ProteinScapeTM 3.1 was used to perform MS/MS glycopeptide spectrum searches and classified MS/MS spectra were searched against the CarbBank glycan database using GlycoQuest or against the Swiss-prot human protein sequence database using MASCOT. In-house developed MATLAB scripts were used to map identified glycan- and peptide-moieties onto the consensus feature map for subsequent analyses. (c) Base peak chromatogram overlay from five replicate injections of a glycopeptide preparation from a single control sample. (d) Log intensity scatterplot of features for two replicate injections of a single control sample. (e) Violin plot of Pearson’s correlation coefficients from replicate injections (Tech; n = 5), independent sample preparations and measurements of a single biological sample (Meth; n = 5), 1–5 plasma feeze/thaw cycles (Fpro n = 5), 1–5 glycopeptide sample freeze/thaw cycles (Fpep n = 5), and in-time 0–24 hr technical replicates of single glycopeptide samples stored at 10 °C (Time; n = 5).
Fig. 2
Fig. 2
Blood plasma glycoproteome in healthy subjects. (a) Glycoprotein abundance distribution of identified glycopeptides. (b) Qualitative distribution of identified glycan moieties over major N-glycan classes and traits. (c) Relative glycome representations of our experimental glycoproteomics data and glycomics reference data from literature . High abundant glycans are annotated with proposed glycan structures.
Fig. 3
Fig. 3
Observed glycoproteome in healthy subjects. (a) Chord diagram that visualizes qualitative glycan – peptide relationships of the baseline glycoproteome. Peptides are indexed at the bottom of the diagram and connected via chords to respective identified glycan moieties at the top. (b) Glycosylation site similarity network with peptide moiety nodes and edges representing r ≥ 0.8 PCC based on relative glycan trait profiles. Colors are used to indicate distinct clusters. PCA score plots from the first two principal components using (c) site-specific glycoform fractions and (d) site-specific glycan trait profiles with age classes indicated by color coding and sex by symbols.
Fig. 4
Fig. 4
Sample stratification and biomarker identification results for CDG defects. (a) Supervised PLS-DA results for glycoproteomics and intact TRFE IP-MS data of CDG defects versus controls as reported area under the curve (AUC), Z-score and number of significant features. Glycoproteomics PLS-DA results are visualized as PCA score plots of significant features for each respective model. (b) GA-RF confusion matrix showing the number of correct classifications for samples (rows) to respective genetic defect classes (columns) in green or incorrect classification results in red. (c) Unsupervised t-stochastic neighbour embedding plot of GA-RF selected features shows clear separation of samples according to disturbed biological processes. Perturbated Golgi function: ATP6AP1, ATP6V0A2, CCDC115, TMEM199, DYM, COG5. Impaired sugar metabolism: PGM1 and NANS. Independent clusters of N-glycan synthesis enzymes: MAN1B1 and B4GALT1. (For interpretation of the references to color in this figure legend, the reader is referred to the web version of this article.)
Fig. 5
Fig. 5
Clinical relevance of site-specific glycosylation changes in CDG. (a) Site-specific glycosylation profiles for five CDG types with defined defects in N-glycan biosynthesis were compared to healthy controls, expressed as (b) average change in glycan trait distribution.. This indicates the average relative change in glycan traits in patients compared to controls from all glycosylation sites. Glycan classes were categorized as follows: C: complex, H: hybrid, HM: high mannose, 1A: single antenna, 2A: two antenna, >2A: 3 or more antenna, G: galactose lacking, GN: GlcNAc lacking, F: fucosylated, Sh: hypo-sialylated, Si: iso-sialylated. (c) Illustrative case examples of relative site-specific glycan changes in patient samples from the five CDG defects versus healthy controls, visualized for the indicated sites of glycoproteins immunoglobulin heavy constant gamma 1 (IGHG1), haptoglobin (HPT), immunoglobulin heavy constant mu (IGHM), complement C3 (CO3), vitronectin (VTNC) and plasma protease C1 inhibitor (IC1).
Fig. 6
Fig. 6
Site-specific glycosylation changes in MAN1B1 deficiency. (a) Differential chord diagram depicting all site-specific glycosylation changes relative to baseline glycosylation for MAN1B1 deficiency (see supplementary Fig. 5 for other CDG types). Chord colors and width indicate relative changes in patients versus controls. TRFE glycopeptides N432 (CGLVPVLAENYNK) and N630 (QQQHLFGSNVTDCSGNFCLFR) are boxed in the chord diagram. Site-specific glycosylation profiles (microheterogeneity) of TRFE at (b) Asn432 and (c) Asn630 in healthy individuals (n = 40) and MAN1B1 deficiency patients (n = 8) show that glycosylation of TRFE is exclusively affected at Asn432. (d) Macroheterogeneity profiles of TRFE determined in healthy (n = 40) and disease subjects (n = 8) by intact protein LC-MS show that only one of both glycosylation sites of TRFE is always affected by MAN1B1 deficiency. (e) Inferred TRFE glycoform distributions from combining micro- and macro-heterogeneity data visualized with glycan positions indicated in the 3D surface structure of TRFE (pdb: 6JAS).

References

    1. Schjoldager K.T., Narimatsu Y., Joshi H.J., Clausen H. Global view of human protein glycosylation pathways and functions. Nat Rev Mol Cell Biol. 2020;21(12):729–749. - PubMed
    1. Reily C., Stewart T.J., Renfrow M.B., Novak J. Glycosylation in health and disease. Nat Rev Nephrol. 2019;15(6):346–366. - PMC - PubMed
    1. Lefeber D.J. Protein-Specific Glycoprofiling for Patient Diagnostics. Clin Chem. 2016;62(1):9–11. - PubMed
    1. Hipgrave Ederveen A.L., de Haan N., Baerenfaenger M., Lefeber D.J., Wuhrer M. Dissecting Total Plasma and Protein-Specific Glycosylation Profiles in Congenital Disorders of Glycosylation. Int J Mol Sci. 2020;21(20) - PMC - PubMed
    1. Merleev A.A., Park D., Xie Y., Kailemia M.J., Xu G., Ruhaak L.R., et al. A site-specific map of the human plasma Glycome and its age and gender-associated alterations. Sci Rep. 2020;10(1):17505. - PMC - PubMed

LinkOut - more resources