. 2023 Sep 8;14(1):5521.
doi: 10.1038/s41467-023-41088-x.

Cyclic AMP induces reversible EPAC1 condensates that regulate histone transcription

Affiliations

Cyclic AMP induces reversible EPAC1 condensates that regulate histone transcription

Liliana Felicia Iannucci et al. Nat Commun. .

Abstract

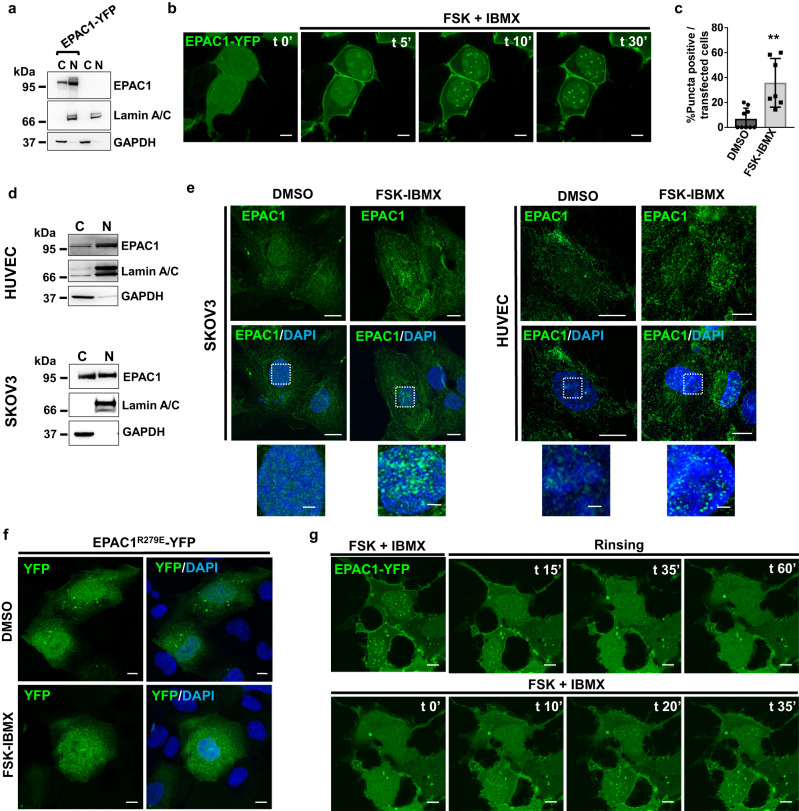
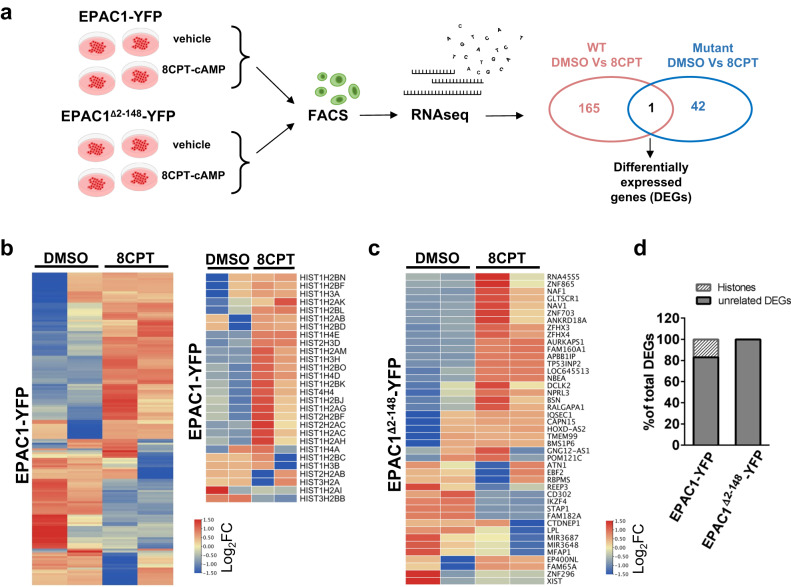
The second messenger cyclic AMP regulates many nuclear processes including transcription, pre-mRNA splicing and mitosis. While most functions are attributed to protein kinase A, accumulating evidence suggests that not all nuclear cyclic AMP-dependent effects are mediated by this kinase, implying that other effectors may be involved. Here we explore the nuclear roles of Exchange Protein Activated by cyclic AMP 1. We find that it enters the nucleus where forms reversible biomolecular condensates in response to cyclic AMP. This phenomenon depends on intrinsically disordered regions present at its amino-terminus and is independent of protein kinase A. Finally, we demonstrate that nuclear Exchange Protein Activated by cyclic AMP 1 condensates assemble at genomic loci on chromosome 6 in the proximity of Histone Locus Bodies and promote the transcription of a histone gene cluster. Collectively, our data reveal an unexpected mechanism through which cyclic AMP contributes to nuclear spatial compartmentalization and promotes the transcription of specific genes.


Conflict of interest statement

The authors declare no competing interests.

Figures

Fig. 1
Fig. 1. The nuclear EPAC1 moiety forms reversible oligomers in response to cAMP elevations.
a Western blotting of cytosol and nuclei-enriched fractions of naïve (right lanes) or EPAC1-YFP expressing HEK cells (left lanes). b Still captures of live confocal imaging of EPAC1-YFP in HEK cells. In response to cAMP elevating agonists (forskolin (FSK) combined to IBMX cytosolic EPAC1 moves to plasma membrane while nuclear EPAC1 forms round-shaped structures. Scale bar, 5 μm. c Quantification of EPAC1-YFP expressing HEK cells forming nuclear EPAC1-YFP oligomers (over the total transfected cells) treated with FSK-IBMX for 1 hour. Data are expressed as mean ± SD and statistical significance was determined by two-sided, unpaired Student’s t-test (**p = 0.0013). n = 3 independent experiments. Source data are provided as a Source data file. d Western blotting of cytosol and nuclei-enriched fractions of HUVEC and SKOV3 cells. e Confocal photomicrographs of endogenous EPAC1 distribution in cells (HUVEC, SKOV3) treated with DMSO (control) or forskolin in combination to IBMX (FSK-IBMX) to increase cAMP levels. Scale bar, 10 μm (enlargements 3 μm). f Confocal photomicrographs of HEK cells expressing the cAMP-binding deficient mutant EPAC1R279E-YFP. Scale bar, 10 μm. g Live confocal imaging of EPAC1-YFP. Cells were pre-treated with FSK-IBMX to induce nuclear EPAC1-YFP oligomerization for 30 minutes. Upon rinsing EPAC1 oligomers dissolve to be formed again in response to subsequent treatment with FSK-IBMX. [FSK] 20 μΜ, [IBMX] 400 μΜ. Scale bar, 8 μm. Lamin A/C and GAPDH nuclear and cytosolic markers, respectively. Nuclei were visualized using DAPI. C: cytosol; N: nucleus. Experiments were repeated at least three times with similar results.
Fig. 2
Fig. 2. Nuclear EPAC1 oligomers are highly dynamic structures with biomolecular condensate characteristics.
a Confocal photomicrograph  showing the characteristic round hollow shape of EPAC1-YFP condensates after 60 min of FSK-IBMX treatment. Scale bar, 8 μm (enlargement: 2 μm). b Analysis of EPAC1 condensate circularity index and a representative condensate 3D rendering (inset), n = 1595 puncta, scale bar 0.8 μm. Data are presented as scatter dot plots of individual data points and mean ± SD error bars. c Still captures of live confocal imaging of HEK cells expressing EPAC1-YFP. Addition of 5% 1,6-hexanediol on top of FSK-IBMX disperses the nuclear EPAC1-YFP condensates. Scale bar, 10 μm. d Live confocal imaging of HEK cells expressing EPAC1-YFP. Treatment with FSK-IBMX triggers the formation of condensates and several fusion events of adjacent condensates are evidenced (arrows). Scale bar, 5 μm. ln the last panel a rendering and calculation of the circularity index of two fusion events (*,#) is presented. e Still images of live confocal FRAP experiments (Fluorescence Recovery After Photobleaching). The fluorescence of a single nuclear EPAC1-YFP condensate was targeted with maximal laser power which bleached the fluorescent molecules present in the condensate. Fluorescence rapidly recovered demonstrating the exchange with unbleached molecules from the soluble surrounding. Scale bar, 10 μm. f Quantification of fluorescence intensity of four independent experiments shows 80% of recovery within 60 s from the bleaching event. [FSK] 20 μΜ, [IBMX] 400 μΜ. Data are presented as mean values ± SD. Source data are provided as a Source data file. Unless otherwise stated experiments were repeated at least three times with similar results.
Fig. 3
Fig. 3. The N-terminal region of EPAC1 contains low complexity regions necessary for phase transition.
a Schematic map of the EPAC1 domains overlapped to the distribution of intrinsically disordered regions within EPAC1 identified by the bioinformatic algorithm D2p2, which takes advantage of several specialized IDR prediction tools (listed on the right). b Confocal images of HEK cells expressing the deletion mutant EPAC1Δ2-148-YFP. Scale bar, 10 μm. c Proportion of purified wild type EPAC1  that forms condensates in function of the salt concentration and the presence or absence of cAMP. The difference is maximal at salt concentrations comparable to those of physiological conditions (150 mM), indicating that when cAMP is not present, the amount of EPAC1 able to form condensate is minimal, while it reaches a value of ~50% when cAMP is available, in good agreement with the cell biology experiments. Data are presented as mean values ± SEM. n = 3 independent experiments. d Percentage of phase separation at near-physiological conditions of purified EPAC1 compared with the EPAC1Δ2-148 mutant, not able to form condensates physiologically. Data are presented as mean values ± SEM. n = 3 independent experiments. Statistical significance was determined by One-way ANOVA (**p = 0.01818). e Confocal images of HEK cells expressing the deletion mutant EPAC1Δ2-24-YFP or EPAC1Δ48-148-YFP (f). Both mutants were unable to undergo phase transition in response to FSK-IBMX treatment. g Confocal images of HEK cells expressing the deletion mutant EPAC1Δ145-175-YFP. This construct formed condensates constitutively and independently of the cAMP levels. Nuclei were visualized using DAPI. [FSK] 20 μΜ, [IBMX] 400 μΜ. Scale bar 10 μm. Experiments were repeated at least three times with similar results.
Fig. 4
Fig. 4. EPAC1 condensates interact with other nuclear membraneless organelles.
Confocal photomicrographs of HEK cells expressing EPAC1-YFP and probed for endogenous Nucleolin for identifying the nucleoli (a) or SMN (survival motor neuron) protein to identify Cajal bodies (b). c Confocal images of endogenous PML (red) to map PML-NBs and EPAC1-YFP (green). Several overlapping spots were observed between the two organelles (orthogonal view in last panel). d Confocal images of endogenous NPAT (Nuclear Protein, Ataxia-Telangiectasia Locus) (red) to recognize histone locus bodies (HLBs) and EPAC1-YFP (green). Several points of overlap were observed (orthogonal view in last panel). Nuclei were visualized using DAPI. [FSK] 20 μΜ, [IBMX] 400 μΜ. Scale bars, 10 μm. Experiments were repeated at least three times with similar results. e Colocalization analysis based on center of mass-particles coincidence or based on distance between centers of mass (green Vs red) between EPAC1-YFP and PML, NPAT and SMN. The boxes show interquartile ranges. The horizontal line across each box denotes the median, and vertical lines extending above and below each box indicate the minimum and maximum values. PML n = 17, NPAT n = 35, SMN n = 19 nuclei over 3 independent experiments. f 3D representation of image volume rendering (Airyscan confocal 3D volume rendering of z-stack images). The experiments for (a), (b), (c), (d) were repeated 3–5 times independently with similar results. Source data are provided as a Source data file.
Fig. 5
Fig. 5. EPAC1 condensates regulate the transcription of several genes including the large Histone cluster 1.
a Schematic representation of the experimental design used for the RNAseq experiments (created using Microsoft PowerPoint). b Heatmap of differentially expressed genes (DEGs) between EPAC1-YFP-expressing HEK cells treated with DMSO or the EPAC1-specific activator 8CPT-cAMP (5 µM) for 40′ (p < 0,01). Significance was calculated using Cuffdiff’s t-test analogical methods. Upregulated genes are represented in red while downregulated ones are in blue. Detail: histone genes differentially expressed. c Heatmap of DEGs between EPAC1Δ2-148-YFP-expressing HEK cells treated with DMSO or 8CPT-cAMP (5 µM). d Percentage of differentially expressed histone genes in the two comparisons. RNAseq experiments were repeated three times independently, for analysis two experiments were used for EPAC1-YFP and three for EPAC1Δ2-148-YFP. Source data are provided (see “Data availability” section).
Fig. 6
Fig. 6. EPAC1 condensates localize at the Histone cluster 1 on chromosome 6.
a Confocal photomicrographs of colocalization experiments between EPAC1-YFP fluorescence (green) and the chromosome 6 p22.2 locus labeled by a custom-made probe (red) using fluorescence in situ hybridization (FISH) in HEK cells treated with FSK-IBMX. Significant overlap between the DNA probe and EPAC1-YFP was observed in around 40% of the labeled Chr 6p22.2 loci. b, c, d Confocal photomicrographs of EPAC1-YFP (green) and, respectively, (red) chromosome 21 (21q22.13-q22.2), chromosome 12 centromere (CEP) and Chromosome 15 centromere (CEP) loci labeled in FISH experiments using commercial probes, in HEK cells treated with FSK-IBMX. No significant correlation between these sites and EPAC1-YFP (green) was observed. Scale bar, 10 μm (enlargement 1 μm). e Correlation analysis between red and green signals. Lower panel shows colorimetric maps using nMDP values. (Right panel) Graph depicting the calculated index of correlation (Icorr) which represents the fraction of positively correlated (colocalized) pixels (FISH foci analyzed Chr6p22.2 n = 110 over 4 independent experiments; Chr21q n = 34 over 3 independent experiments; CEP15 n = 37 over 3 independent experiments; CEP12 n = 10 over 2 independent experiments). Statistical significance was determined by one-way ANOVA (****p < 0.0001). Error bars: SD. Source data are provided as a Source data file. Nuclei were labeled with DAPI. [FSK] 20 μΜ, [IBMX] 400 μΜ. Scale bar, 1 μm.

References

    1. Di Benedetto G, et al. Compartmentalized signaling in aging and neurodegeneration. Cells. 2021;10:464. - PMC - PubMed
    1. Lefkimmiatis K, Zaccolo M. CAMP signaling in subcellular compartments. Pharmacol. Ther. 2014;143:295–304. - PMC - PubMed
    1. Harootunian AT, et al. Movement of the free catalytic subunit of cAMP-dependent protein kinase into and out of the nucleus can be explained by diffusion. Mol. Biol. Cell. 1993;4:993–1002. - PMC - PubMed
    1. Sample V, et al. Regulation of nuclear PKA revealed by spatiotemporal manipulation of cyclic AMP. Nat. Chem. Biol. 2012;8:375–382. - PMC - PubMed
    1. Clister T, Greenwald EC, Baillie GS, Zhang J. AKAP95 organizes a nuclear microdomain to control local cAMP for regulating nuclear PKA. Cell Chem. Biol. 2019;26:885–891. - PMC - PubMed

Publication types