. 2023 Sep 8;14(1):5547.
doi: 10.1038/s41467-023-41178-w.

Serotonin signaling regulates actomyosin contractility during morphogenesis in evolutionarily divergent lineages

Affiliations

Serotonin signaling regulates actomyosin contractility during morphogenesis in evolutionarily divergent lineages

Sanjay Karki et al. Nat Commun. .

Abstract

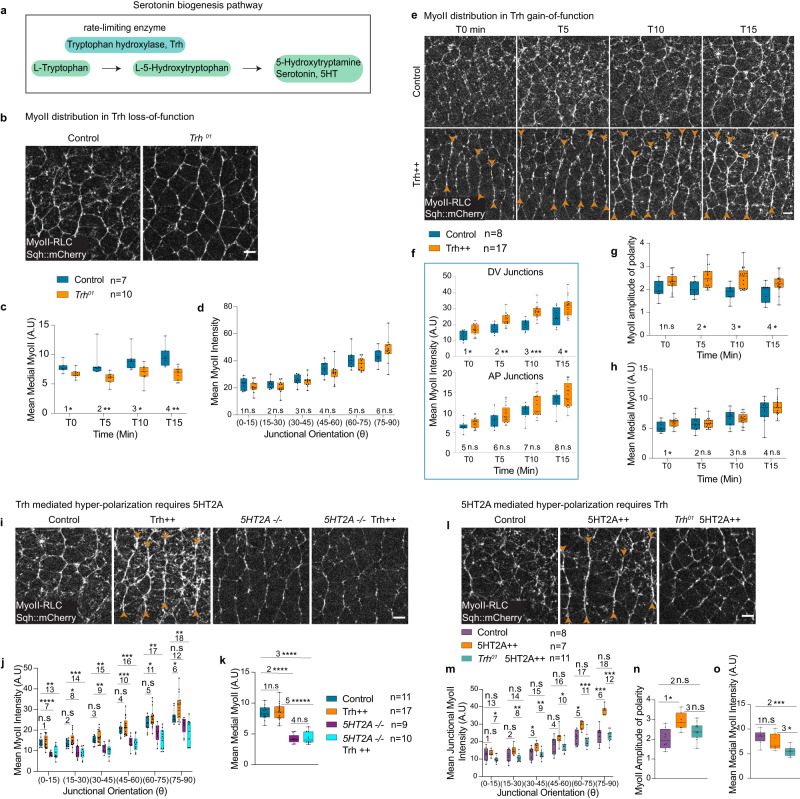
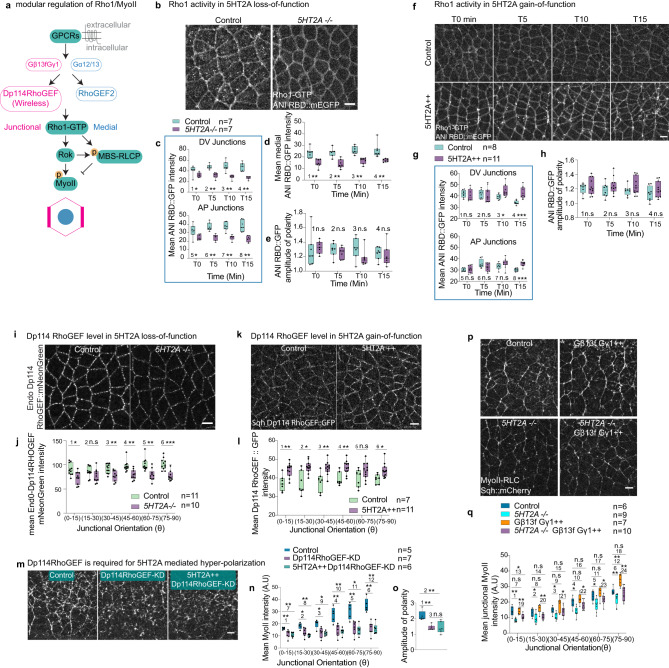
Serotonin is a neurotransmitter that signals through 5-HT receptors to control key functions in the nervous system. Serotonin receptors are also ubiquitously expressed in various organs and have been detected in embryos of different organisms. Potential morphogenetic functions of serotonin signaling have been proposed based on pharmacological studies but a mechanistic understanding is still lacking. Here, we uncover a role of serotonin signaling in axis extension of Drosophila embryos by regulating Myosin II (MyoII) activation, cell contractility and cell intercalation. We find that serotonin and serotonin receptors 5HT2A and 5HT2B form a signaling module that quantitatively regulates the amplitude of planar polarized MyoII contractility specified by Toll receptors and the GPCR Cirl. Remarkably, serotonin signaling also regulates actomyosin contractility at cell junctions, cellular flows and epiblast morphogenesis during chicken gastrulation. This phylogenetically conserved mechanical function of serotonin signaling in regulating actomyosin contractility and tissue flow reveals an ancestral role in morphogenesis of multicellular organisms.


Conflict of interest statement

The authors declare no competing interests.

Figures

Fig. 1
Fig. 1. 5HT2A is required for cell intercalation and MyoII accumulation in the Drosophila ectoderm.
a Ectoderm morphogenesis during Drosophila axis extension. b, c T1 events in 5HT2A loss-of-function. Representative images of T1s in control (top panels) and 5HT2A mutant (5HT2A−/−) (bottom panels) taken at T0 (left) and T25 min (right) (b) and quantification of cumulative T1s in the respective conditions (c). The center dashed line is mean and the error bands are the standard deviation. Statistical significance was calculated by two-tailed Mann–Whitney U test at 30 min (*P ≤ 0.05). dg MyoII distribution in 5HT2A loss-of-function in the region outlined in a. Live images of MyoII every 5 min interval, upper panels: control, lower panels: 5HT2A−/− (d). Quantification of mean MyoII intensities in DV-oriented and AP-oriented junctions (e), amplitude of polarity (f) and mean medial-apical MyoII intensity (g) over time. hk MyoII distribution in 5HT2A overexpression (5HT2A + +). Live images of MyoII over-time, upper panels: control, lower panels: 5HT2A + +, orange arrowheads showing the hyper-polarization of junctional MyoII (h). Quantification of MyoII intensities in DV-oriented and AP oriented junctions (i), amplitude of polarity (j) and mean medial MyoII intensities (k). l, m T1 events in 5HT2A gain-of-function. Representative images of the T1 events taken at T0 (left) and T30 min (right) for control (upper panels) and 5HT2A + + (lower panels) (l) and quantification of cumulative T1 events in the respective conditions (m). The center dashed line is the mean and the error bands are the standard deviation. Statistical significance was calculated by two-tailed Mann–Whitney U test at 30 min (*P ≤ 0.05). In the box plots in (e, f, g, i, j, k), the line in the middle is plotted at the median. The box extends from the 25th to 75th percentiles. The whiskers indicate minimum and maximum values. Statistics: ns P > 0.05, *P ≤ 0.05, **P ≤ 0.005, ***P ≤ 0.0005, ****P ≤ 0.00005 from two-tailed Mann–Whitney test. P values in (e): 1 (P = 0.015), 2 (P = 0.001), 3 (P = 1.55 × 10−4), 4 (P = 3.11 × 10−4), 5 (P = 0.0023), 6 (P = 0.015), 7 (P = 1.55 × 10−4), 8 (P = 1.55 × 10−4), 9 (P = 1.55 × 10−4), 10 (P = 0.003). P values in (f): 1 (P = 0.021), 2 (P = 0.798), 3 (P = 0.645), 4 (P = 0.959), 5 (P = 0.959). P values in (g): 1 (P = 0.015), 2 (P = 0.001), 3 (P = 0.002), 4 (P = 6.22 × 10−4), 5 (P = 0.003). P values in (i): 1 (P = 0.219), 2 (P = 0.034), 3 (P = 0.007), 4 (P = 4.76 × 10−4), 5 (P = 2.6 × 10−5), 6 (P > 0.999), 7 (P = 0.464), 8 (P = 0.508), 9 (P = 0.427), 10 (P = 0.657). P values in (j): 1 (P = 0.554), 2 (P = 0.082), 3 (P = 0.148), 4 (P = 0.016), 5 (P = 0.016). P values in (k): 1 (P = 0.651), 2 (P = 0.041), 3 (P = 0.012), 4 (P = 0.851), 5 (P = 0.109). n = number of embryos. Scale bars in (b, l) 10 µm, in (d, h) 5 µm. Source data are provided as a Source Data file.
Fig. 2
Fig. 2. Serotonin signaling is permissive in the ectoderm.
a Schematic of serotonin biogenesis, tryptophan hydroxylase (Trh) is the rate-limiting enzyme. bd, b Snapshot of MyoII in Trh loss-of-function (Trh01 mutant); control (left panel) and Trh01 (right panel). Quantification of mean medial-apical MyoII levels over-time (c) and an example of the distribution of junctional MyoII intensities in different junctional orientations for different conditions (d). eh Time-lapse of MyoII in Trh gain-of-function (Trh + +), top panels: control, lower panels: Trh + +, orange arrowheads indicate hyper-polarization of junctional MyoII (e). Quantification of MyoII intensities over-time in DV and AP oriented junctions (f), amplitude of polarity (g), and medial MyoII intensities (h). ik Trh + + and 5HT2A−/−i MyoII images in different conditions (from left to right respectively): control, Trh + + (orange arrowheads indicate hyper-polarization), 5HT2A-/- and 5HT2A-/- Trh + +. Quantification of junctional (j), and medial MyoII (k) intensities in different conditions. lo Trh01 and 5HT2A + +. MyoII in control (left panel), 5HT2A + + (middle panel, orange arrowheads indicate hyper-polarization) and Trh01 5HT2A + + (right panel) (l), quantification of junctional MyoII intensities (m), amplitude of polarity (n), and medial MyoII (o) in different genotypes. In the box plots in (c, d, f, g, h, j, k, m, n, o), the line in the middle is plotted at the median. The box extends from the 25th to 75th percentiles. The whiskers indicate minimum and maximum values. Statistics: ns: P > 0.05, *P ≤ 0.05, **P ≤ 0.005, ***P ≤ 0.0005, ****P ≤ 0.00005, *****P ≤ 0.000005 from two-tailed Mann–Whitney test. P values in (c): 1 (P = 0.01), 2 (P = 0.0004), 3 (P = 0.014), 4 (P = 0.0007). P values in (d): 1 (P = 0.375), 2 (P = 0.285), 3 (P = 0.596), 4 (P = 0.211), 5 (P = 0.328), 6 (P = 0.285). P values in (f): 1 (P = 0.013), 2 (P = 0.002), 3 (P = 0.000055), 4 (P = 0.022), 5 (P = 0.157), 6 (P = 0.238), 7 (P = 0.475), 8 (P = 0.475). P values in (g): 1 (P = 0.114), 2 (P = 0.024), 3 (P = 0.005), 4 (P = 0.03). P values in (h): 1 (P = 0.035), 2 (P = 0.711), 3 (P = 0.537), 4 (P = 0.786). P values in (j): 1 (P = 0.963), 2 (P = 0.134), 3 (P = 0.264), 4 (P = 0.43), 5 (P = 0.147), 6 (P = 0.029), 7 (P = 1.2 × 10−5), 8 (P = 0.01), 9 (P = 0.001), 10 (P = 2.26 × 10−4), 11 (P = 0.038), 12 (P = 0.056), 13 (P = 0.001), 14 (P = 3.8 × 10−4), 15 (P = 0.001), 16 (P = 1.7 × 10−4), 17 (P = 0.001), 18 (P = 0.005). P values in (k): 1 (P = 0.853), 2 (P = 1.2 × 10−5), 3 (P = 6 × 10−6), 4 (P = 0.842), 5 (P < 1 × 10−6). P values in (m): 1 (P = 0.694), 2 (P = 0.232), 3 (P = 0.04), 4 (P = 0.121), 5 (P = 0.006), 6 (P = 3.11 × 10−4), 7 (P = 0.008), 8 (P = 0.004), 9 (P = 0.004), 10 (P = 0.011), 11 (P = 4.4 × 10−4), 12 (P = 6.3 × 10−5), 13 (P = 0.237), 14 (P = 0.442), 15 (P = 0.6), 16 (P = 0.657), 17 (P = 0.6), 18 (P = 0.6). P values in (n): 1 (P= 0.009), 2 (P = 0.091), 3 (P = 0.104). P values in (o): 1 (P = 0.281), 2 (P = 0.0005), 3 (P = 0.006). n = number of embryos. Scale bars 5 µm. Source data are provided as a Source Data file.
Fig. 3
Fig. 3. 5HT2A amplifies Toll/Cirl polarity cue.
a Schematic showing Toll/Cirl mutual attraction recruiting MyoII at the cell-cell interface. bd 5HT2A overexpression and Toll-2,6,8 knockdown. b MyoII images in different conditions (from left to right respectively): water injected WT, water injected 5HT2A + +, Toll 2,6,8 RNAi injected WT, and Toll 2,6,8 RNAi injected 5HT2A + + embryos. Quantification of MyoII intensities in DV and AP oriented junctions over-time (c), amplitude of polarity (d) in different conditions. e, f Genetic interaction between Cirl and 5HT2A. e MyoII snapshots in different conditions (from left to right respectively): control, Cirl−/−, 5HT2A−/−, Cirl−/+ 5HT2A−/+, Cirl-/+ 5HT2A−/− and Cirl−/− 5HT2A−/+. f Quantification of junctional MyoII intensities in different genotypes. g Quantification of local tissue extension. Representative images are average projection of Sqh::mCherry. The centroid of the cells outlined in dark was tracked every 5 min for 15 min starting 30 min after the cellularization front passed the nucleus, pink dotted lines are the track of the centroids. The relative length (L-L0)/L0 is plotted at the bottom. Center dashed line is mean and error bands are standard deviation. Statistical significance was calculated by two-tailed Mann–Whitney U test at 15 min (ns P > 0.05, *P ≤ 0.05, ***P ≤ 0.0005). hk 5HT2A overexpression in Cirl-/- showing that ectopic 5HT2A rescues MyoII levels in Cirl−/−. h MyoII images at different time points (left to right) in different genotypes (top to bottom): control (top panel), Cirl−/− (middle panel) and Cirl-/- 5HT2A + + (bottom panel). Quantification of time traces of MyoII intensities in DV and AP oriented junctions (i), amplitude of polarity (j), and medial MyoII intensities (k) in different genotypes. In the box plots in (c, d, f, i, j, k), the line in the middle is plotted at the median. The box extends from the 25th to 75th percentiles. The whiskers indicate minimum and maximum values. Statistics: ns P > 0.05, *P ≤ 0.05, **P ≤ 0.005, ***P ≤ 0.0005, ****P ≤ 0.00005 from two-tailed Mann–Whitney test. P values in (c): 1 (P = 0.635), 2 (P = 0.368), 3 (P = 0.031), 4 (P = 0.022), 5 (P = 0.011), 6 (P = 0.005), 7 (P = 0.0007), 8 (P = 0.0004), 9 (P = 0.005), 10 (P = 0.002), 11 (P = 0.93), 12 (P = 0.479), 13 (P = 0.669), 14 (P = 0.536), 15 (P = 0.475), 16 (P = 0.256), 17 (P = 0.126), 18 (P = 0.364), 19 (P = 0.417), 20 (P = 0.536). P values in (d): 1 (P = 0.098), 2 (P = 0.015), 3 (P = 0.007), 4 (P = 0.073), 5 (P = 0.031), 6 (P = 0.009), 7 (P = 0.004), 8 (P = 0.026), 9 (P = 0.026), 10 (P = 0.002), 11 (P = 0.015), 12 (P = 0.051), 13 (P = 0.035), 14 (P = 0.101), 15 (P = 0.073), 16 (P = 0.001), 17 (P = 0.004), 18 (P = 0.002), 19 (P = 0.002), 20 (P = 0.0002), 21 (P = 0.818), 22 (P = 0.628), 23 (P = 0.534), 24 (P = 0.445), 25 (P = 0.181). P values in (f): 1 (P = 0.012), 2 (P = 0.0004), 3 (P = 0.008), 4 (P = 0.088), 5 (P = 0.036), 6 (P = 0.088), 7 (P = 4.1 × 10−5), 8 (P = 1.65 × 10−4), 9 (P = 8.2 × 10−5), 10 (P = 2.88 × 10−4), 11 (P = 4.94 × 10−4), 12 (P = 4.94 × 10−4), 13 (P = 8.2 × 10−5), 14 (P = 8.2 × 10−5), 15 (P = 8.2 × 10−5), 16 (P = 1.65 × 10−4), 17 (P = 3.29 × 10−4), 18 (P = 8.2 × 10−5). P values in (i): 1 (P = 0.002), 2 (P = 0.01), 3 (P = 6.22 × 10−4), 4 (P = 0.005), 5 (P = 0.002), 6 (P = 0.003), 7 (P = 0.001), 8 (P = 0.005), 9 (P = 0.442), 10 (P = 0.505), 11 (P = 0.235), 12 (P = 0.2), 13 (P = 0.021), 14 (P = 0.021), 15 (P = 0.003), 16 (P = 0.05), 17 (P = 0.005), 18 (P = 0.002), 19 (P = 0.005), 20 (P = 0.002), 21 (P = 0.574), 22 (P = 0.442), 23 (P = 0.234), 24 (P = 0.195). P values in (j): 1 (P = 0.021), 2 (P = 0.021), 3 (P = 0.328), 4 (P = 0.13), 5 (P = 0.328), 6 (P = >0.999), 7 (P = 0.798), 8 (P = 0.878), 9 (P = 0.959), 10 (P = 0.005), 11 (P = 0.234), 12 (P = 0.105). P values in (k): 1 (P = 3.11 × 10−4), 2 (P = 1.55 × 10−4), 3 (P = 1.55 × 10−4), 4 (P = 1.55 × 10−4), 5 (P = 0.002), 6 (P = 0.001), 7 (P = 0.002), 8 (P = 0.001), 9 (P = 0.083), 10 (P = 0.028), 11 (P = 0.105), 12 (P = 0.234). n = number of embryos. Scale bars 5 µm. Source data are provided as a Source Data file.
Fig. 4
Fig. 4. 5HT2A activates junctional MyoII through Gβ13f/Gγ1, Dp114RhoGEF and Rho1.
a Schematic showing GPCR signaling modules that activate junctional and medial Rho1/MyoII. be Rho1 activity in 5HT2A loss-of-function (5HT2A−/−). Rho1-GTP snapshots in control (left panel) and 5HT2A−/− (right panel) (b). Quantification of Rho-GTP sensor signal over-time in DV and AP oriented junctions (c), medial-apically (d), and amplitude of polarity (e) in different conditions. fh Rho1 activity in 5HT2A overexpression (5HT2A + +). Images of Rho1-GTP at different time points (left to right) and different genotypes (top to bottom): control (top panel), 5HT2A + + (bottom panel) (f). Quantification of Rho1-GTP sensor signal in DV and AP oriented junctions (g), and amplitude of polarity (h) over-time. il Dp114RhoGEF levels in 5HT2A loss and gain-of-function. Snapshot of endogenous distribution of Dp114RhoGEF::mNeonGreen in control (left panel) and 5HT2A−/− (right panel) (i); and quantification of signal in the respective genotypes (j). Snapshots of sqh-Dp114RhoGEF::GFP in control (left panel), and 5HT2A + +(right panel) (k); and quantification of the junctional signals (l) in the respective genotypes. mo MyoII distribution in 5HT2A overexpression and Dp114RhoGEF knockdown (Dp114RhoGEF-KD). Still images of MyoII in control (left), Dp114RhoGEF-KD (middle), and 5HT2A + + Dp114RhoGEF-KD (right) (m). Quantification of junctional MyoII intensities (n) and amplitude of polarity (o) for the above genotypes. p, q Gβ13f/Gγ1 overexpression (Gβ13f/Gγ1 + +) in 5HT2A−/−. MyoII images in control (top-left), Gβ13f/Gγ1 + + (top-right), 5HT2A−/− (bottom-left) and 5HT2A-/- Gβ13f/Gγ1 + + (bottom-right) (p). Quantification of junctional MyoII in different genotypes (q). In the box plots in (c, d, e, g, h, j, l, n, o, q) the line in the middle is plotted at the median. The box extends from the 25th to 75th percentiles. The whiskers indicate minimum and maximum values. Statistics: ns P > 0.05, *P ≤ 0.05, **P ≤ 0.005, ***P ≤ 0.0005 from two-tailed Mann–Whitney test. P values in (c): 1 (P = 0.026), 2 (P = 5.83 × 10−4), 3 (P = 5.83 × 10−4), 4 (P = 5.83 × 10−4), 5 (P = 0.038), 6 (P = 5.83 × 10−4), 7 (P = 5.83 × 10−4), 8 (P = 5.83 × 10−4). P values in (d): 1 (P = 5.83 × 10−4), 2 (P = 0.001), 3 (P = 5.83 × 10−4), 4 (P = 5.83 × 10−4). P values in (e): 1 (P = 0.259), 2 (P = 0.456), 3 (P = 0.097), 4 (P = 0.456). P values in (g): 1 (P = 0.129), 2 (P = 0.492), 3 (P = 0.007), 4 (P = 5.3 × 10−5), 5 (P = 0.84), 6 (P = 0.206), 7 (P = 0.152), 8 (P = 1.06 × 10−4). P values in (h): 1 (P = 0.968), 2 (P = 0.351), 3 (P = 0.442), 4 (P = 0.272). P values in (j): 1 (P = 0.02), 2 (P = 0.152), 3 (P = 0.003), 4 (P = 0.001), 5 (P = 0.001), 6 (P = 1.08 × 10−4). P values in (l): 1 (P = 0.004), 2 (P = 0.008), 3 (P = 0.004), 4 (P = 0.003), 5 (P = 0.126), 6 (P = 0.008). P values in (n): 1 (P = 0.005), 2 (P = 0.018), 3 (P = 0.018), 4 (P = 0.005), 5 (P = 0.005), 6 (P = 0.003), 7 (P = 0.004), 8 (P = 0.004), 9 (P = 0.009), 10 (P = 0.004), 11 (P = 0.009), 12 (P = 0.004). P values in (o): 1 (P = 0.003), 2 (P = 0.004), 3 (P = 0.945). P values in (q): 1 (P = 7.99 × 10−4), 2 (P = 0.018), 3 (P = 0.008), 4 (P = 0.008), 5 (P = 0.036), 6 (P = 0.005), 7 (P = 0.836), 8 (P = 0.181), 9 (P = 0.138), 10 (P = 0.295), 11 (P = 0.295), 12 (P = 0.005), 13 (P = 0.022), 14 (P = 0.056), 15 (P = 0.635), 16 (P = 0.313), 17 (P = 0.147), 18 (P = 0.635), 19 (P = 0.002), 20 (P = 0.002), 21 (P = 0.033), 22 (P = 0.033), 23 (P = 0.025), 24 (P = 0.001). n = number of embryos. Scale bars 5 µm. Source data are provided as a Source Data file.
Fig. 5
Fig. 5. 5HT2B represses MyoII accumulation in the ectoderm and requires 5HT2A.
ad MyoII distribution in 5HT2B knockdown by RNAi (5HT2B dsRNA) injection. Images of MyoII for different time points (left to right); in water injected control (top panels) and 5HT2B dsRNA injection (bottom panels) (a). Quantification of time-traces of MyoII in DV and AP oriented junctions (b), medial MyoII (c), and amplitude of polarity (d). e Schematic depicting two possible interactions between 5HT2A and 5HT2B. fh Genetic interaction between 5HT2A and 5HT2B by knocking down 5HT2B in 5HT2A−/−. MyoII images for water injected control (top-left), 5HT2B dsRNA (top-right), water injected 5HT2A−/− (bottom-left) and 5HT2A−/− injected with 5HT2B dsRNA (bottom-right) (f). Quantification of junctional (g), and medial (h) MyoII intensities for different conditions. i Schematic showing the 5HT2B inhibition of 5HT2A as supported by the genetic interaction above. jp Scanning FCCS (sFCCS) of 5HT2A and 5HT2B. j Confocal microscopy images of cells co-expressing 5HT2A::mNeonGreen and 5HT2B::mCherry. sFCCS measurements were performed perpendicular to the plasma membrane, as shown (orange line). k Schematic of sFCCS. Line scans acquired sequentially in line interleaved excitation mode were aligned computationally to correct for lateral cell or tissue movement. Membrane pixels were identified and integrated to provide membrane fluorescence time series in each channel. Autocorrelation functions (ACFs, green/magenta) in each channel and the cross-correlation function (CCF, blue) between two channels were calculated (see ‘Methods’ for details). l Representative correlation functions obtained in a negative control sample consisting of a line co-expressing VsVg::mNeonGreen and 5HT2B::mCherry (left) and in cells co-expressing the two receptors 5HT2A::mNeonGreen and 5HT2B::mCherry (2A/2B) (right). Green= ACF of the mNeonGreen channel, magenta=ACF of the mCherry channel and blue=CCF. In the negative control, the CCF (blue) fluctuates around zero, indicating absence of co-diffusion and hence hetero-interactions. In the 2A/2B sample, a positive CCF (blue) is obtained, indicating a co-diffusing species, i.e., the presence of heterocomplexes. n = number of independent measurements (number of cell-cell interfaces scanned) from 6 negative control embryos and 7 embryos co-expressing 5HT2A::mNeonGreen and 5HT2B::mCherry. Each embryo was considered as an independent experiment. m Quantification of the relative cross-correlation in negative control and 5HT2A::mNeonGreen and 5HT2B::mCherry (2A/2B) co-expressing embryos. Statistical significance was assessed by (two-tailed) Mann–Whitney test (***P ≤ 0.0005). n Quantification of surface concentration of 5HT2A::mNeonGreen and 5HT2B::mCherry. o Quantification of diffusion coefficient in different conditions. p Schematic showing the interaction between 5HT2A and 5HT2B. In the violin plot in (mo), the thick line in the middle is the median, the dotted lines are the interquartile range. In the box plots in (bd, g, h) the line in the middle is plotted at the median. The box extends from the 25th to 75th percentiles. The whiskers indicate minimum and maximum values. Statistics: ns P > 0.05, *P ≤ 0.05, **P ≤ 0.005, ***P ≤ 0.0005 from two-tailed Mann–Whitney test. P values in (b): 1 (P = 0.006), 2 (P = 0.006), 3 (P = 3.23 × 10−4), 4 (P = 0.001), 5 (P = 0.009), 6 (P = 0.002). P values in (c): 1 (P = 4.31 × 10−4), 2 (P = 0.024), 3 (P = 7.5 × 10−4). P values in (d): 1 (P = 0.384), 2 (P = 0.892), 3 (P = 0.291). P values in (g): 1 (P = 0.001), 2 (P = 0.019), 3 (P = 0.279), 4 (P = 0.037), 5 (P = 0.019), 6 (P = 0.019), 7 (P = 0.008), 8 (P = 0.008), 9 (P = 0.008), 10 (P = 0.008), 11 (P = 0.056), 12 (P = 0.016), 13 (P = 0.016), 14 (P = 0.016), 15 (P = 0.016), 16 (P = 0.111), 17 (P = 0.286), 18 (P = 0.111), 19 (P = 0.001), 20 (P = 0.001), 21 (P = 0.001), 22 (P = 0.004), 23 (P = 0.008), 24 (P = 0.001), 25 (P = 0.905), 26 (P > 0.999), 27 (P = 0.905), 28 (P = 0.905), 29 (P = 0.905), 30 (P > 0.999). P values in (h): 1 (P = 0.001), 2 (P = 0.008), 3 (P = 0.016), 4 (P = 0.001), 5 (P = 0.73). n = number of embryos. For sFCCS, n = number of independent measurements. Scale bars 5 µm. Source data are provided as a Source Data file.
Fig. 6
Fig. 6. Effect of serotonin receptor inhibition on tissue flows and myosin activity during chick gastrulation.
a Schematic of the gastrulating chick embryo. b Representative images of phospho-MyoII in the embryo-proper (EP), contractile region (top panels) and extra-embryonic tissue (EE), area opaca (bottom panels) in the DMSO treated control (left), 20 µM (middle) and 200 µM (right) Ritanserin treated embryos. The white box in the images is magnified in the panels above each condition. The orange arrowheads indicate supracellular MyoII cables along the aligned cell junctions. The scale bar in the bottom left panel is 50 µm, in the inset 20 µm. c Snapshot of the brightfield images taken from the Video 18 at T0 + 5 h (left) and T0 + 13 h (right). Control treated with DMSO (top panels) and Ritanserin 200 µM (bottom panels). The scale bar is 500 µm. d Particle Image Velocimetry (PIV) images of the embryos in Video 18 at T0 + 5 h (left) and T0 + 13 h (right). The AP arrow in (c, d) indicates the direction of anterior posterior axis. The pink dotted line in c is the boundary of the tissue flow traced from the PIV image of the corresponding time in (d). Images in (b, c) are representative of at least three embryos per condition, experiments were replicated at least three times.

References

    1. Buznikov GA. The action of neurotransmitters and related substances on early embryogenesis. Pharmacol. Ther. 1984;25:23–59. doi: 10.1016/0163-7258(84)90023-8. - DOI - PubMed
    1. Buznikov GA, Chudakova IV, Zvezdina ND. The r ole of neurohumours in early embryogenesis. i. serotonin content of developing embryos of sea urchin and loach. J. Embryol. Exp. Morphol. 1964;12:563–573. - PubMed
    1. Csaba G. Presence in and effects of pineal indoleamines at very low level of phylogeny. Experientia. 1993;49:627–634. doi: 10.1007/BF01923943. - DOI - PubMed
    1. Essman EJ. The serotonergic system in Tetrahymena pyriformis. La Ricerca in clinica e in laboratorio. 1987;17:77–82. doi: 10.1007/BF02909392. - DOI - PubMed
    1. Csaba G, Kovács P, Pállinger E. How does the unicellular Tetrahymena utilise the hormones that it produces? Paying a visit to the realm of atto-and zeptomolar concentrations. Cell Tissue Res. 2007;327:199–203. doi: 10.1007/s00441-005-0052-9. - DOI - PubMed

Publication types

LinkOut - more resources