. 2023 Sep 8;14(1):5522.
doi: 10.1038/s41467-023-41078-z.

Training-induced circuit-specific excitatory synaptogenesis in mice is required for effort control

Affiliations

Training-induced circuit-specific excitatory synaptogenesis in mice is required for effort control

Francesco Paolo Ulloa Severino et al. Nat Commun. .

Abstract

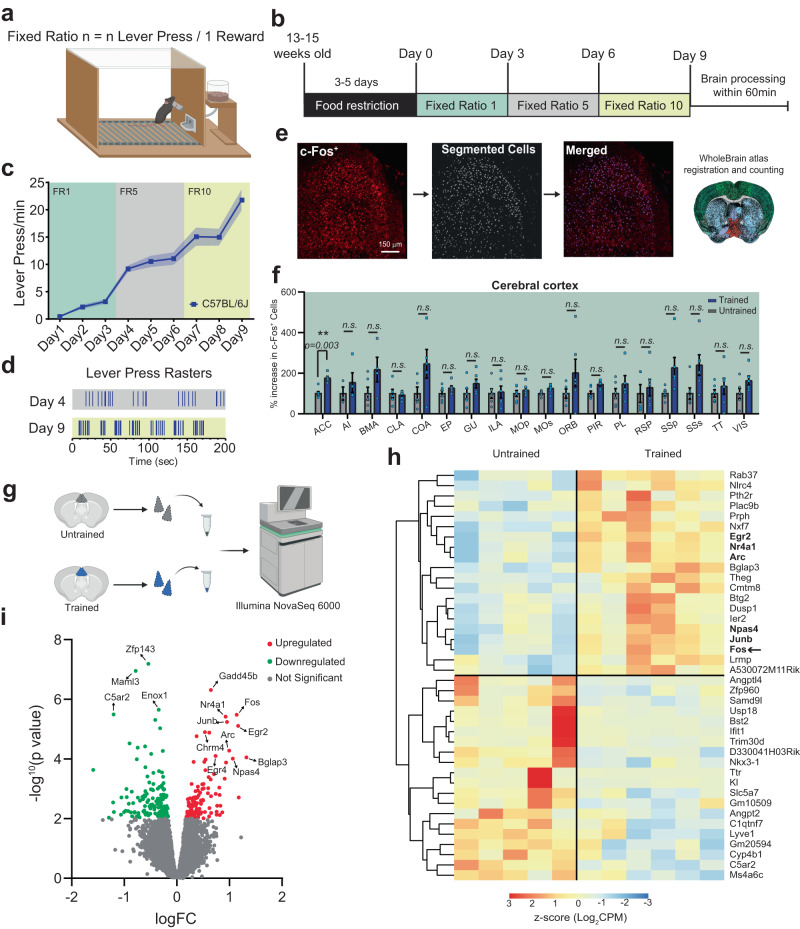
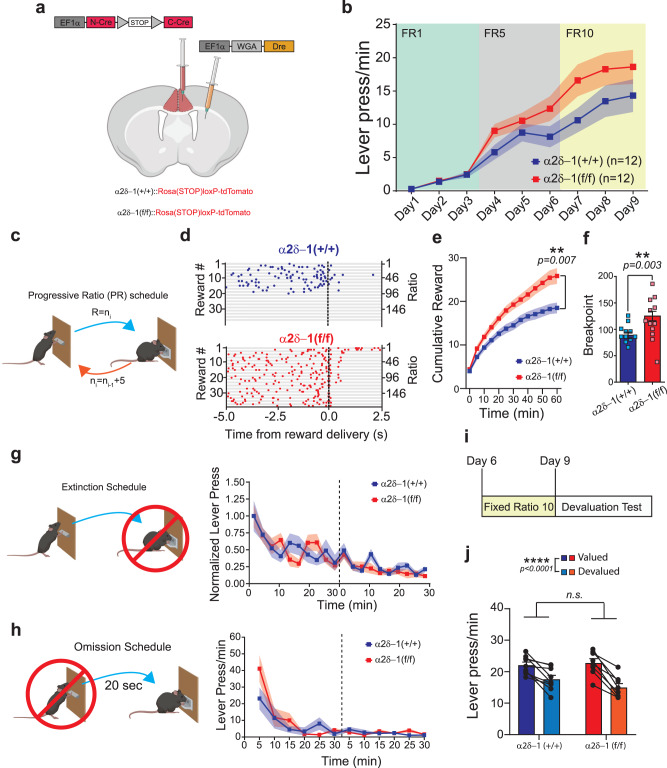
Synaptogenesis is essential for circuit development; however, it is unknown whether it is critical for the establishment and performance of goal-directed voluntary behaviors. Here, we show that operant conditioning via lever-press for food reward training in mice induces excitatory synapse formation onto a subset of anterior cingulate cortex neurons projecting to the dorsomedial striatum (ACC→DMS). Training-induced synaptogenesis is controlled by the Gabapentin/Thrombospondin receptor α2δ-1, which is an essential neuronal protein for proper intracortical excitatory synaptogenesis. Using germline and conditional knockout mice, we found that deletion of α2δ-1 in the adult ACC→DMS circuit diminishes training-induced excitatory synaptogenesis. Surprisingly, this manipulation does not impact learning but results in a significant increase in effort exertion without affecting sensitivity to reward value or changing contingencies. Bidirectional optogenetic manipulation of ACC→DMS neurons rescues or phenocopies the behaviors of the α2δ-1 cKO mice, highlighting the importance of synaptogenesis within this cortico-striatal circuit in regulating effort exertion.


Conflict of interest statement

The authors declare no competing interests.

Figures

Fig. 1
Fig. 1. Action sequence engages the anterior cingulate cortex during instrumental actions.
a Representation of the Skinner box used for training and testing mice on a lever-press-for-food reinforcer test. b Schematic of the fixed ratio schedules used for the operant training and testing. c Lever press (LP) rate for trained C57BL/6J mice (n = 17 mice, 8 males, and 9 females) across the 9 days of training. d Representative lever press raster plots for FR5 day 4 and FR10 day 9 of LP performance. e Flow chart and example images of the c-Fos+ cell segmentation and quantification. f Bar plot of c-Fos+ cells for the cerebral cortex regions. g Schematic representation of the ACC microdissection procedure used for the bulk RNA-seq. h Heat map of the top 20 differentially expressed genes (DEG). Bolded genes are the IEGs overexpressed in Trained mice. i Volcano plot organized based on logarithmic fold change (logFC) and P value (−log10P value). Arrows signify genes of interest. Source data are provided as a Source Data file. Drawings in (a, g) are created with BioRender.com.
Fig. 2
Fig. 2. A high ratio schedule induces excitatory synaptogenesis in the Anterior Cingulate Cortex.
a Example images of the segmented c-Fos+ cells across the layers of the ACC in untrained and trained groups. b Layer-specific quantification of the c-Fos+ cells in the dorsal and ventral ACC in trained and untrained C57BL/6J mice. c Representation of the specific cortical layers in which synaptic analysis was performed for VGlut1 and VGAT synapses (created with BioRender.com). d Representative images from Untrained and Trained mice stained with VGluT1 and PSD95 antibodies. The arrows indicate co-localized puncta. e Quantification of VGluT1/PSD95 co-localized puncta density in the ACC and DMS. f Schematic representation of the viral injections to label ACC→DMS neurons (created with BioRender.com). g Tile scan image of a coronal brain section from a C57BL/6J tdTomato+ mouse. Insets show a magnification of the ACC (i) and DMS (ii). h Schematic representation of mEPSC recording from ACC→DMS neurons and representative traces. i Cumulative distribution and bar plots of inter-event interval. j Cumulative distribution, and bar plots of amplitude. Source data are provided as a Source Data file.
Fig. 3
Fig. 3. VGlut1-PSD95 synapse formation in the anterior cingulate cortex is regulated by the thrombospondin receptor α2δ−1.
a Breeding scheme for the generation of α2δ−1 WT and KO mice (created with BioRender.com). b Representative images of VGluT1/PSD95 staining in the ACC of α2δ−1 WT and KO mice. The arrows in the merged channel indicate co-localized puncta. c Comparison between untrained α2δ−1 WT and KO mice. d Layer-specific comparison of untrained and trained α2δ−1 KO in the ventral ACC. e Example image of the segmented c-Fos+ cells across the layers of the ACC of a trained α2δ−1 KO mouse. f Quantification of the c-Fos+ cells in untrained and trained α2δ−1 KO mice compared to WT. Source data are provided as a Source Data file.
Fig. 4
Fig. 4. Constitutive lack of α2δ−1 increases effort exertion without affecting the learning of instrumental actions.
a Schematic representation of the fixed ratio and PR schedule used for the α2δ−1 WT and KO mice. b Lever press (LP) rate for the 9 days on the FR schedule for α2δ−1 WT (n = 27 mice; 14 male and 13 female) and KO (n = 20 mice; 10 male and 10 female). c Schematic representation of the progressive ratio (PR) schedule. The value (n) of the ratio (R) increment of 5 for every received reward (i), starting with R = 1. d Representative peri-reward raster histograms of LP for α2δ−1 WT and KO mice. e Cumulative reward count over the PR session (bin=5 min) for α2δ−1 WT (n = 22; 17.2 ± 0.8 rewards) and KO (n = 19; 20.2 ± 0.6 rewards) animals. f Breakpoint for α2δ−1 WT (n = 22; Breakpoint = 79.1 ± 3.8 and KO (n = 19; Breakpoint = 99.9 ± 2.6). g Schematic representation of the extinction schedule in which the action is not reinforced. α2δ−1 WT (n = 22) and KO (n = 19). The normalized number of lever press is reported for the 2 days of testing (dashed line). h Schematic representation of the omission schedule in which the reinforcer is delayed by each press. α2δ−1 WT (n = 17) and KO (n = 8). The lever press/min are reported for the 2 days of testing (dashed line). i Schematic representation of the devaluation test schedule. j Lever press/min in valued and devalued states after pre-feeding for α2δ−1 WT and KO mice. Source data are provided as a Source Data file. Drawings (c, gh) are created with BioRender.com.
Fig. 5
Fig. 5. Conditional deletion of α2δ−1 from ACC→DMS neurons increases effort exertion without affecting the learning of instrumental actions.
a Schematic representation of the injection strategy to conditionally knock out α2δ−1. b Lever press rate for the 9 days on the FR schedule for α2δ−1 (+/+) and α2δ−1(f/f) mice. c Schematic representation of the progressive ratio (PR) schedule. The value (n) of the ratio (R) increment of 5 for every received reward (i), starting with R = 1. d Representative peri-reward raster histograms of LP for both groups. e Cumulative reward count over the PR session for α2δ−1 (+/+) and α2δ−1(f/f) animals. f Breakpoint for α2δ−1(+/+) and α2δ−1(f/f) animals. g Left: Schematic representation of the Extinction schedule in which the action is not reinforced. Right: Normalized lever press number in a 3 min bins for α2δ−1 (+/+) and α2δ−1(f/f) animals. h Left: Schematic representation of the omission schedule in which the reinforcer is delayed by each press. Right: The lever press/min are reported for the 2 days of testing (dashed line). i Schematic representation of the devaluation test schedule. j Lever press/min in valued and devalued states after pre-feeding. Source data are provided as a Source Data file. Drawings in (a, c, g, h) are created with BioRender.com.
Fig. 6
Fig. 6. Circuit-specific conditional deletion of α2δ−1 reduces the excitatory synapses number onto the ACC→DMS neurons.
a Schematic representation of the electrophysiological recordings from ACC→DMS tdTomato+ neurons in both α2δ−1(+/+) and α2δ−1(f/f) mice. b Example traces of the intrinsic excitability. c Action potential (AP) frequency as function of the injected current. d Average resting membrane potential. e Left: Schematic representation of the tdTomato+ neurons used to quantify the VGluT1-PSD95 synapses (created with BioRender.com). Right: Representative images. White arrows point at the puncta within the tdTomato mask. f Quantification of synaptic density between conditions. g Example traces from mEPSC recordings. h Left: Cumulative distribution of the Inter-event interval. Right: Average frequency of mEPSCs. i Left: Cumulative distribution of amplitude in pA. Right: Average amplitude. j Representative traces from mEPSC recordings from untrained and trained α2δ−1(f/f) mice. k Left: Cumulative distribution of the Inter-event interval. Right: Average frequency. l Left: Cumulative distribution of amplitude. Right: Average amplitude. Source data are provided as a Source Data file.
Fig. 7
Fig. 7. Optogenetic excitation of ACC→DMS neurons inhibits the lever press behavior.
a Schematic representation of the viral injections and fiber implants for the optogenetic rescue experiments in the ACC→DMS projecting neurons of α2δ−1(+/+) and α2δ−1(f/f) mice. b Schematic representation of the FR20 schedule used for the optogenetic experiments with 5 min Off and On schedule. c Representative peri-reward raster histograms of an α2δ−1(+/+) and an α2δ−1(f/f) mouse during the light-Off and light-On periods. d Lever press/min for the α2δ−1(+/+) mice (n = 8) and α2δ−1(f/f) mice (n = 11). Paired two-tailed t test for α2δ−1(+/+) light-Off (27 ± 2.9) and light-On (20 ± 2.6) [t (7) = 6.9; P = 0.0006] and for α2δ−1(f/f) light-Off (42 ± 3.8) and light-On (32 ± 3.8) [t (10) = 6.7]. e Modulation index for CTRL, α2δ−1 (+/+), and α2δ−1 (f/f) mice. One-way ANOVA [F (2, 20) = 16.27, P < 0.001], Tukey’s multiple comparisons revealed a significant difference between CTRL and α2δ−1 (+/+) [q (20) = 7.3; P = 0.0001] and between CTRL and α2δ−1 (f/f) [q (20) = 7.0; P = 0.0002] and no differences between α2δ−1 (+/+) and α2δ−1 (f/f) [q (20) = 0.56, P = 0.916; P = 0.916]. For all graphs: data showed as mean ± s.e.m. alpha = 0.05. Source data are provided as a Source Data file. Drawings in (ac) are created with BioRender.com.
Fig. 8
Fig. 8. Inhibition and excitation of ACC→DMS neurons have opposite effects on the performance of lever press bout and effort exertion.
a Left: Schematic representation of viral injections for the BLINK2 and behavioral schedule used for inhibitory experiments and Right: Example image of BLINK2 expression within ACC→DMS neurons. b Lever press/min of the entire PR test for BLINK2 mice showing the effect of BLINK2 inhibition for the first 10 min upon stimulation. n = 10 mice. c Quantification of behavioral parameters during the first 10 min of PR for no stimulation (NoStim) and stimulation (Stim) conditions. Lever press/min during NoStim (18 ± 3.8) and Stim (30 ± 4.5) days of PR. d, Cumulative reward count during NoStim and Stim days of PR. e Breakpoint between NoStim (37 ± 4.0) and Stim (49 ± 4.4) days. f Left: Injection strategy for ChR2 expression and the protocol used for optogenetic experiments using ChR2 during PR schedule. Right: Example image of ChR2 expression in ACC→DMS neurons. g Quantification of behavioral parameters during the first 10 min of PR for NoStim and Stim conditions. Lever press/min during NoStim (41 ± 4.4) and Stim (26 ± 2.4) days of PR. h Cumulative reward count during NoStim and Stim days of PR. i Breakpoint between NoStim (77 ± 5.2) and Stim (67 ± 3.8) days. j Modulation index of BLINK2 (0.26 ± 0.07; n = 10) and ChR2 (−0.22 ± 0.05; n = 7) mice during the PR schedule. k Left: Proposed intrinsic mechanism of regulation of effort exertion through training-induced excitatory synaptogenesis. Right: Representation of how optogenetic manipulation of ACC→DMS neurons would affect the effort exertion. Source data are provided as a Source Data file. Drawings in (a, f, k) are created with BioRender.com.

References

    1. Yin HH, Knowlton BJ. The role of the basal ganglia in habit formation. Nat. Rev. Neurosci. 2006;7:464–476. - PubMed
    1. Hartley SL, Sikora DM, McCoy R. Prevalence and risk factors of maladaptive behaviour in young children with autistic disorder. J. Intellect. Disabil. Res. JIDR. 2008;52:819–829. - PMC - PubMed
    1. Botvinick MM, Huffstetler S, McGuire JT. Effort discounting in human nucleus accumbens. Cogn. Affect. Behav. Neurosci. 2009;9:16–27. - PMC - PubMed
    1. Bayés À, et al. Characterization of the proteome, diseases and evolution of the human postsynaptic density. Nat. Neurosci. 2011;14:19–21. - PMC - PubMed
    1. Chih B, Engelman H, Scheiffele P. Control of excitatory and inhibitory synapse formation by neuroligins. Science. 2005;307:1324–1328. - PubMed

Publication types