. 2023 Sep 8;14(1):5536.
doi: 10.1038/s41467-023-41315-5.

Shared and distinct genetic etiologies for different types of clonal hematopoiesis

Affiliations

Shared and distinct genetic etiologies for different types of clonal hematopoiesis

Derek W Brown et al. Nat Commun. .

Abstract

Clonal hematopoiesis (CH)-age-related expansion of mutated hematopoietic clones-can differ in frequency and cellular fitness by CH type (e.g., mutations in driver genes (CHIP), gains/losses and copy-neutral loss of chromosomal segments (mCAs), and loss of sex chromosomes). Co-occurring CH raises questions as to their origin, selection, and impact. We integrate sequence and genotype array data in up to 482,378 UK Biobank participants to demonstrate shared genetic architecture across CH types. Our analysis suggests a cellular evolutionary trade-off between different types of CH, with LOY occurring at lower rates in individuals carrying mutations in established CHIP genes. We observed co-occurrence of CHIP and mCAs with overlap at TET2, DNMT3A, and JAK2, in which CHIP precedes mCA acquisition. Furthermore, individuals carrying overlapping CH had high risk of future lymphoid and myeloid malignancies. Finally, we leverage shared genetic architecture of CH traits to identify 15 novel loci associated with leukemia risk.


Conflict of interest statement

V.G.S. serves as an advisor to and/or has equity in Branch Biosciences, Ensoma, Novartis, Forma, and Cellarity, all unrelated to the present work. All other authors declare no relevant competing interests.

Figures
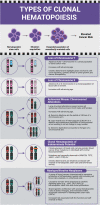
Fig. 1
Fig. 1. Description of each type of clonal hematopoiesis (CH).
The top panel depicts the acquisition and clonal expansion of a CH clone and its potential for elevated hematologic cancer risk. Lower panels illustrate loss of chromosome Y (LOY); loss of chromosome X (LOX); autosomal mosaic chromosomal alterations (mCAs) that include (A) genomic deletions, (B) copy neutral loss of heterozygosity (CNLOH), and (C) genomic duplications; clonal hematopoiesis of indeterminate potential (CHIP); and myeloproliferative neoplasms (MPN).
Fig. 2
Fig. 2. Pairwise genetic correlations between each type of clonal hematopoiesis, telomere length, and 19 blood cell traits derived using the high-definition likelihood (HDL) method.
Square areas represent the absolute value of genetic correlations. Blue, positive genetic correlation; red, negative genetic correlation. Genetic correlations that are significantly different from zero (p-value < 0.05) are marked with an asterisk. All pairwise genetic correlations and p-values are given in Supplementary Data 1.
Fig. 3
Fig. 3. Pairwise phenotypic associations between each type of clonal hematopoiesis, telomere length, and 19 blood cell traits.
Blue, positive T-statistic; red, negative T-statistic. T-statistics were derived using linear regression adjusted for age, age-squared, 25-level smoking status, and sex (in non LOY or LOX comparisons). Black cells were not tested. T-statistics that are significantly different from zero at a nominal p-value (p < 0.05) are marked with an asterisk and Bonferroni corrected p-value (p < 1.67 × 10−4) are marked with two asterisks. All pairwise T-statistics and p-values are given in Supplementary Data 4.
Fig. 4
Fig. 4. Shared etiologies and associations between types of clonal hematopoiesis (CH) and hematopoietic phenotypes: telomere length, and white blood cell count (WBC).
Pairwise high-definition likelihood (HDL) genetic correlations are given in the left plot, pairwise phenotypic associations derived using linear regression adjusted for age, age-squared, 25-level smoking status, and sex (in non-LOY or LOX comparisons) are given in the right plot. The black lines separate types of CH from each other and the color and width of the bands represent the strength of association. All genetic correlations are available in Supplementary Data 1 and 4.
Fig. 5
Fig. 5. Stacked Manhattan plots from the Multi-Trait Analysis of genome-wide association study (GWAS) summary statistics (MTAG) and colocalization analyses among telomere length, LOY, and MPN (Top plot) and the original MPN GWAS performed by Bao et al. (Bottom plot).
Nominated MPN susceptibility loci are labeled by analysis, MTAG(stars, ★), loss of chromosome Y (LOY) colocalization (circles, ●), TL colocalization (squares, ◼), and colored red for previously unidentified and black for previous identified. Supporting data for MTAG signals are defined in Supplementary Data 23 and data for colocalization analyses is available in Supplementary Data 24 and 25.

References

    1. Liggett LA, Sankaran VG. Unraveling hematopoiesis through the lens of genomics. Cell. 2020;182:1384–1400. - PMC - PubMed
    1. Martincorena I, et al. Tumor evolution. High burden and pervasive positive selection of somatic mutations in normal human skin. Science. 2015;348:880–886. - PMC - PubMed
    1. Jaiswal, S. & Ebert, B. L. Clonal hematopoiesis in human aging and disease. Science366 (2019). - PMC - PubMed
    1. Mustjoki S, Young NS. Somatic mutations in ‘benign’ disease. N. Engl. J. Med. 2021;384:2039–2052. - PubMed
    1. Martincorena I, et al. Somatic mutant clones colonize the human esophagus with age. Science. 2018;362:911–917. - PMC - PubMed

Publication types

Substances