. 2023 Sep 8;14(1):5546.
doi: 10.1038/s41467-023-41338-y.

Pre-clinical validation of a pan-cancer CAR-T cell immunotherapy targeting nfP2X7

Affiliations

Pre-clinical validation of a pan-cancer CAR-T cell immunotherapy targeting nfP2X7

Veronika Bandara et al. Nat Commun. .

Abstract

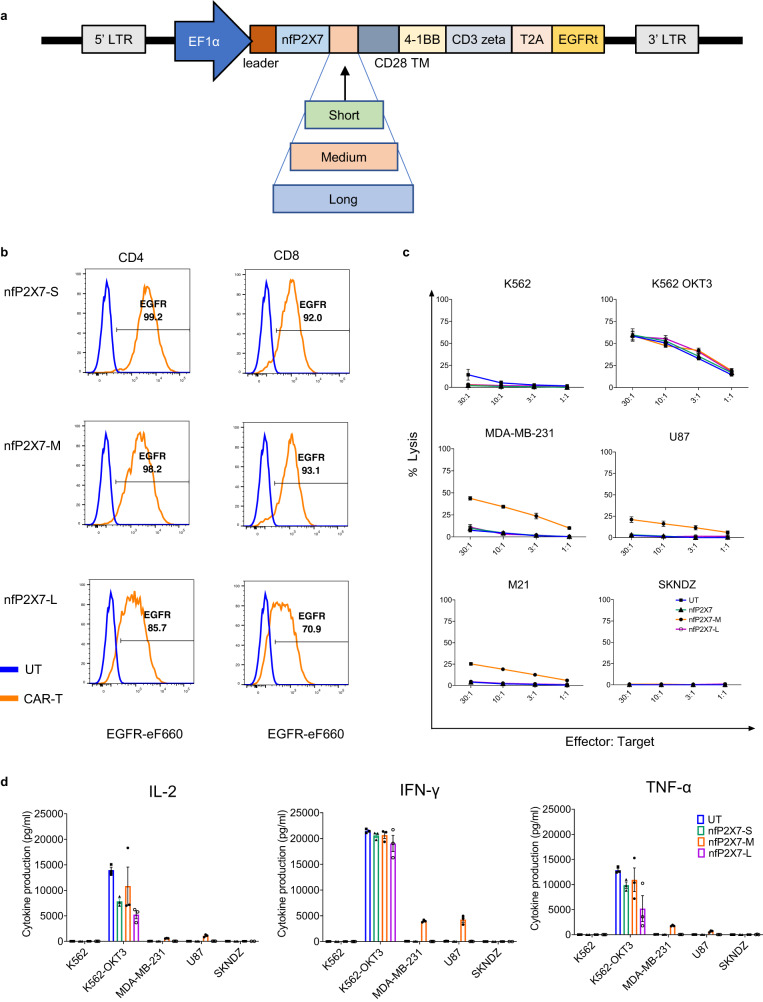
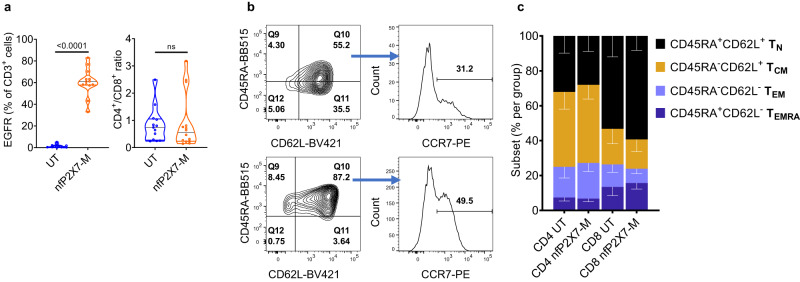
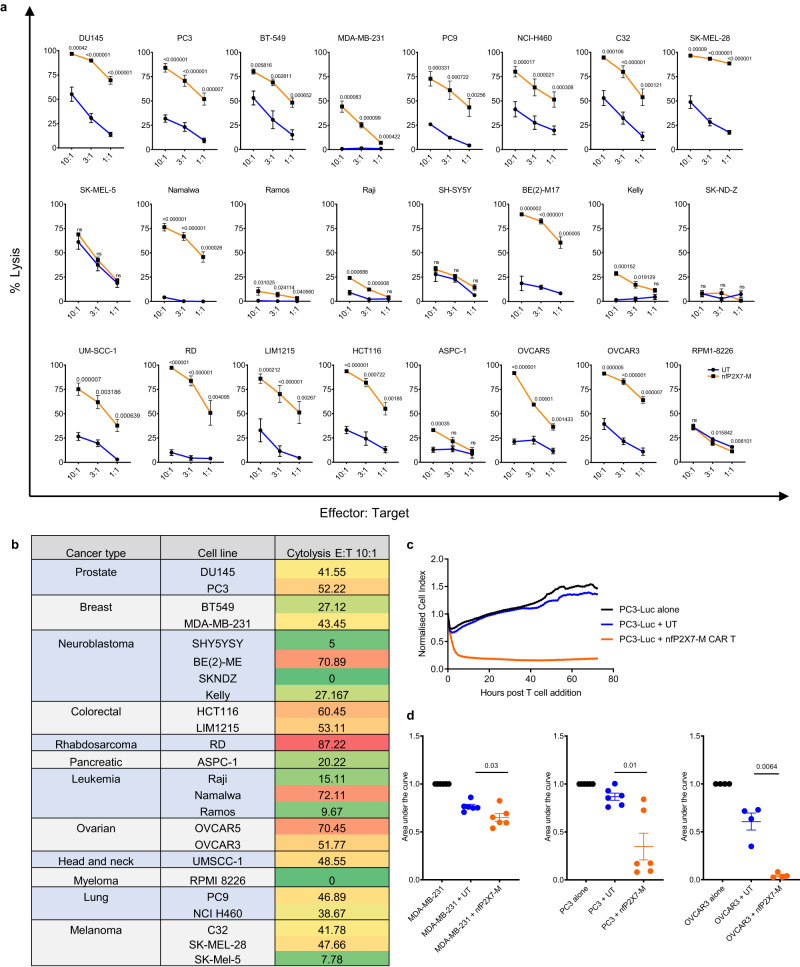
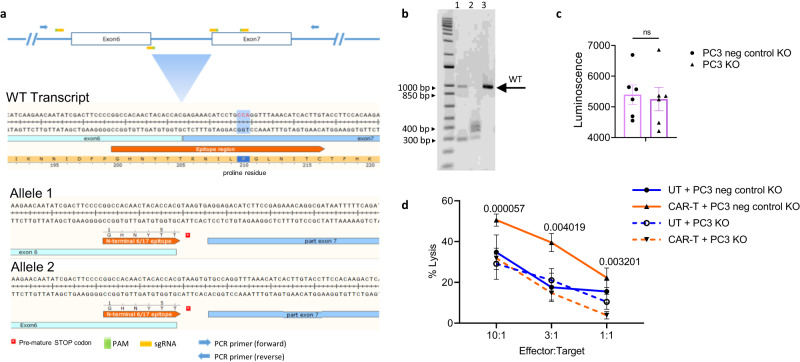
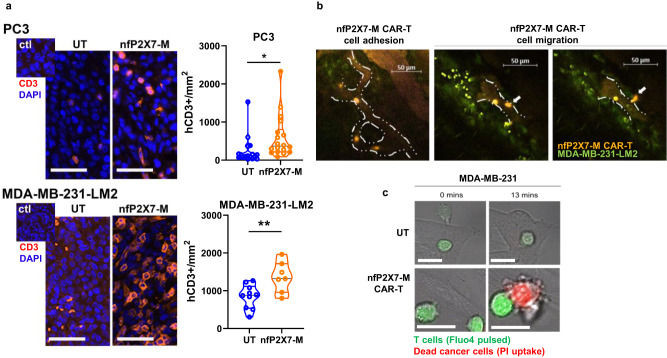
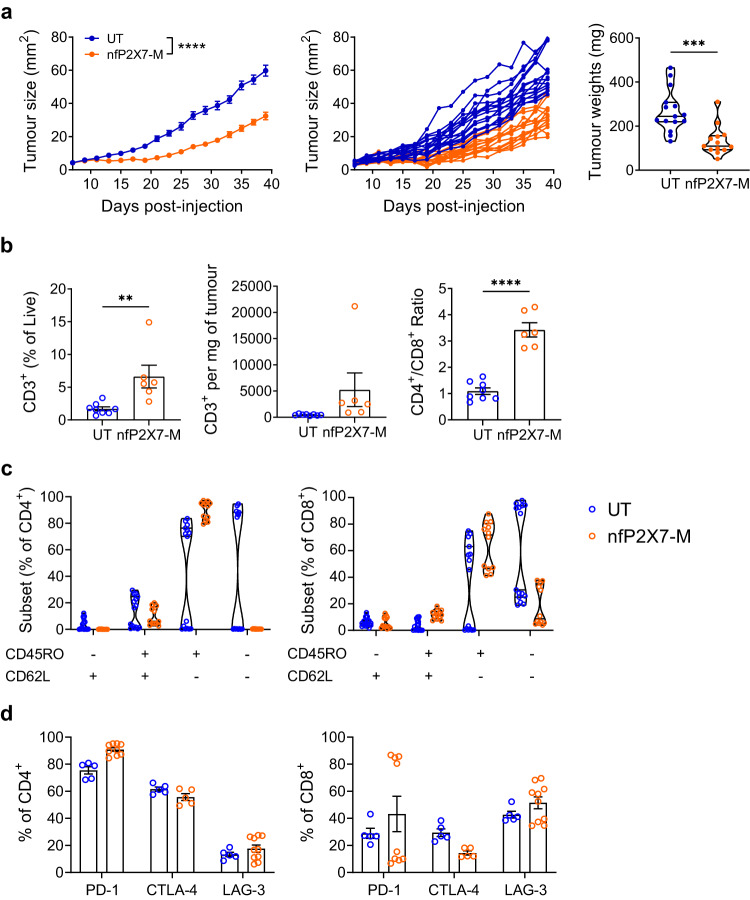
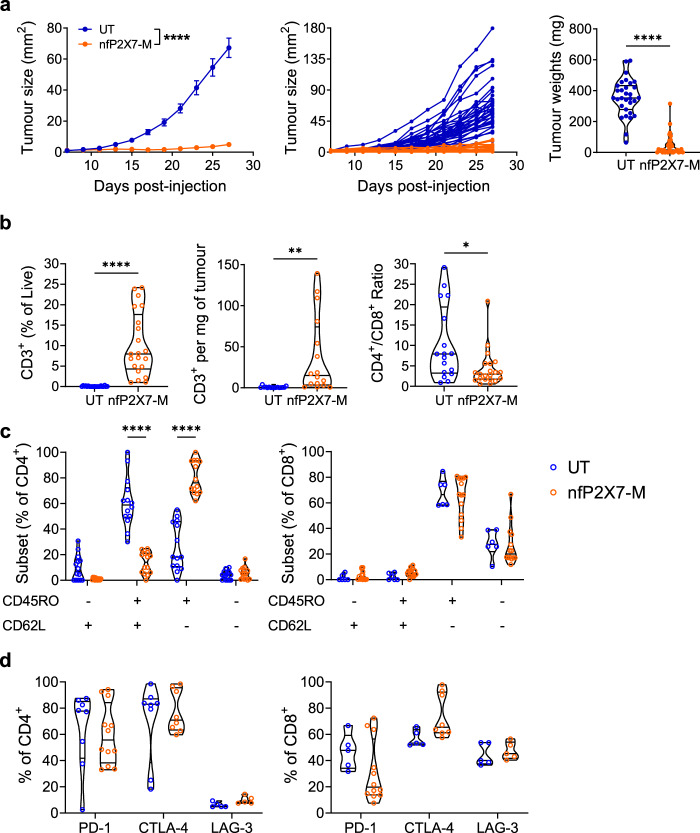
Chimeric antigen receptor (CAR)-T cell immunotherapy is a novel treatment that genetically modifies the patients' own T cells to target and kill malignant cells. However, identification of tumour-specific antigens expressed on multiple solid cancer types, remains a major challenge. P2X purinoceptor 7 (P2X7) is a cell surface expressed ATP gated cation channel, and a dysfunctional version of P2X7, named nfP2X7, has been identified on cancer cells from multiple tissues, while being undetectable on healthy cells. We present a prototype -human CAR-T construct targeting nfP2X7 showing potential antigen-specific cytotoxicity against twelve solid cancer types (breast, prostate, lung, colorectal, brain and skin). In xenograft mouse models of breast and prostate cancer, CAR-T cells targeting nfP2X7 exhibit robust anti-tumour efficacy. These data indicate that nfP2X7 is a suitable immunotherapy target because of its broad expression on human tumours. CAR-T cells targeting nfP2X7 have potential as a wide-spectrum cancer immunotherapy for solid tumours in humans.


Conflict of interest statement

S.C.B., S.R.M., C.R. and C.S.B. receive research funding from Carina Biotech Ltd. All other authors declare no competing interests.

Figures

Fig. 1
Fig. 1. Impact of the hinge length on cytotoxicity potential of nfP2X7-CAR-T cells.
a Schematic of the lentiviral vector construct with EF1α promoter followed by the leader sequence, nfP2X7 antigen binding domain, hinge region (short, medium or long), CD28 transmembrane domain, 41BB, CD3 zeta, T2A and EGFRt. b Flow cytometric analysis of CAR expression in CD4+/CD8+ compartments on the three different CAR-T cells (nfP2X7-S, nfP2X7-M and nfP2X7-L) by EGFR staining. c Specific cytotoxicity of target cells by CD8+ nfP2X7-CAR-T cells with three different hinge lengths (nfP2X7-S, nfP2X7-M and nfP2X7-L) compared with CD8+ untransduced (UT) cells. Target cell lines include: K562 (leukaemia), MDA-MB-231 (breast cancer), U87 (glioma), M21 (melanoma) and SK-ND-Z (neuroblastoma). K562 transduced to express OKT3 was included as a positive control. CAR-T cells were co-cultured with target cancer cell lines at effector: target ratios of 30:1, 10:1, 3:1 and 1:1 for 4 h. Specific cytotoxicity was measured using a chromium-51 release cytotoxicity assay. Pooled data from two independent experiments. Data are presented as mean values +/− SEM. d Cytokine release assay for nfP2X7-CAR-T cells. CD4+ CAR-T cells and target cells were co-cultured for 24 h and the concentration of IL-2, IFN-ɣ and TNF-α in the supernatant was measured using the Bio-Plex system. Cytokines produced by untransduced CD4+ cells were compared with nfP2X7-CAR-T cells harbouring different hinge lengths. Target cell lines include: K562, K562-OKT3, MDA-MB-231, U87 and SK-ND-Z. Data represent two independent experiments. Data are presented as mean values +/− SEM.
Fig. 2
Fig. 2. NfP2X7-CAR-T cells consist of mostly naive and central memory phenotypes.
a Frequency of EGFR reporter expression on total CD3+ cells 7 days post-transduction (n = 13), ratio of CD8+/CD4+ of CD3+ end of expansion on d14 post-PBMC; n = 13. Data is pooled from 13 independent experiments each dot represents an experiment conducted with T cells from a separate donor. b Representative FACS plots for CD45RA+, CD62L+, and CCR7+ expression of CD4+ and CD8+ nfP2X7-M CAR-T cells at end of expansion on d14 post-PBMC. c Frequency of TSCM, TNaive, TCM, TEM and TEMRA and populations based on CD45RA+, CD62L+ and CCR7+ expression; n = 7. Pooled data from seven independent experiments. Data represents mean ± SEM. Statistical significance was evaluated by paired T test. ns: non-significant.
Fig. 3
Fig. 3. NfP2X7-CAR-T cells exhibit broad-spectrum cytotoxicity against a diverse range of cancer cells.
a Cytotoxicity of target cells by CD3+ nfP2X7-M-CAR-T cells compared with donor-matched untransduced (UT) cells generated in parallel. Target cell lines include: DU145 (prostate cancer), PC3 (prostate cancer), BT-549 (breast cancer), MDA-MB-231 (breast cancer), PC9 (lung cancer), NC1-H460 (lung cancer), C32 (melanoma), Sk-Mel-28 (melanoma), Sk-Mel-5 (melanoma), Namalwa (lymphoma), Ramos (lymphoma), Raji (lymphoma), SH-SY5Y (neuroblastoma), Be(2)-M17 (neuroblastoma), Kelly (neuroblastoma), SK-ND-Z (neuroblastoma), UM-SCC-1 (head and neck carcinoma), RD (rhabdomyosarcoma), LIM1215 (colorectal cancer), HCT116 (colorectal cancer), AsPC-1 (pancreatic cancer), OVCAR5 (ovarian cancer), OVCAR3 (ovarian cancer), RPMI-8226 (myeloma). CAR-T cells were co-cultured with target cancer cell lines at effector:target E:T ratios of 10:1, 3:1 and 1:1 for 16 h. Specific cytotoxicity was measured using a BrightGlo luciferase-based cytotoxicity assay system; paired T test comparing the nfP2X7-M CAR-T with CD3+ UT at the indicated time points. Pooled data from three independent experiments. Statistical significance was evaluated by paired T test. Exact p values on the graph, ns: non-significant. b Table listing cancer types and cancer cell lines tested. Cytotoxicity values at E:T ratio of 10:1, with cytotoxicity values from untransduced control T cells subtracted. c Representative graph showing changes in normalised cell index over time (in hours) for the human prostate cancer cell line PC3 when untreated (black) or treated with either untransduced T cells (UT) (dark blue) or nfP2X7-M CAR T cells (orange). Black vertical line reflects time point at which T cells were added. d The area under the curves were measured and normalised to the cancer cell alone control. Data represents mean ± SEM. Data is pooled from independent experiments for MDA-MB-231 (n = 6), PC3 (n = 6) and OVCAR3 (n = 4) target cell lines, where each dot represents an experiment conducted with T cells from a separate donor. Statistical significance was evaluated by paired T test. Exact p values on the graph, ns: non-significant.
Fig. 4
Fig. 4. NfP2X7-CAR-T cell-mediated cytotoxicity is dependent on P2X7 expression by tumour cells.
a A schematic representation of the CRISPR Cas9 targeting strategy to generate a PC3 prostate cancer P2X7 Knock out (KO) clone with the position of the four sgRNA molecules used for targeted homologous recombination denoted by orange boxes and the PAM sequence denoted by green boxes. Flanking PCR primers are indicated by blue arrows. Specific targeting of both alleles of the human P2X7 locus in exon 6 was verified by sequencing. In the WT transcript row (row 1), the target epitope sequence GHNYTTRNILPGLNITC is highlighted and the proline residue in the 17 amino acid epitope required for nfP2X7-M CAR-T cell binding is annotated. Rows 2 and 3 show that the N-terminal proportion of the epitope is retained followed by a frameshift and premature stop coding (red asterisk) in alleles 1 and 2, respectively. b Representative agarose gel of PCR products generated from single-cell cloning of knockout pools. Heterozygous clone (lane 1), knockout clone 21 (lane 2) and WT (lane 3, single band) are shown. Individual PCR products were gel purified and cloned into the pCR4-TOPO TA vector and sequenced. The expected WT fragment is marked by an arrow. c Total bioluminescence signal from viable cells in the luciferase cytotoxicity assay for PC3 KO negative (neg) control and PC3 P2X7 KO cells, transduced to express luciferase and incubated with luciferin. PC3 KO negative control cells were transduced with a non-targeting sgRNA sequence. Data are presented as mean values +/− SEM. d Cytotoxicity assays testing lysis of PC3 P2X7 KO and PC3 KO negative control cells. CAR-T or donor-matched untransduced T cells (UT) were co-cultured with target cancer cells at effector:target ratios of 10:1, 3:1 and 1:1 for 16 h. Specific cytotoxicity was measured using a BrightGlo luciferase-based cytotoxicity assay system. Statistical significance was evaluated by paired T test comparing nfP2X7-M CAR-T-mediated cytotoxicity against PC3 P2X7 KO cells with PC3 KO negative control cells at the indicated effector to target ratios. Exact p values on the graph, ns: non-significant. Data pooled from three independent batches of CAR-T cells generated from three donors. Data are presented as mean values +/− SEM.
Fig. 5
Fig. 5. CAR-T cells are readily detected within tumours of NSG mice.
a 2 × 106 MDA-MB-231-LM2 or PC3 cells were injected into NSG mice (mammary fat pad or flank, respectively) and allowed to establish for 2 weeks prior to the mice receiving an intravenous injection of 2 × 107 untransduced (UT) or nfP2X7-M CAR-T cells. Tumours were harvested at 12–14 days post T cell injection, FFPE, and 3–5 sections from throughout the tumour were stained with an anti-human CD3+ antibody and DAPI. Representative images shown with the secondary alone control included as inserts. PC3 UT n = 3 sections/tumour from 6 tumours (2 tumours per mouse). MDA UT n = 5 sections/tumour from 2 mice, CAR-T n = 4 sections/tumour from 2 tumours (1 tumour per mouse). Scale bars = 50 µm. The number of CD3+ DAPI+ cells were quantified, with groups blinded. Graph shows the mean ± SEM CD3+ DAPI+ T cells in MDA-MB-231-LM2 tumours (n = 4–5 sections from each of the n = 2 tumours/mice from each group) or PC3 tumours (n = 3 sections from each of the n = 6 tumours harvested from 3 mice/group, with two tumours per mouse) receiving UT or nfP2X7-M CAR-T cells; *p < 0.05, **p < 0.01, unpaired T-test. b For intravital microscopy, 2 × 106 MDA-MB-231-LM2 cells expressing GFP were injected into the mammary fat pad of NSG mice and allowed to establish for 2 weeks. The mice then received an intravenous injection of 2 × 107 CAR T nfP2X7-M cells (labelled with CellTracker Orange) as well as Cy5 Dextran (for visualisation of blood vessels with active blood flow). Zeiss LSM710 with a 20x objective lens was used to visualise the surgically exposed tumour. Representative images showing CAR-T cells firmly adhered to a blood vessel (left panel) and a CAR-T cell transmigrating across a blood vessel wall (middle and right panels) (n = 2). Scale bars = 50 µm. c T cell killing was also observed using in vitro real-time imaging techniques. MDA-MB-231-LM2 cells were seeded into wells and allowed to grow overnight. T cells pulsed with Fluo4 AM (green) and PI (red) to detect dying cells were then added into the wells and images were taken at 10 s intervals for at least 3 h using a 40x objective lens on the Zeiss LSM700. Representative images shown from two independent experiments.
Fig. 6
Fig. 6. NfP2X7-targeting CAR-T cells significantly inhibit the tumourigenesis of a human breast cancer xenograft model.
6–8-week-old female NOD-scid IL2Rγnull (NSG) mice were subcutaneously injected with 2 × 106 MDA-MB-231 human breast cancer cells into the fourth mammary fat pad and intravenously injected with 2 × 107 nfP2X7-targeting CAR-T cells or untransduced T cells on d3 post-tumour injection. Tumours were harvested for flow cytometric analysis at d40 post-tumour injection. a Tumour growth curves (as pooled and individual mice) and endpoint tumour weights; n = 15 (UT) and n = 13 (nfP2X7-M). Tumour size: two-way ANOVA with Bonferroni’s post-test, ****p < 0.0001; tumour weight: two-tailed unpaired t-test, ***p = 0.0003. b Frequency of human CD3+ T cells of total viable cells in tumours, number of human CD3+ T cells per mg of tumour and CD4+/CD8+ ratio of CD3+; n = 8 (UT) and n = 6 (nfP2X7-M); two-tailed unpaired t-test, **p = 0.0071, ****p < 0.0001. c Frequencies of T cell subsets as defined by CD45RO and CD62L expression by intratumoural CD4+ and CD8+ T cells; n = 15 (UT) and n = 12 (nfP2X7-M); two-way ANOVA with Bonferroni’s post-test. d Frequency of PD-1, CTLA-4 and LAG-3 expression by intratumoural CD4+ and CD8+ T cells; n = 5 (UT PD-1, CTLA-4, LAG-3) and n = 9 (nfP2X7-M PD-1), n = 5 (nfP2X7-M CTLA-4), n = 10 (nfP2X7-M LAG-3). Data in (a, c, d) are pooled from 2 independent experiments following in vivo delivery of 2 independent CAR-T cell preparations derived from 1 healthy donor and data in (b) representative of a single independent experiment. Data represented as mean ± SEM.
Fig. 7
Fig. 7. NfP2X7-targeting CAR-T cells significantly inhibit the tumourigenesis of a human prostate cancer xenograft model.
6–8-week-old male NOD-scid IL2Rγnull (NSG) mice were subcutaneously injected with 1 × 106 PC3 human prostate cancer cells into the lower abdomen and intravenously injected with 2 × 107 nfP2X7-targeting CAR-T cells or untransduced T cells on d3 or d7 post-tumour injection. Tumours were harvested for flow cytometric analysis at d27-31 post-tumour injection. a Tumour growth curves (as pooled and individual mice); n = 33 (UT) and n = 35 (nfP2X7-M) and endpoint tumour weights; n = 31 (UT) and n = 34 (nfP2X7-M). Tumour size: two-way ANOVA with Bonferroni’s post-test, ****p < 0.0001; tumour weight: two-tailed unpaired t-test, ****p < 0.0001. b Frequency of human CD3+ T cells of total viable cells in tumours (n = 21 (UT) and n = 21 (nfP2X7-M)), number of human CD3+ T cells per mg of tumour (n = 16 (UT) and n = 16 (nfP2X7-M)) and CD4+/CD8+ ratio of CD3+ (n = 17 (UT) and n = 21 (nfP2X7-M)); two-tailed unpaired t-test, ****p < 0.0001, **p = 0.0035, *p = 0.0104. c Frequencies of T cell subsets as defined by CD45RO and CD62L expression by intratumoural CD4+ and CD8+ T cells; n = at least 6 (UT) and n = 14 (nfP2X7-M); two-way ANOVA with Bonferroni’s post-test, ****p < 0.0001. d Frequency of PD-1, CTLA-4 and LAG-3 expression by intratumoural CD4+ and CD8+ T cells; n = 8 (UT CD4+ PD-1, CTLA-4), n = 5 (UT CD4+ LAG-3; UT CD8+ PD-1, CTLA-4, LAG-3) and n = 12 (nfP2X7-M CD4+/CD8+ PD-1), 8 (nfP2X7-M CD4+/CD8+ CTLA-4), 5 (nfP2X7-M CD4+/CD8+ LAG-3). Data in (a) are pooled from 6 independent experiments and in (bd) pooled from at least 3 independent experiments. Data pooled from in vivo delivery of 5 independent CAR-T cell preparations derived from 4 healthy donors. Data represented as mean ± SEM.

References

    1. Maude SL, et al. Tisagenlecleucel in children and young adults with B-cell lymphoblastic leukemia. N. Engl. J. Med. 2018;378:439–448. - PMC - PubMed
    1. Turtle CJ, et al. CD19 CAR-T cells of defined CD4+:CD8+ composition in adult B cell ALL patients. J. Clin. Invest. 2016;126:2123–2138. - PMC - PubMed
    1. Park JH, et al. Long-term follow-up of CD19 CAR therapy in acute lymphoblastic leukemia. N. Engl. J. Med. 2018;378:449–459. - PMC - PubMed
    1. Kochenderfer JN, et al. Eradication of B-lineage cells and regression of lymphoma in a patient treated with autologous T cells genetically engineered to recognize CD19. Blood. 2010;116:4099–4102. - PMC - PubMed
    1. Brentjens RJ, et al. Safety and persistence of adoptively transferred autologous CD19-targeted T cells in patients with relapsed or chemotherapy refractory B-cell leukemias. Blood. 2011;118:4817–4828. - PMC - PubMed

Publication types