. 2023 Sep 8;14(1):5535.
doi: 10.1038/s41467-023-40823-8.

Activation of the integrated stress response by inhibitors of its kinases

Affiliations

Activation of the integrated stress response by inhibitors of its kinases

Maria Szaruga et al. Nat Commun. .

Abstract

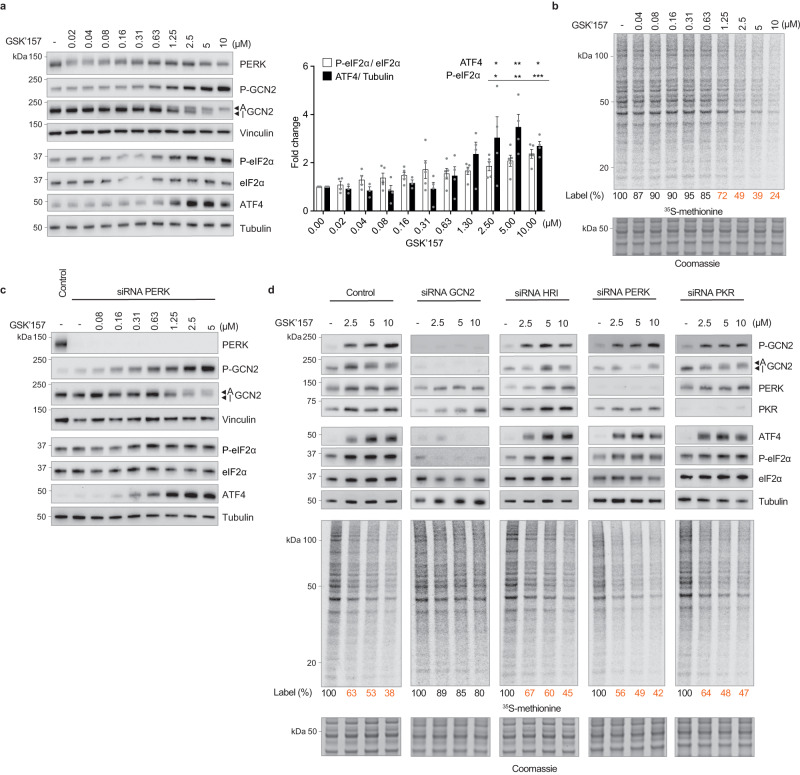
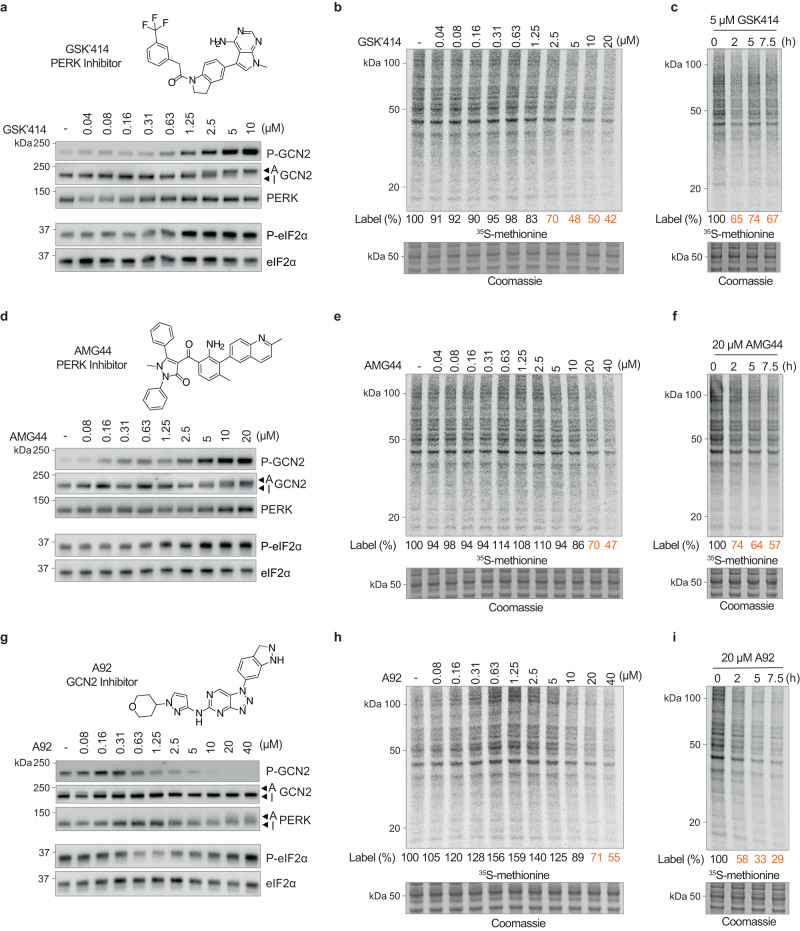
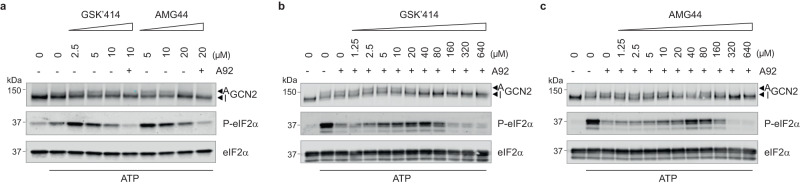
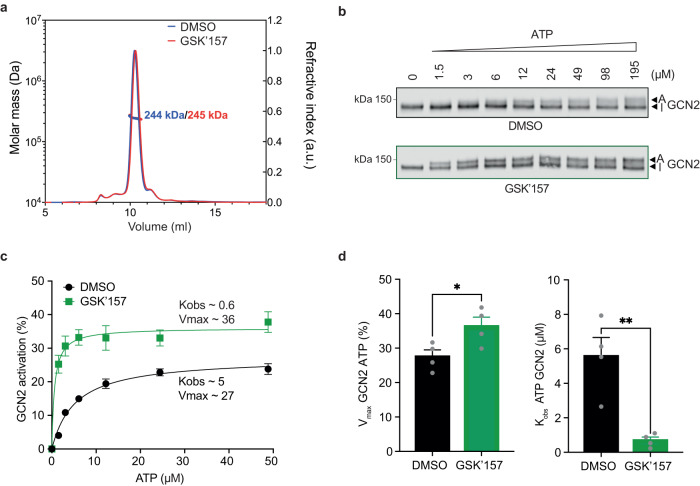
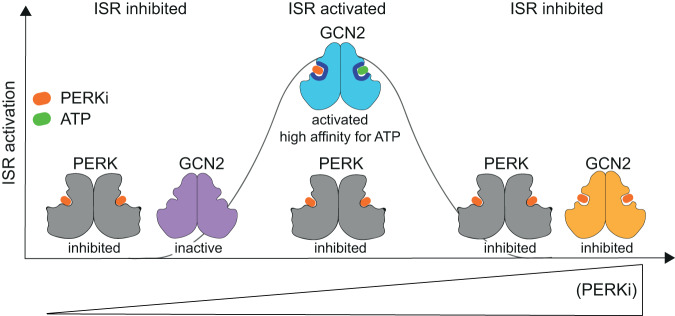
Phosphorylation of the translation initiation factor eIF2α to initiate the integrated stress response (ISR) is a vital signalling event. Protein kinases activating the ISR, including PERK and GCN2, have attracted considerable attention for drug development. Here we find that the widely used ATP-competitive inhibitors of PERK, GSK2656157, GSK2606414 and AMG44, inhibit PERK in the nanomolar range, but surprisingly activate the ISR via GCN2 at micromolar concentrations. Similarly, a PKR inhibitor, C16, also activates GCN2. Conversely, GCN2 inhibitor A92 silences its target but induces the ISR via PERK. These findings are pivotal for understanding ISR biology and its therapeutic manipulations because most preclinical studies used these inhibitors at micromolar concentrations. Reconstitution of ISR activation with recombinant proteins demonstrates that PERK and PKR inhibitors directly activate dimeric GCN2, following a Gaussian activation-inhibition curve, with activation driven by allosterically increasing GCN2 affinity for ATP. The tyrosine kinase inhibitors Neratinib and Dovitinib also activate GCN2 by increasing affinity of GCN2 for ATP. Thus, the mechanism uncovered here might be broadly relevant to ATP-competitive inhibitors and perhaps to other kinases.


Conflict of interest statement

The authors declare no competing interests.

Figures

Fig. 1
Fig. 1. Micromolar concentrations of PERK inhibitor GSK’157 activate GCN2 and the ISR in stressed cells.
a Schematic of mice treatments with 0.1 mg/kg Tm and increasing concentrations of GSK’157. Immunoblots of indicated proteins from lysates of liver samples from mice subjected to the indicated treatments. Active (A) and Inactive (I) PERK are indicated with arrows. Quantification of P-eIF2α and eIF2α from immunoblots such as the ones shown in the left panel. Data are shown as mean ± SD (n = 3), number of animals. **p = 0.0046; n.s.: not significant, as determined by one-way ANOVA with Dunnett’s multiple comparison test. b Immunoblots of indicated proteins from lysates of HeLa cells pre-treated with GSK’157 for 30 min and then co-treated with Tm and GSK’157 for 2 h. Representative experiment from n = 4, biologically independent experiments. Ratio of P-eIF2α to eIF2α and ATF4 to Tubulin quantified from immunoblots and normalised to untreated cells. Data are shown as mean ± SEM (n = 4), biologically independent experiments. *p ≤ 0.0412, **p ≤ 0.0067, ***p = 0.0006, as determined by one-way ANOVA with Dunnett’s multiple comparison test. c Newly synthesized proteins labelled for 10 min with 35S-methionine in HeLa cells following treatment with Tm for the indicated times and a Coomassie-stained gel as control. Representative experiment from n = 2, biologically independent experiments. d Same as panel (c), with HeLa cells pre-treated with GSK’157 for 30 min and then co-treated with Tm and GSK’157 for 2 h. Representative experiment from n = 2, biologically independent experiments. e Same as panel (c), with HeLa cells pre-treated with GSK’157 for 30 min and then co-treated with Tm and 5 μM of GSK’157 for the indicated times. Representative experiment from n = 2, biologically independent experiments. f Immunoblots of indicated proteins from lysates of HeLa cells pre-treated with GSK’157 for 30 min and then co-treated with Tm and GSK’157 for 2 h. Active (A) and Inactive (I) PERK and GCN2 are indicated with arrows. Representative experiment from n = 4, biologically independent experiments. Source data are provided as a Source data file.
Fig. 2
Fig. 2. GSK’157 activates GCN2 and the ISR independently of ER stress and PERK.
a Immunoblots of indicated proteins from lysates of HeLa cells treated with indicated concentrations of GSK’157 for 2.5 h. Active (A) and Inactive (I) GCN2 are indicated with arrows. Representative experiment from n = 4, biologically independent experiments. Ratio of P-eIF2α to eIF2α and ATF4 to Tubulin quantified from immunoblots and normalised to untreated cells. Data are shown as mean ± SEM (P-eIF2α n = 5 and ATF4 n = 4, except 0.02 and 0.04 μM compound treatment n = 4 and n = 3 respectively), biologically independent experiments. *p ≤ 0.0435, **p ≤ 0.0038, ***p = 0.0002, as determined by one-way ANOVA with Dunnett’s multiple comparison test. b Newly synthesized proteins labelled for 10 min with 35S-methionine in HeLa cells treated with indicated concentrations of GSK’157 for 2.5 h and a Coomassie-stained gel as control. Representative experiment from n = 2, biologically independent experiments. c Immunoblots of indicated proteins in lysates of HeLa cells untreated or pre-treated with PERK siRNA for 60 h and subjected to increasing concentrations of GSK’157 for 2.5 h. Active (A) and Inactive (I) GCN2 are indicated with arrows. Representative experiment from n = 3, biologically independent experiments. d Immunoblots of indicated proteins from lysates of HeLa cells untreated or pre-treated with indicated siRNA for 60 h and subjected to increasing concentrations of GSK’157 for 2.5 h. Active (A) and Inactive (I) GCN2 are indicated with arrows. Newly synthesized proteins in the same lysates labelled with 35S-methionine for 10 min and a Coomassie-stained gel as control. Representative experiment from n = 2, biologically independent experiments. Source data are provided as a Source data file.
Fig. 3
Fig. 3. PERK inhibitors activate GCN2 and vice versa.
a Immunoblots of indicated proteins from lysates of HeLa cells treated with indicated concentrations of the PERK inhibitor GSK’414 for 2.5 h. Active (A) and Inactive (I) GCN2 are indicated with arrows. Representative experiment from n = 3, biologically independent experiments. b Newly synthesized proteins labelled for 10 min with 35S-methionine in HeLa cells pre-treated with increasing concentrations of GSK’414 for 2.5 h and a Coomassie-stained gel as control. Representative experiment from n = 2, biologically independent experiments. c Same as panel (b), with HeLa cells treated with 5 μM GSK’414 for the indicated times and a Coomassie-stained gel as control. Representative experiment from n = 2, biologically independent experiments. d Same as panel (a), with increasing concentrations of the PERK inhibitor AMG44 for 2.5 h. Active (A) and Inactive (I) GCN2 are indicated with arrows. Representative experiment from n = 3, biologically independent experiments. e Same as panel (b), with increasing concentrations of AMG44 for 2.5 h. Representative experiment from n = 2, biologically independent experiments. f Same as panel (c), with 20 μM of AMG44 for the indicated times. Representative experiment from n = 2, biologically independent experiments. g Same as panel (a), with increasing concentrations of the GCN2 inhibitor A92 for 5 h. Active (A) and Inactive (I) PERK are indicated with arrows. Representative experiment from n = 3, biologically independent experiments. h Same as panel (b), with increasing concentrations of A92 for 5 h. Representative experiment from n = 2, biologically independent experiments. i Same as panel (c), with 20 μM of A92 for the indicated times. Representative experiment from n = 2, biologically independent experiments. Source data are provided as a Source data file.
Fig. 4
Fig. 4. GSK’157 activates GCN2 and induces eIF2α phosphorylation in vitro.
a Immunoblots of indicated proteins from in vitro kinase reactions carried out with 7.5 nM GCN2, 2 μM eIF2α and indicated concentrations of ATP and incubated for 20 min at 30 °C. Active (A) and Inactive (I) GCN2 are indicated with arrows. Representative experiment from n = 3, biologically independent experiments. b Immunoblots of indicated proteins from reconstituted kinase reaction as in (a), with 6 μM ATP and indicated concentrations of GSK’157, without or with 10 μM of the GCN2 inhibitor A92 compound (last lane). Active (A) and Inactive (I) GCN2 are indicated with arrows. Representative experiment from n = 3, biologically independent experiments. c Ratio of P-eIF2α to eIF2α levels in immunoblots such as the ones shown in panel (b), normalised to 6 μM ATP conditions. Data are shown as mean ± SD (n = 3) with a Gaussian curve fitting, biologically independent experiments. ***p = 0.0009, ****p < 0.0001, as determined by one-way ANOVA with Dunnett’s multiple comparison test. d Structure of PERK kinase domain (KD) with GSK’157 bound to its ATP-binding pocket reported in ref. compared with the structure of GCN2 KD from ref. with GSK’157 fitted into the ATP-binding site. Yellow—PERK, blue—GCN2, green—GSK’157, red—residues in contact with GSK’157. e Melting temperature (Tm) of GCN2 kinase domain (KD) or pseudokinase domain (PKD) in the presence or absence of GSK’157 (100 μM) derived from Supplementary Fig. 9. f Immunoblots of indicated proteins from in vitro kinase reaction as in (a), (b), with 12 μM ATP and indicated concentrations of GCN2 ATP-competitive inhibitor A92. Active (A) and Inactive (I) GCN2 are indicated with arrows. Representative experiment from n = 2, biologically independent experiments. g Immunoblots of indicated proteins as in (a), (b), (f), from reconstituted in vitro kinase reaction with 12 μM ATP, with or without 0.04 μM A92 and with indicated concentrations of GSK’157. Active (A) and Inactive (I) GCN2 are indicated with arrows. Representative experiment from n = 2, biologically independent experiments. h Saturating concentrations of ATP-competitive PERK inhibitor (PERKi) occupy both ATP-pockets and inhibit GCN2 whilst sub-saturating concentrations of PERKi result in occupancy of one of the two ATP-binding sites of the GCN2 dimer and kinase activation. Source data are provided as a Source data file.
Fig. 5
Fig. 5. PERK inhibitors of distinct chemotypes activate GCN2 and induce eIF2α phosphorylation in vitro.
a Immunoblots of indicated proteins from in vitro kinase assays with 7.5 nM GCN2, 2 μM eIF2α, 12 μM ATP and increasing concentrations of GSK’414 or AMG44 PERK. 10 μM of the GCN2 inhibitor A92 was added in the indicated lanes. Active (A) and Inactive (I) GCN2 are indicated with arrows. Representative experiment from n = 2, biologically independent experiments. b, c Immunoblots of indicated proteins as in (a), from reconstituted in vitro kinase reactions with 12 μM ATP, with or without 0.04 μM A92 and with indicated concentrations of GSK’414 or AMG44. Active (A) and Inactive (I) GCN2 are indicated with arrows. Representative experiments from n = 2 (per compound), biologically independent experiments. Source data are provided as a Source data file.
Fig. 6
Fig. 6. PKR inhibitor C16 activates GCN2 and induces eIF2α phosphorylation in vitro and in cells.
a Immunoblots of indicated proteins from in vitro kinase reaction with 7.5 nM GCN2, 2 μM eIF2α, with or without 6 μM ATP as indicated, and with stated concentrations of C16. Active (A) and Inactive (I) GCN2 are indicated with arrows. Representative experiment from n = 2, biologically independent experiments. b Ratio of P-eIF2α to eIF2α levels in immunoblots such as the ones shown in (a), normalised to 6 μM ATP conditions. Data are shown as mean ± SD (n = 2), biologically independent experiments. *p < 0.03 as determined by one-way ANOVA with Dunnett’s multiple comparison test. c Immunoblots of indicated proteins from lysates of HeLa cells treated with indicated concentrations of the PKR inhibitor C16 for 2.5 h. Representative experiment from n = 2, biologically independent experiments. d Immunoblots of indicated proteins from reconstituted in vitro kinase reaction as in (a), with 12 μM ATP, with or without 0.04 μM A92 and with indicated concentrations of C16. Active (A) and Inactive (I) GCN2 are indicated with arrows. Representative experiment from n = 2, biologically independent experiments. Source data are provided as a Source data file.
Fig. 7
Fig. 7. GSK’157 activates GCN2 by increasing its affinity for ATP.
a Size-exclusion chromatography–multiangle light scattering (SEC-MALS) profile of in-house recombinant GST-GCN2 fragment (MW ~ 135 kDa) in presence of 50 μM GSK’157 or DMSO. The molecular weight measured by light scattering was 244–245 kDa in both conditions, consistent with a dimeric state of the recombinant protein. Representative experiment from n = 2, biologically independent experiments. b Immunoblots of GCN2 from in vitro kinase reactions with 7.5 nM GCN2 and indicated concentrations of ATP in presence of DMSO or 5 μM GSK’157. Active (A) and Inactive (I) GCN2 are indicated with arrows. Representative experiment from n = 4, biologically independent experiments. c Ratio of active to total (active + inactive) GCN2 in the reactions fit to Michaelis-Menten nonlinear model. Data are shown as mean ± SEM (n = 4, except 12 μM ATP n = 3 for GSK’157), biologically independent experiments. d Velocity (Vmax) and apparent affinity (Kobs) for GCN2 and ATP in presence of DMSO or 5 μM GSK’157 derived from panel (c). Data are shown as mean ± SEM (n = 4), biologically independent experiments. *p = 0.0385, **p = 0.0046, as determined by two-sided, unpaired t-test. Source data are provided as a Source data file.
Fig. 8
Fig. 8. Diverse kinase inhibitors activating GCN2 kinase increase its affinity for ATP.
af In vitro kinase reactions with 7.5 nM GCN2 and indicated concentrations of ATP in presence of DMSO or compounds. a Ratio of active to total (active + inactive) GCN2 in the reactions with DMSO, 2.5 μM GSK’414 or 5 μM AMG44 fit to Michaelis-Menten nonlinear model. Data are shown as mean ± SD (DMSO n = 2, GSK’414 n = 3, AMG44 n = 4), biologically independent experiments. b Apparent affinity (Kobs) for GCN2 and ATP in presence of compounds from panel (a) normalised to DMSO. Data are shown as mean ± SD, biologically independent experiments. ***p < 0.0007, as determined by one-way ANOVA with Dunnett’s multiple comparison test. c As in panel (a) for reactions with DMSO or 0.75 μM C16 fit to Michaelis-Menten nonlinear model. Data are shown as mean ± SD (DMSO n = 3 and C16 n = 4, except 12 μM ATP n = 2 and n = 3 respectively), biologically independent experiments. d As in panel (b) for C16 normalised to DMSO. Data are shown as mean ± SD, biologically independent experiments. *p < 0.0231, as determined by two-sided, unpaired t-test. e As in panel (a) for reactions with DMSO, 2 μM Dovitinib or 1 μM Neratinib fit to Michaelis-Menten nonlinear model. Data are shown as mean ± SD (DMSO n = 2, Dovitinib n = 3, Neratinib n = 2), biologically independent experiments. f As in panel (b) for Dovitinib and Neratinib normalised to DMSO. Data are shown as mean ± SD, biologically independent experiments. **p < 0.0045, as determined by one-way ANOVA with Dunnett’s multiple comparison test. Source data are provided as a Source data file.
Fig. 9
Fig. 9. Model for the bidirectional control of the ISR by PERK kinase inhibitors.
At nanomolar concentrations, a PERK inhibitor (PERKi) saturates its primary target and inhibits the ISR, as anticipated. At concentrations oversaturating the primary target PERK, binding to the off-target kinase GCN2 is enabled. Binding of the inhibitor to the ATP-binding site of one protomer of the GCN2 dimer, increases the affinity for ATP of the second protomer leading to GCN2 activation. This in turn results in functional ISR induction in absence of specific kinase activating stressors. Saturation of both PERK and GCN2 with complete inhibition of the two kinases is achieved at higher concentrations of the inhibitors. Note that GCN2 and the ISR can be activated by the PKR inhibitor C16 by a similar mechanism.

References

    1. Sonenberg N, Hinnebusch AG. Regulation of translation initiation in eukaryotes: mechanisms and biological targets. Cell. 2009;136:731–745. doi: 10.1016/j.cell.2009.01.042. - DOI - PMC - PubMed
    1. Wek RC. Role of eIF2α kinases in translational control and adaptation to cellular stress. Cold Spring Harb. Perspect. Biol. 2018;10:a032870–17. doi: 10.1101/cshperspect.a032870. - DOI - PMC - PubMed
    1. Pilla E, Schneider K, Bertolotti A. Coping with protein quality control failure. Annu. Rev. Cell Dev. Biol. 2017;33:439–465. doi: 10.1146/annurev-cellbio-111315-125334. - DOI - PubMed
    1. Bertolotti A. The split protein phosphatase system. Biochem. J. 2018;475:3707–3723. doi: 10.1042/BCJ20170726. - DOI - PMC - PubMed
    1. Costa-Mattioli, M. & Walter, P. The integrated stress response: from mechanism to disease. Science368, eaat5314 (2020). - PMC - PubMed

Publication types

Substances