. 2023 Sep 8;13(1):14864.
doi: 10.1038/s41598-023-40655-y.

Continuous peripersonal tracking accuracy is limited by the speed and phase of locomotion

Affiliations

Continuous peripersonal tracking accuracy is limited by the speed and phase of locomotion

Matthew J Davidson et al. Sci Rep. .

Abstract

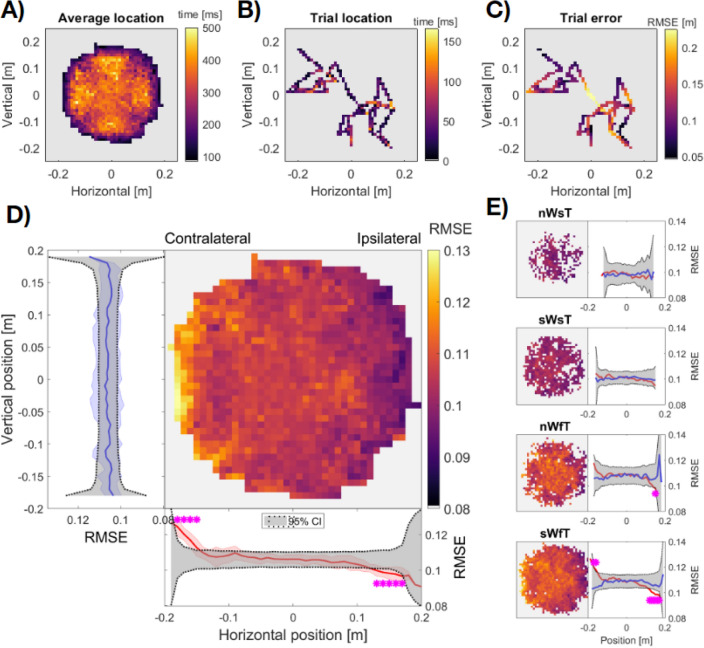
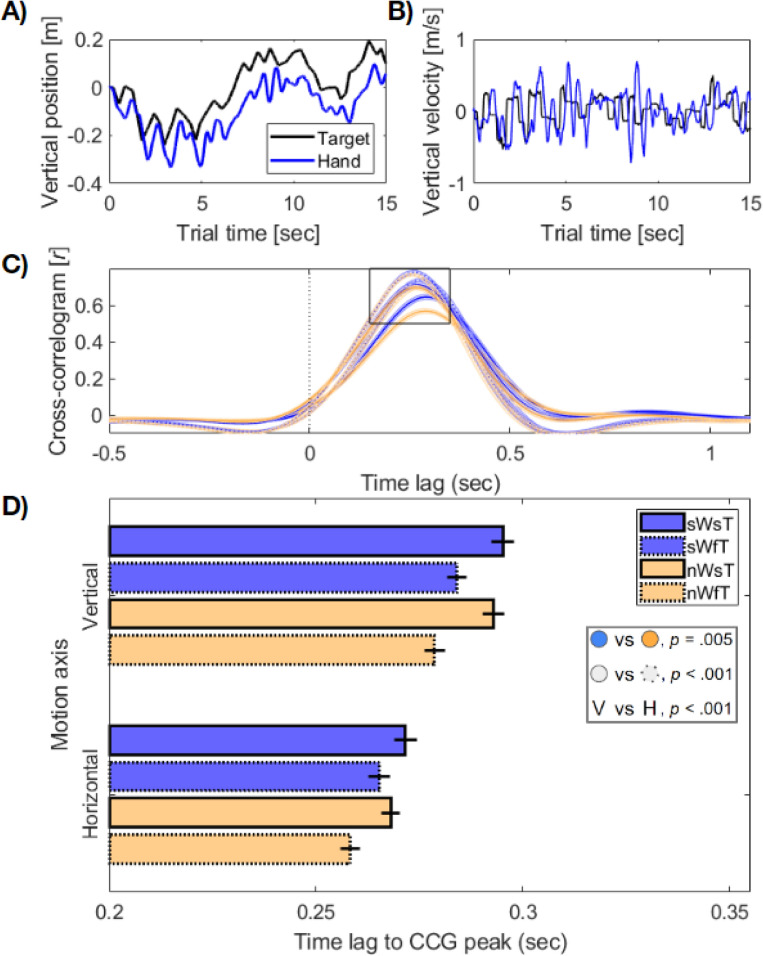
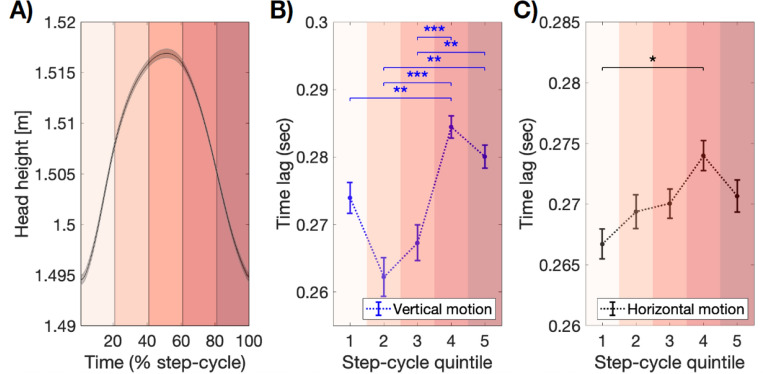
Recent evidence suggests that perceptual and cognitive functions are codetermined by rhythmic bodily states. Prior investigations have focused on the cardiac and respiratory rhythms, both of which are also known to synchronise with locomotion-arguably our most common and natural of voluntary behaviours. Compared to the cardiorespiratory rhythms, walking is easier to voluntarily control, enabling a test of how natural and voluntary rhythmic action may affect sensory function. Here we show that the speed and phase of human locomotion constrains sensorimotor performance. We used a continuous visuo-motor tracking task in a wireless, body-tracking virtual environment, and found that the accuracy and reaction time of continuous reaching movements were decreased at slower walking speeds, and rhythmically modulated according to the phases of the step-cycle. Decreased accuracy when walking at slow speeds suggests an advantage for interlimb coordination at normal walking speeds, in contrast to previous research on dual-task walking and reach-to-grasp movements. Phasic modulations of reach precision within the step-cycle also suggest that the upper limbs are affected by the ballistic demands of motor-preparation during natural locomotion. Together these results show that the natural phases of human locomotion impose constraints on sensorimotor function and demonstrate the value of examining dynamic and natural behaviour in contrast to the traditional and static methods of psychological science.


Conflict of interest statement

The authors declare no competing interests.

Figures

Figure 1
Figure 1
Virtual environment and first-person view of the dynamic tracking task. (A) In each trial, participants walked along a smooth, level path in a virtual environment, (B) while minimising the distance between their dominant right-hand and a floating sphere undergoing a random 3D walk. (C) Visual feedback was provided in the form of a colour change (left panel) when reaching accuracy was within a predefined limit. For illustration purposes this figure shows computer-generated avatars however no avatars were used in the experiment. An example trial can be experienced from first-person view in Supplementary Video S1.
Figure 2
Figure 2
Gait parameters and average hand to target Euclidean error (RMSE) per condition. In all panels, formatting for target speed (slow = solid line; fast = broken line) and walking speed (slow = blue, normal = yellow) is consistent. (A,B) Group mean distributions of step duration and step distance per condition. Coloured lines and shading display the mean ± 1 SEM adjusted for within participant comparisons. Vertical magenta lines display the distribution means (slow targets = solid line; fast = broken line). (CF) Density maps of the relationship between step duration and step distance per condition. Horizontal and vertical magenta lines indicate the distribution means from a,b. Instructions to walk slowly decreased step length, and increased step duration. (G) Average hand to target RMSE per condition, with data points displaying individual participant means. The box plots show the interquartile range and median of each condition. **p < 0.01; ***p < 0.001. (H) The data from (g) when split by left or right foot support. Red colour indicates left support (right foot swinging), green colour indicates right foot support (left foot swinging). Error bars display ± 1 SEM adjusted for within participant comparisons. Reach error significantly increased when swinging the foot ipsilateral to the tracking hand, but only when tracking slow targets at normal walking speed (p < 0.05, FDR corrected).
Figure 3
Figure 3
Distribution of target locations and reaching errors within the target motion boundary. (A) Grand average distribution of target locations across all participants. The colour scale displays the average time at each location per trial. (B) Single trial example of changes in target location. (C) Single trial error of the same example trial. The colour scale displays RMSE for each location. (D) Grand average reaching error per location. Average vertical error is shown by the blue trace at left (averaging within all rows). Average horizontal error is shown by the red trace at the bottom (averaging within all columns). Blue and Red shading shows the SD across rows and columns, respectively. Dark grey shaded regions in left and bottom panels (D) display the 95% Confidence Interval of error calculated from location-permuted data and magenta asterisks show significant target error compared to this null distribution (p < 0.05, FDR corrected). (E) Grand average error per condition (n/sW, normal/slow Walk; s/fT, slow/fast Target). Note that the colour scale is truncated and that light grey indicates RMSE < 0.08, to show the change in relative error across spatial locations. Panels to the right show average error within one dimension. Vertical is shown in blue, horizontal in red, with 95% CI per trial type in dark grey.
Figure 4
Figure 4
The phase of locomotion modulates reach error. (A) An example of head height plotted over time for a single trial. Each trial involved walking along a 9.5 m path at either normal (yellow) or slow speed (blue). (B) Grand average head-height over the step-cycle, epoched per condition (yellow: normal walking speed; blue: slow speed). Solid lines show head-height during slow target conditions, broken lines for fast target conditions. Shading represents mean and ± 1 SEM. Note all four conditions are displayed, yet target speeds closely overlap. (C) Average head-height resampled between 1 and 100% of the step-cycle. Labels showing stance and swing phases of the step-cycle are based on prior research (see “Materials and methods”). The same resampling procedure was used in (DE) to investigate error over the step-cycle. (D) Average absolute error over the step-cycle on the vertical (top row), horizontal (middle row) and depth axis (bottom row), when supported by the left or right foot (columns) respectively. (E) Euclidean error over the step-cycle. Red shading represents significant differences between walking speeds, within a target speed condition. Large differences (not visualised) remained between target speed conditions (p < 0.05, FDR corrected).
Figure 5
Figure 5
Cross-correlogram (CCG) workflow and results. Examples of single trials from one participant showing (A) position on the vertical axis, and (B) the velocity change of the same trials used to compute CCGs. (C) The overall cross-correlogram, averaged across participants within trial types. (AC) show data for the vertical dimension only, identical analyses were performed for the horizontal dimension. (D) Mean time-lag to the peak in CCG function per trial type. Slow/normal walk speed denoted by blue/yellow colours, and slow/fast target speed by solid/broken lines. Error bars show ± 1 SEM corrected for within-participant comparisons. Legend (inset) summarises significant main effects.
Figure 6
Figure 6
Reaction-time modulates with phase of the step-cycle. (A) Average head height over all steps. Our wCCG analyses sorted CCG lag into step quintiles shown in shades of Red. (B) Time lag for the peak in wCCG correlation, averaged per step quintile, shown separately for vertical (blue) and (C) horizontal (black) motion tracking. In both cases, reaction-times were significantly modulated by the phase of locomotion, fastest in the swing-phase of each step, before slowing prior to footfall. ***p < 0.001; *p < 0.05. For wCCG per trial type, see Supplementary Fig. S2.

References

    1. Engel AK, Maye A, Kurthen M, König P. Where’s the action? The pragmatic turn in cognitive science. Trends Cogn. Sci. 2013;17(5):202–209. - PubMed
    1. Herwig A. Linking perception and action by structure or process? Toward an integrative perspective. Neurosci. Biobehav. Rev. 2015;52:105–116. - PubMed
    1. Hommel B, Wiers RW. Towards a unitary approach to human action control. Trends Cogn. Sci. 2017;21(12):940–949. - PubMed
    1. O’Regan JK. Solving the "real" mysteries of visual perception: The world as an outside memory. Can. J. Psychol. 1992;46(3):461–488. - PubMed
    1. O’Regan JK, Noë A. A sensorimotor account of vision and visual consciousness. Behav. Brain Sci. 2001;24(5):939–973. - PubMed

Publication types