. 2023 Sep 8;13(1):163.
doi: 10.1186/s13578-023-01114-3.

Fluid shear stress induces a shift from glycolytic to amino acid pathway in human trophoblasts

Affiliations

Fluid shear stress induces a shift from glycolytic to amino acid pathway in human trophoblasts

Beatrice Anna Brugger et al. Cell Biosci. .

Abstract

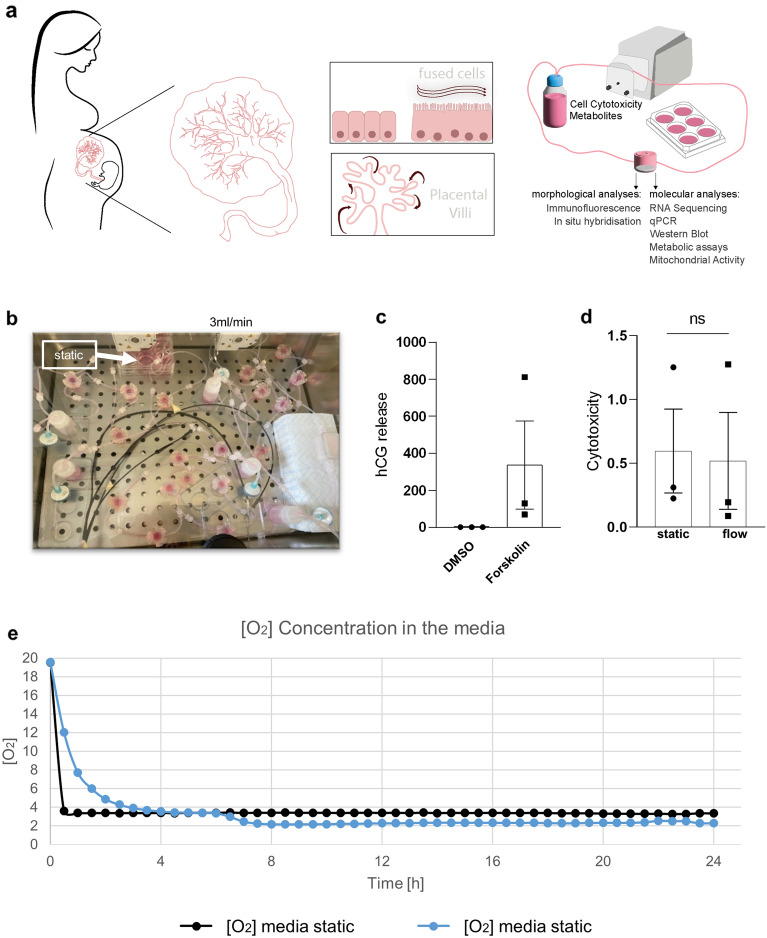
Background: The human placenta, a tissue with a lifespan limited to the period of pregnancy, is exposed to varying shear rates by maternal blood perfusion depending on the stage of development. In this study, we aimed to investigate the effects of fluidic shear stress on the human trophoblast transcriptome and metabolism.

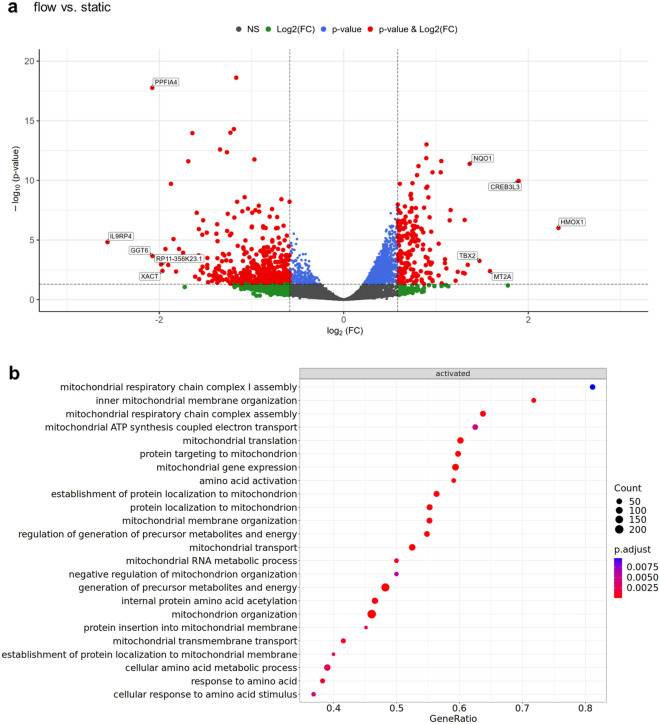
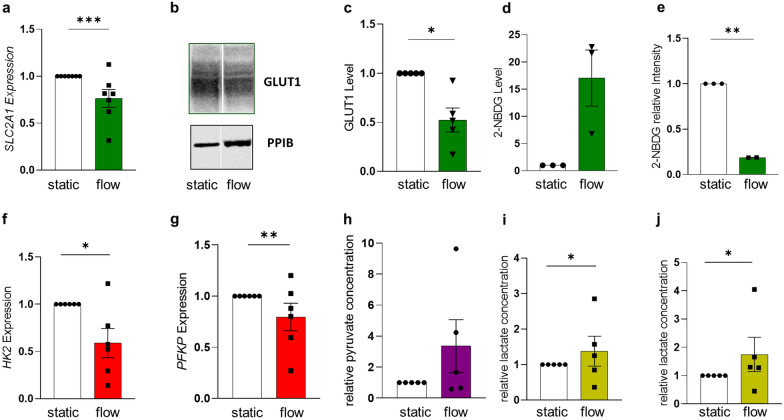
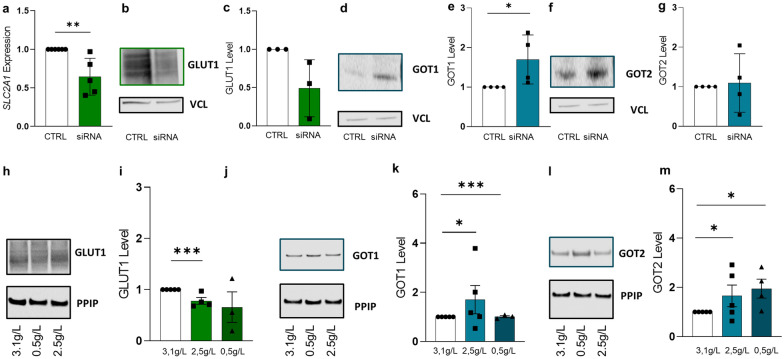
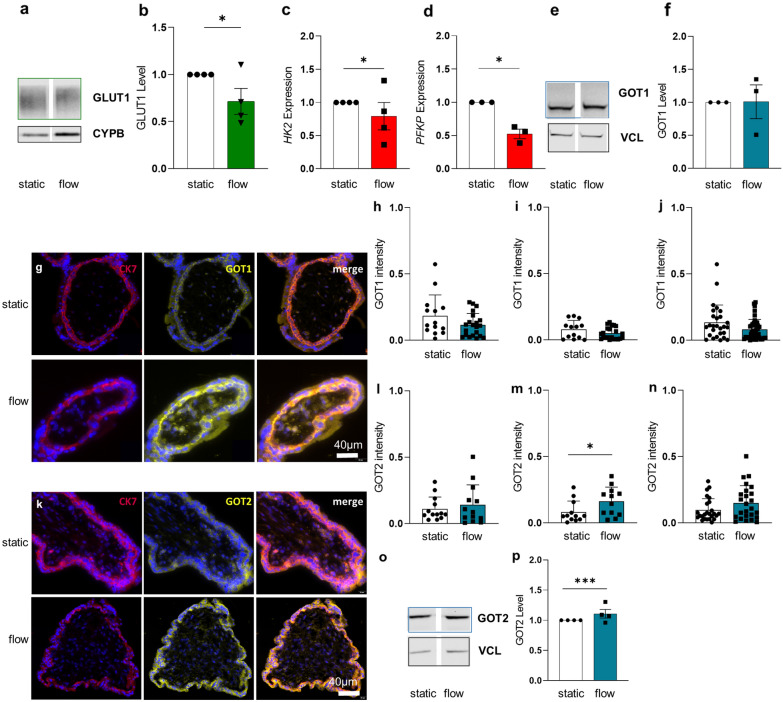
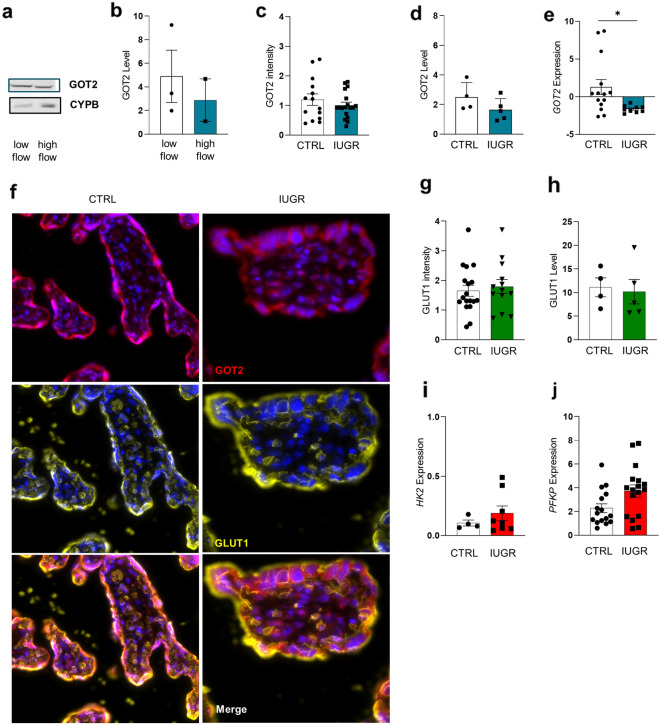
Results: Based on a trophoblast cell line cultured in a fluidic flow system, changes caused by shear stress were analyzed and compared to static conditions. RNA sequencing and bioinformatics analysis revealed an altered transcriptome and enriched gene ontology terms associated with amino acid and mitochondrial metabolism. A decreased GLUT1 expression and reduced glucose uptake, together with downregulated expression of key glycolytic rate-limiting enzymes, hexokinase 2 and phosphofructokinase 1 was observed. Altered mitochondrial ATP levels and mass spectrometry data, suggested a shift in energy production from glycolysis towards mitochondrial oxidative phosphorylation. This shift in energy production could be supported by increased expression of glutamic-oxaloacetic transaminase variants in response to shear stress as well as under low glucose availability or after silencing of GLUT1. The shift towards amino acid metabolic pathways could be supported by significantly altered amino acid levels, like glutamic acid, cysteine and serine. Downregulation of GLUT1 and glycolytic rate-limiting enzymes, with concomitant upregulation of glutamic-oxaloacetic transaminase 2 was confirmed in first trimester placental explants cultured under fluidic flow. In contrast, high fluid shear stress decreased glutamic-oxaloacetic transaminase 2 expression in term placental explants when compared to low flow rates. Placental tissue from pregnancies with intrauterine growth restriction are exposed to high shear rates and showed also decreased glutamic-oxaloacetic transaminase 2, while GLUT1 was unchanged and glycolytic rate-limiting enzymes showed a trend to be upregulated. The results were generated by using qPCR, immunoblots, quantification of immunofluorescent pictures, padlock probe hybridization, mass spectrometry and FRET-based measurement.

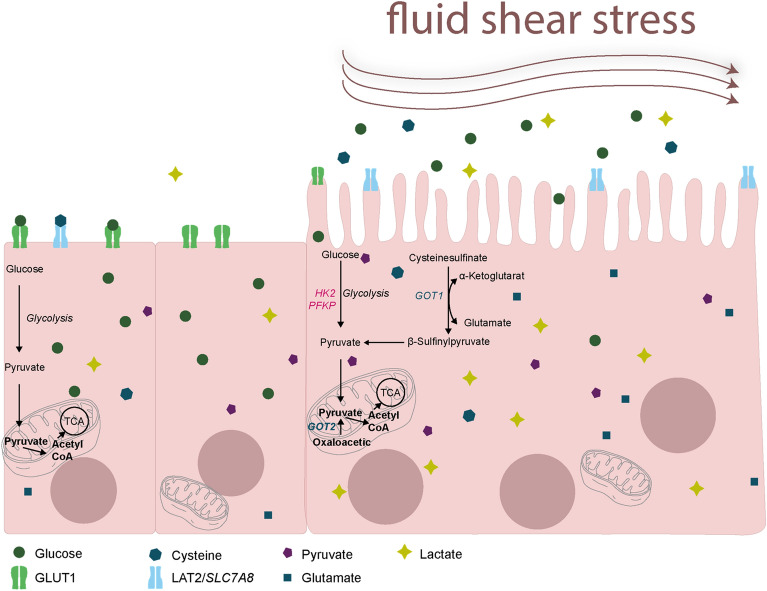
Conclusion: Our study suggests that onset of uteroplacental blood flow is accompanied by a shift from a predominant glycolytic- to an alternative amino acid converting metabolism in the villous trophoblast. Rheological changes with excessive fluidic shear stress at the placental surface, may disrupt this alternative amino acid pathway in the syncytiotrophoblast and could contribute to intrauterine growth restriction.

Keywords: Fluidic shear stress; Placenta development; Trophoblast metabolism.


Conflict of interest statement

The authors declare no competing interests.

Figures

Fig. 1
Fig. 1
Fluidic flow culture system for analysis of the impact of FSS on the developing placenta. Scheme of the experimental setup illustrates the human placenta, with placental villi bathing in maternal blood flow. The differentiated trophoblast cell line BeWo or human first trimester placental villous explants were cultured under circuit flow in a bioreactor. Downstream analyses after flow culture, including morphological and biomolecular approaches (a). Flow chambers were connected to a tubing system and a reservoir bottle. Flow cycles, including 3 chambers each, were run in a TEB500 flow bioreactor. In parallel, cells were cultured in 6-well dishes under static conditions (b). Before subjecting cells to fluidic flow culture, forskolin-induced differentiation was confirmed by increased secretion of hCG (c). After flow culture, cell viability was determined using a cytotoxicity assay (d). Oxygen measurement in the cell culture media of static (black) and flow treated cells (blue) (e). Data are presented as mean ± SEM and were obtained from three independent experiments using three different cell passages
Fig. 2
Fig. 2
FSS affects the trophoblast transcriptome. The volcano plot showing the significant changes in the transcriptome in differentiated BeWo cells, when cultured under flow, compared to cells cultured under static conditions. Red dots represent significantly differentially expressed genes with an adjusted p-value of ≤ 0.05 and an absolute log2 fold change of ≥ log2(1.5) (a). Dot plot showing the GSEA results for relevant gene ontology terms based on the comparison between flow and static conditions. The gene ratio represents the ratio of the number of core enriched genes among all genes. Dots are color-coded depending on their adjusted p-value. Size of the dots are presenting the number of core enriched genes in the respective gene sets (b). Presented data are based on triplicates, using three different cell passages each run and are provided in the source data set
Fig. 3
Fig. 3
FSS impairs trophoblastic glucose uptake and expression of genes involved in the glycolytic pathway. Cells were cultured either under static or flow conditions for 24 h as indicated. qPCR (a) analysis of SLC2A1 gene expression in cells, a representative Western Blots (b) and band densitometry (c) for GLUT1 protein. Glucose consumption was determined by 2-NBDG concentration in the supernatant (d), and in cell lysates (e). qPCR analysis revealed downregulation of HK2 (f) and PFKP (g) in BeWo cells cultured under flow. Intracellular pyruvate (h) as well as intracellular (i) and released lactate (j) increased in cells in response to fluidic flow. Outlier were detected with Grubbs’ α = 0.05, normal distribution of data was analyzed with Shapiro–Wilk test. Statistical analysis was performed using one sample t-test. Statistical significance was set at p < 0.05. Values represent mean ± SEM based on experiments using three to five different cell passages
Fig. 4
Fig. 4
FSS influences pathways of energy metabolism and mitochondrial activity in trophoblasts. Metabolites of the glycolysis (a) and the TCA cycle (b) are presented for static and flow conditions, representing the peak area normalized to protein content and to the static control. Representative trace of reordered BeWo cells treated either under static (black) or flow (purple) pre-incubation expressing mtAT1.03. Dashed lines indicates the basal ratio used for further calculations. Red dotted lines indicate the deltas quantified (c). The maximum value after glucose removal was determined and the basal value subtracted to calculate the delta for hexokinase (d). Long-term glucose removal leads to decrease in the ratio (e). The minimum was determined before glucose re-addition and basal ratio was substracted. Oligomycin was added to the perfusion after the ratio reached a plateau phase after glucose re-addition. When the ratio reached the plateau under oligomycin the experiment was stopped (f),—either minimum or maximum was determined, depending on the cells reaction, and basal substracted (n = cells/days static 9/4; 0.95 dyne/cm2 7/4). Outlier were detected with Grubbs’ α = 0.05, normal distribution of data was analyzed with Shapiro–Wilk test. Statistical analysis for the relative abundance of metabolites was performed with a multiple unpaired t-test. Statistical analysis for the mitochondrial assay was performed using an unpaired t-test. Statistical significance was set at p < 0.05. Values represent mean ± SEM based on experiments using three to five different cell passages
Fig. 5
Fig. 5
FSS induces GOT-dependent amino acid metabolism in trophoblasts cells were cultured either under static, or flow conditions for 24 h. qPCR analysis of GOT1 (a). Representative Western Blot (b) and band densitometry (c) showed increasing GOT1 levels in BeWo cells exposed to shear stress. GOT2 mRNA (d) and protein levels (e and f) were upregulated in cells cultured under flow conditions. Padlock probe-based in situ hybridization (g) detected GOT1 (blue dots) and GOT2 transcripts (yellow dots) in BeWo cells. The anchor, confirming positive signals, is shown in pink. Scale bar: 20 µM. In situ hybridization analysis represent GOT1 (h) and GOT2 (i). Data were normalized to ACTB (j). GOT activity (k) increased in cells exposed to shear stress compared to static conditions. SLC7A8 mRNA (l) increase in cells exposed to shear stress. Data are presented as mean ± SEM based on experiments using five different cell passages. In situ hybridization was performed three times. Outlier were detected with Grubbs’ α = 0.05, normal distribution of data was analyzed with Shapiro–Wilk test. Statistical analysis was performed using one sample t-test. Statistical significance was set at p < 0.05
Fig. 6
Fig. 6
Dependence of GOT1 and GOT2 from glucose availability Efficiency of SLC2A1 silencing in differentiated BeWo cells was determined for CTRL and silenced samples on mRNA (a) and protein level (b and c). Western Blot (d) and band densitometry (e) revealed increased GOT1 protein levels, while GOT2 levels (f and g) remained unchanged in SLC2A1-silenced cells. Cells were cultured with three different glucose concentrations. Immunoblotting (h) and band densitometry (i) showed declining GLUT1 levels with decreasing available glucose concentrations. GOT1 (j and k) and GOT2 (l and m) levels increased when cultured in low glucose medium. Experiments were performed a minimum of three times. Outlier were detected with Grubbs’ α = 0.05, normal distribution of data was analyzed with Shapiro–Wilk test. Statistical analysis was performed using one sample t-test for the protein analysis. Statistical significance was set at p < 0.05
Fig. 7
Fig. 7
FSS affects GLUT1, GOT1 and GOT2 expression in different trophoblast layers. First trimester villi were cultured either under static or flow conditions for 24 h. Western Blot for GLUT1 receptor in first trimester placental villi (a) and related band densitometry (b). Key glycolytic enzymes HK2 (c) and PFKP (d) expression levels Representative Western Blot (e) and band densitometry (f) showed no change in placental GOT1 levels. Representative immunofluorescence staining of human placental first trimester explant cultures stained for CK7 (red, upper panel), GOT1 (yellow) (g). Nuclei were stained with DAPI. Software-based image analysis showed downregulation of GOT1 in the CT (h), as well as in the SCT layer (i), and total villous trophoblast compartment (j) under fluidic flow. Immunofluorescence staining of first trimester placental villi for CK7 (red), and GOT2 (yellow) (k). Software-based image analysis showed no significant change of GOT2 intensity in the CT (l), whereas GOT2 intensity increased in the SCT (m) and the total villous trophoblast (n) under fluidic flow. Representative Western Blot (o) and band densitometry (p) showed GOT2 upregulation under flow conditions in placental explants. Immunofluorescence and Western Blot analysis were performed with four different placental samples. Outlier were detected with Grubbs’ α = 0.05, normal distribution of data was analyzed with Shapiro–Wilk test. Statistical analysis was performed using one sample t-test for the protein analysis. Statistical analysis for the immunofluorescent staining was performed with an unpaired t-test. Statistical significance was set at p < 0.05. Values represent mean ± SEM.
Fig. 8
Fig. 8
GLUT1 and GOT2 expression in pregnancies complicated by intrauterine growth restriction. Western Blot of GOT2 level in term placental explants exposed either to low or high FSS (a) and band densitometry (b). GOT2 intensity in IUGR placentas (c) and the representative staining for data shown in (f). Western blot (d) and qPCR (e) of placental GOT2 levels in IUGR and control cases. Analyses were performed with a minimum of five placenta samples for Western Blot, nine IUGR placenta samples for qPCR, and 20 different IUGR placenta for IF. Immunofluorescence picture represents GOT2 (red) and GLUT1 (yellow). Nuclei are stained with DAPI (f). GLUT1 expression is not significantly affected in IUGR placenta compared to control in all analysis (g and h). Key enzymes of the glycolytic pathway HK2 (i) and PFKP (j) are slightly upregulated in IUGR compared to CTRL placentas. Outlier were detected with Grubbs’ α = 0.05, normal distribution of data was analyzed with Shapiro–Wilk test. Statistical analysis was performed using one sample t-test for the protein analysis. Statistical analysis for the immunofluorescent staining was performed with an unpaired t-test. Statistical significance was set at p < 0.05. Values represent mean ± SEM
Fig. 9
Fig. 9
Summary of the metabolic pathway in placental cells. Summary of the metabolism in cells and tissue exposed to shear stress. The main glucose transporter GLUT1 is downregulated, and lower glucose levels in the cells and higher glucose levels in the supernatant were observed. Genes involved in the glycolytic pathway, like HK2, PFKP and PGK1 are also downregulated in cells treated under flow conditions. Products of the glycolytic pathway, like pyruvate and the downstream product lactate are upregulated in cells and supernatant exposed to fluidic flow. A second pathway was observed, which could handle the energy maintenance in cause of low glucose consumption and downregulated glycolysis. Amino acid transporter SLC7A8 is upregulated in cells treated under flow conditions, as well as the enzymes GOT1 and GOT2. Product from the conversion from cysteine to pyruvate is glutamic acid, which is upregulated in cells exposed to shear stress

References

    1. Fowden AL, Camm EJ, Sferruzzi-Perri AN. Effects of maternal obesity on placental phenotype. Curr Vasc Pharmacol. 2021;19:113–131. - PubMed
    1. Gauster M, Moser G, Wernitznig S, Kupper N, Huppertz B. Early human trophoblast development: from morphology to function. Cell Mol Life Sci. 2022;79:345. - PMC - PubMed
    1. Vento-Tormo R, Efremova M, Botting RA, Turco MY, Vento-Tormo M, Meyer KB, et al. Single-cell reconstruction of the early maternal-fetal interface in humans. Nature. 2018;563:347–353. - PMC - PubMed
    1. Moser G, Weiss G, Sundl M, Gauster M, Siwetz M, Lang-Olip I, et al. Extravillous trophoblasts invade more than uterine arteries: evidence for the invasion of uterine veins. Histochem Cell Biol. 2017;147:353–366. - PMC - PubMed
    1. Brugger BA, Guettler J, Gauster M. Go with the flow-trophoblasts in flow culture. Int J Mol Sci. 2020 doi: 10.3390/ijms21134666. - DOI - PMC - PubMed

LinkOut - more resources