. 2023 Aug 29;13(17):2795.
doi: 10.3390/diagnostics13172795.

Ultra-High-Resolution Electrocardiography Enables Earlier Detection of Transmural and Subendocardial Myocardial Ischemia Compared to Conventional Electrocardiography

Affiliations

Ultra-High-Resolution Electrocardiography Enables Earlier Detection of Transmural and Subendocardial Myocardial Ischemia Compared to Conventional Electrocardiography

Kirill V Zaichenko et al. Diagnostics (Basel). .

Abstract

The sensitivity of exercise ECG is marginally sufficient for the detection of mild reduction of coronary blood flow in patients with early coronary atherosclerosis. Here, we describe the application of a new technique of ECG registration/analysis-ultra-high-resolution ECG (UHR ECG)-for early detection of myocardial ischemia (MIS). The utility of UHR ECG vs. conventional ECG (C ECG) was tested in anesthetized rats and pigs. Transmural MIS was induced in rats by the ligation of the left coronary artery (CA). In pigs, subendocardial ischemia of a variable extent was produced by stepwise inflation of a balloon within the right CA, causing a 25-100% reduction of its lumen. In rats, a reduction in power spectral density (PSD) in the high-frequency (HF) channel of UHR ECG was registered at 60 s after ischemia (power 0.81 ± 0.14 vs. 1.25 ± 0.12 mW at baseline, p < 0.01). This was not accompanied by any ST segment elevation on C ECG. In pigs, PSD in the HF channel of UHR ECG was significantly decreased at a 25% reduction of CA lumen, while the ST segment on C ECG remained unchanged. In conclusion, UHR ECG enabled earlier detection of transmural MIS compared to C ECG. PSD in the HF channel of UHR ECG demonstrated greater sensitivity in the settings of subendocardial ischemia.

Keywords: electrocardiography; heart; ischemia; ischemic heart disease; power spectral density; reperfusion; risk stratification; sensitivity; subclinical atherosclerosis; ultra-high-resolution electrocardiography.


Conflict of interest statement

The authors declare no conflict of interest. The funders had no role in the design of the study; in the collection, analyses, or interpretation of data; in the writing of the manuscript; or in the decision to publish the results.

Figures

Figure 1
Figure 1
New technique of UHR ECG. (a) Comparison of magnitude (U, μV) and frequency (f) ranges used for the analysis in different types of ECG; (b) the scheme of two-channel signal processing system utilized in UHR ECG; (c) the graph demonstrating the values of transmission coefficient (K) expressed in decibels (dB) depending on the frequency of different channels of the analogous ECG processing device according to UHR ECG method; examples of frequency characteristics of different channels include low-frequency (1, 2), high-frequency (3, 4), and controlled band filters (5, 6); (d) oscillograms showing time-dependent changes in voltage (U(t)) of the signals in the module of analogous signal processing according to UHR ECG, i.e., the signal at the input to the module (plot 1), the signal at the output of the LF channel (plot 2), and the signal at the output of the HF channel (plot 3, in red).
Figure 2
Figure 2
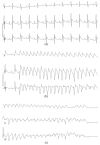
Representative C ECG recordings in the standard leads (I-III) showing ischemic ventricular tachyarrhythmias in rats with LCA occlusion. ECG was registered in the standard leads at a speed of 100.0 mm/s. (a) ECG at baseline; (b) an episode of ventricular tachycardia; and (c) ventricular fibrillation with asystole.
Figure 3
Figure 3
Anatomical area at risk detection and quantification in rats subjected to LCA occlusion (n = 18). (a) Representative transverse cardiac slice taken from Evans blue-stained heart showing the anatomical area at risk (Evans blue-negative tissue); (b) the same slice after software-assisted delineation of the anatomical area at risk; and (c) numerical data on the size of the anatomical area at risk expressed as a percentage of the entire surface of the slices.
Figure 4
Figure 4
Detection of acute transmural ischemia in rats (n = 18) using C ECG (standard lead II) versus UHR ECG. (a) General view of the experimental setup; (b) numerical values of signal power P (mW) in the HF channel of UHR ECG at baseline and at different timepoints of ischemia; (c) representative C ECG recording at baseline; (d) representative pattern of power spectral density S(f) at baseline; (e) representative C ECG recording at 1 min after coronary occlusion; (f) representative pattern of power spectral density S(f) at 1 min after coronary occlusion (in red; baseline level is marked in blue); (g) representative C ECG recording at 3 min after coronary occlusion showing the ST segment elevation; (h) representative pattern of power spectral density S(f) at 3 min after coronary occlusion (in red; baseline level is marked in blue). * indicates p < 0.01 when data are compared to that for the baseline (BI); ** indicates p < 0.01 when data are compared to that for 1 min.
Figure 5
Figure 5
Detection of subendocardial and transmural ischemia in pigs (n = 3) using C ECG (standard lead III) versus UHR ECG. (a) General view of the experimental setup; (b) numerical values of signal power P (mW) in the HF channel of UHR ECG at baseline (BI) and at different grades of coronary flow reduction, as well as at reperfusion (REP); (c) representative C ECG recording at baseline; (d) representative pattern of power spectral density S(f) at baseline; (e) representative C ECG recording at 25% flow reduction; (f) representative pattern of power spectral density S(f) at 25% flow reduction (in red; baseline level is marked in blue); (g) representative C ECG recording at 50% flow reduction showing downslope ST segment depression; (h) representative pattern of power spectral density S(f) at 50% flow reduction; (i) representative C ECG recording at 75% flow reduction; (j) representative pattern of power spectral density S(f) at 75% flow reduction; (k) representative pattern of power spectral density S(f) at 100% flow reduction; (l) representative pattern of power spectral density S(f) at 100% flow reduction; (m) representative C ECG recording at reperfusion showing partial resolution of ST segment depression; (n) representative pattern of power spectral density S(f) at reperfusion (in orange; baseline level is marked in blue). * indicates p < 0.01 when data are compared to that for the baseline (BI); ** indicates p < 0.01 when data are compared to that for the 100% flow reduction.
Figure 5
Figure 5
Detection of subendocardial and transmural ischemia in pigs (n = 3) using C ECG (standard lead III) versus UHR ECG. (a) General view of the experimental setup; (b) numerical values of signal power P (mW) in the HF channel of UHR ECG at baseline (BI) and at different grades of coronary flow reduction, as well as at reperfusion (REP); (c) representative C ECG recording at baseline; (d) representative pattern of power spectral density S(f) at baseline; (e) representative C ECG recording at 25% flow reduction; (f) representative pattern of power spectral density S(f) at 25% flow reduction (in red; baseline level is marked in blue); (g) representative C ECG recording at 50% flow reduction showing downslope ST segment depression; (h) representative pattern of power spectral density S(f) at 50% flow reduction; (i) representative C ECG recording at 75% flow reduction; (j) representative pattern of power spectral density S(f) at 75% flow reduction; (k) representative pattern of power spectral density S(f) at 100% flow reduction; (l) representative pattern of power spectral density S(f) at 100% flow reduction; (m) representative C ECG recording at reperfusion showing partial resolution of ST segment depression; (n) representative pattern of power spectral density S(f) at reperfusion (in orange; baseline level is marked in blue). * indicates p < 0.01 when data are compared to that for the baseline (BI); ** indicates p < 0.01 when data are compared to that for the 100% flow reduction.

References

    1. Roth G.A., Mensah G.A., Johnson C.O., Addolorato G., Ammirati E., Baddour L.M., Barengo N.C., Beaton A.Z., Benjamin E.J., Benziger C.P., et al. Global burden of cardiovascular diseases and risk factors, 1990-2019: Update from the GBD 2019 study. J. Am. Coll. Cardiol. 2020;76:2982–3021. doi: 10.1016/j.jacc.2020.11.010. - DOI - PMC - PubMed
    1. Dai H., Much A.A., Maor E., Asher E., Younis A., Xu Y., Lu Y., Liu X., Shu J., Bragazzi N.L. Global, regional, and national burden of ischaemic heart disease and its attributable risk factors, 1990-2017: Results from the Global Burden of Disease Study 2017. Eur. Heart J. Qual. Care Clin. Outcomes. 2022;8:50–60. doi: 10.1093/ehjqcco/qcaa076. - DOI - PMC - PubMed
    1. Tsao C.W., Aday A.W., Almarzooq Z.I., Anderson C.A.M., Arora P., Avery C.L., Baker-Smith C.M., Beaton A.Z., Boehme A.K., Buxton A.E., et al. Heart disease and stroke statistics-2023 update: A report from the American Heart Association. Circulation. 2023;147:e93–e621. doi: 10.1161/CIR.0000000000001123. - DOI - PubMed
    1. Ibanez B., Fernandez-Ortiz A., Fernandez-Friera L., Garcia-Lunar I., Andres V., Fuster V. Progression of early subclinical atherosclerosis (PESA) study: JACC focus seminar 7/8. J. Am. Coll. Cardiol. 2021;78:156–179. doi: 10.1016/j.jacc.2021.05.011. - DOI - PubMed
    1. Gianrossi R., Detrano R., Mulvihill D., Lehmann K., Dubach P., Colombo A., McArthur D., Froelicher V. Exercise-induced ST depression in the diagnosis of coronary artery disease. A meta-analysis. Circulation. 1989;80:87–98. doi: 10.1161/01.CIR.80.1.87. - DOI - PubMed