. 2023 Sep 1;13(17):2842.
doi: 10.3390/diagnostics13172842.

Quantitative Chest X-ray Radiomics for Therapy Response Monitoring in Patients with Pulmonary Tuberculosis

Affiliations

Quantitative Chest X-ray Radiomics for Therapy Response Monitoring in Patients with Pulmonary Tuberculosis

Tamarisk Du Plessis et al. Diagnostics (Basel). .

Abstract

Tuberculosis (TB) remains the second leading cause of death globally from a single infectious agent, and there is a critical need to develop improved imaging biomarkers and aid rapid assessments of responses to therapy. We aimed to utilize radiomics, a rapidly developing image analysis tool, to develop a scoring system for this purpose. A chest X-ray radiomics score (RadScore) was developed by implementing a unique segmentation method, followed by feature extraction and parameter map construction. Signature parameter maps that showed a high correlation to lung pathology were consolidated into four frequency bins to obtain the RadScore. A clinical score (TBscore) and a radiological score (RLscore) were also developed based on existing scoring algorithms. The correlation between the change in the three scores, calculated from serial X-rays taken while patients received TB therapy, was evaluated using Spearman's correlation. Poor correlations were observed between the changes in the TBscore and the RLscore (0.09 (p-value = 0.36)) and the TBscore and the RadScore (0.02 (p-value = 0.86)). The changes in the RLscore and the RadScore had a much stronger correlation of 0.22, which is statistically significant (p-value = 0.02). This shows that the developed RadScore has the potential to be a quantitative monitoring tool for responses to therapy.

Keywords: chest X-rays; feature extraction; radiomics; radiomics score; segmentation; tuberculosis.


Conflict of interest statement

The authors declare no conflict of interest.

Figures
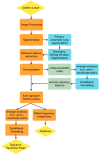
Figure 1
Figure 1
A schematic overview of the process followed to develop a radiomics score (RadScore) in this study.
Figure 2
Figure 2
An example of the output of the primary segmentation model, (a) The original image, (b) The mask (multiplied by 255 to be visually visible) and (c) The mask multiplied with the original image. This image was used to evaluate the accuracy of the primary segmentation model [23].
Figure 3
Figure 3
First order feature parameter maps for the single baseline CXR of Patient A; (a) 10th Percentile, (b) 90th Percentile, (c) Energy, (d) Entropy, (e) Interquartile range, (f) Kurtosis, (g) Maximum, (h) Mean, (i) Mean Absolute Deviation, (j) Median, (k) Minimum, (l) Range, (m) Robust Mean Absolute Deviation, (n) Root Mean Square, (o) Skewness, (p) Total Energy, (q) Uniformity and (r) Variance.
Figure 3
Figure 3
First order feature parameter maps for the single baseline CXR of Patient A; (a) 10th Percentile, (b) 90th Percentile, (c) Energy, (d) Entropy, (e) Interquartile range, (f) Kurtosis, (g) Maximum, (h) Mean, (i) Mean Absolute Deviation, (j) Median, (k) Minimum, (l) Range, (m) Robust Mean Absolute Deviation, (n) Root Mean Square, (o) Skewness, (p) Total Energy, (q) Uniformity and (r) Variance.
Figure 4
Figure 4
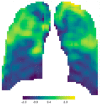
Signature parameter map obtained for Patient A’s baseline CXR.
Figure 5
Figure 5
(a) Plot of frequency proportions in the baseline CXR of Patient A indicating the four groups used to obtain a radiomics score and (b) Plot of the frequency proportions in the corresponding follow-up CXR of Patient A.
Figure 6
Figure 6
Graph indicating the number of patients who showed a decline, no change or an improvement in their TBscore, RLscore and RadScore.
Figure 7
Figure 7
Plot of correlation between the TBscore and RLscore.
Figure 8
Figure 8
Plot of correlation between the TBscore and RadScore.
Figure 9
Figure 9
Plot of correlation between the RLscore and RadScore.
Figure 10
Figure 10
The radiomic signature parameter map (a) correlates strongly to the lung pathology on the CXR (b).

References

    1. WHO . Global Tuberculosis Report 2021. World Health Organization; Geneva, Switzerland: 2021.
    1. Melendez J., van Ginneken B., Maduskar P., Philipsen R.H.H.M., Ayles H., Sánchez C.I. On Combining Multiple-Instance Learning and Active Learning for Computer-Aided Detection of Tuberculosis. IEEE Trans. Med. Imaging. 2016;35:1013–1024. doi: 10.1109/TMI.2015.2505672. - DOI - PubMed
    1. Santosh K.C., Antani S. Automated Chest X-ray Screening: Can Lung Region Symmetry Help Detect Pulmonary Abnormalities? IEEE Trans. Med. Imaging. 2018;37:1168–1177. doi: 10.1109/TMI.2017.2775636. - DOI - PubMed
    1. Chassagnon G., Vakalopoulou M., Paragios N., Revel M.P. Artificial intelligence applications for thoracic imaging. Eur. J. Radiol. 2020;123:108774. doi: 10.1016/j.ejrad.2019.108774. - DOI - PubMed
    1. Stephen S.F.Y., Hugo J.W.L.A. Applications and limitations of radiomics. Phys. Med. Biol. 2016;61:R150–R166. doi: 10.1088/0031-9155/61/13/R150. - DOI - PMC - PubMed

LinkOut - more resources