Review
. 2023 Aug 25;12(17):5538.
doi: 10.3390/jcm12175538.

Systematic Literature Review Shows Gaps in Data on Global Prevalence and Birth Prevalence of Sickle Cell Disease and Sickle Cell Trait: Call for Action to Scale Up and Harmonize Data Collection

Affiliations
Review

Systematic Literature Review Shows Gaps in Data on Global Prevalence and Birth Prevalence of Sickle Cell Disease and Sickle Cell Trait: Call for Action to Scale Up and Harmonize Data Collection

Raffaella Colombatti et al. J Clin Med. .

Erratum in

Abstract

Sickle cell disease (SCD) is an inherited monogenic disorder with high prevalence throughout sub-Saharan Africa, the Mediterranean basin, the Middle East, and India. Sources of SCD epidemiology remain scarce and fragmented. A systematic literature review (SLR) to identify peer-reviewed studies on SCD epidemiology was performed, with a search of bibliographic databases and key conference proceedings from 1 January 2010 to 25 March 2022 (congress abstracts after 2018). The SLR followed PRISMA (Preferred Reporting Items for Systematic Reviews and Meta-Analyses) guidelines. Meta-analyses, using a binomial normal random-effects model, were performed to estimate global and regional prevalence and birth prevalence. Of 1770 journal articles and 468 abstracts screened, 115 publications met the inclusion criteria. Prevalence was highest in Africa (~800/100,000), followed by the Middle East (~200/100,000) and India (~100/100,000), in contrast to ~30/100,000 in Europe. Birth prevalence was highest in Africa (~1000/100,000) and lowest in North America (~50/100,000) and Europe (~30/100,000). This SLR confirmed that sub-Saharan and North-East Africa, India, the Middle East, and the Caribbean islands are global SCD hotspots. Publications including mortality data were sparse, and no conclusions could be drawn about mortality. The identified data were limited due to gaps in the published literature for large parts of the world population; the inconsistent reporting of SCD genotypes, diagnostic criteria, and settings; and a sparsity of peer-reviewed publications from countries with assumed high prevalence. This SLR demonstrated a lack of systematic knowledge and a need to provide uniform data collection on SCD prevalence and mortality.

Keywords: epidemiology; sickle beta-thalassemia; sickle cell anemia; sickle cell disease; sickle cell trait.


Conflict of interest statement

R.C. has received consultancy fees from Global Blood Therapeutics; advisory board honoraria from AddMedica, Novartis, Forma Therapeutics, Global Blood Therapeutics, Novo Nordisk A/S, and Vertex; and research funding from Global Blood Therapeutics. I.H., M.M. and C.B. are employees of Novo Nordisk A/S.

Figures

Figure 1
Figure 1
PRISMA diagram for the search strategy and selected studies.
Figure 2
Figure 2
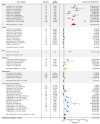
Global and regional prevalence a of SCD in Africa [22,23,24], Europe [25,26,27,28,29], India [30,31,32,33,34,35], the Middle East [36,37,38,39], and South America/the Caribbean [40]. a Within each region, the prevalence was estimated using a binomial normal model, which assumed a binomial distribution for the individual studies with a mean value drawn from a normal distribution for a regional/global value. The prevalence for each reference was determined from the log odds. A summary estimate was determined for each region with >2 studies. North America had insufficient data to determine the prevalence of SCD. I2 describes the percentage of variation across studies that was due to heterogeneity rather than chance, scored from 0 to 100%, in which 100% is maximum heterogeneity. BN, binomial normal; CI, confidence interval; SCD, sickle cell disease.
Figure 3
Figure 3
Global and regional prevalence a of sickle cell trait in Africa [22,23,24,41], Europe [26,28,42], India [30,31,32,33,34,35,43,44,45], the Middle East [36,37,38,39,46,47], and South America/the Caribbean [48,49]. a Within each region, the prevalence was estimated using a binomial normal model, which assumed a binomial distribution for the individual studies with a mean value drawn from a normal distribution for a regional/global value. The prevalence for each reference was determined from the log odds. A summary estimate was determined for each region with >2 studies. North America had insufficient data to determine the prevalence of SCD. I2 describes the percentage of variation across studies that was due to heterogeneity rather than chance, scored from 0 to 100%, in which 100% is maximum heterogeneity. BN, binomial normal; CI, confidence interval; SCD, sickle cell disease.
Figure 4
Figure 4
Global and regional birth prevalence a of SCD in Africa [23,50,51,52,53,54,55,56,57,58,59], Europe [60,61,62,63,64,65,66,67,68,69,70], India [71], the Middle East [39,72,73,74,75], North America [76,77,78,79], and South America/the Caribbean [80,81,82,83,84,85,86,87,88,89,90,91]. a Within each region, the birth prevalence was estimated using a binomial normal model, which assumed a binomial distribution for the individual studies with a mean value drawn from a normal distribution for a regional/global value. The prevalence for each reference was determined from the log odds. A summary estimate was determined for each region with >2 studies. I2 describes the percentage of variation across studies that was due to heterogeneity rather than chance, scored from 0 to 100%, in which 100% is maximum heterogeneity. BN, binomial normal; CI, confidence interval; SCD, sickle cell disease.
Figure 5
Figure 5
Global and regional birth prevalence a of sickle cell trait in Africa [23,50,51,52,53,54,57,58,59], Europe [61,63,65,66,67,68,69,70,92], India [71], the Middle East [72,73,74,75], North America [76,79,93,94], and South America/the Caribbean [80,81,82,83,85,86,87,88,89,90,91]. a Within each region, the birth prevalence was estimated using a binomial normal model, which assumed a binomial distribution for the individual studies with a mean value drawn from a normal distribution for a regional/global value. The prevalence for each reference was determined from the log odds. A summary estimate was determined for each region with >2 studies. I2 describes the percentage of variation across studies that was due to heterogeneity rather than chance, scored from 0 to 100%, in which 100% is maximum heterogeneity. BN, binomial normal; CI, confidence interval; SCD, sickle cell disease.
Figure 6
Figure 6
Worldwide prevalence a and birth prevalence of SCD. a Each country with results for the specific genotype and prevalence measure are colored according to the reported prevalence (or average if multiple results were available for the given country). Dots are placed at the center of each country (and therefore do not indicate a specific location within the country) and may have been marginally moved in a random direction in order to be able to see multiple dots if the countries are close together. SCD, sickle cell disease.
Figure 7
Figure 7
Worldwide prevalence and birth prevalence of sickle cell trait. Each country with results for the specific genotype and prevalence measure are colored according to the reported prevalence (or average if multiple results were available for the given country). Dots are placed at the center of each country (and therefore do not indicate a specific location within the country) and may have been marginally moved in a random direction in order to be able to see multiple dots if the countries are close together.
Figure 8
Figure 8
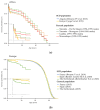
Survival curves (a,b) for all ages and for the first 15 years of life (inset) for people with SCD and matched general populations in: (a) Africa, (b) Europe, (c) the Middle East, (d) North America, and (e) South America and the Caribbean. (a) Mortality curves for SCD populations from Angola 2013 [59]; Kenya 2019 [55]; and for the general population: Tanzania—Dar Es Salaam 1994–1999 [21,95], Tanzania—Morogoro 1994–1999 [21,95], Gambia 1991–1995 [21,95], and Mozambique. (b) Mortality curves for SCD populations from France 2019 [96]; Spain 2020 [97]; the Netherlands 2021 [98]; and for the general population: France 2015 [20], Spain 2015 [20], and the Netherlands 2015 [20]. (c) Mortality curves for SCD populations from Iran 2018 [99] and for the general population: Iran 2004 [100]. (d) Mortality curves for SCD populations from USA 2014 [101]; USA 2015 [102]; USA 2016 [103]; and for the general population: USA 2015 [20]. (e) Mortality curves for SCD populations from Brazil 2015; Jamaica 2018; and for the general population: Brazil 2010 [21,104], Jamaica 2011 [21,105], and Chile 2015 [20]. (a) Steps occur at each death (if available) or end of age intervals (for age-binned data). (b) Mortality data for the general population were obtained from matched sources for the same country as and similar year(s) to the SCD study. If datasets that matched geographical locations and years were unavailable, data from neighboring countries covering the same geographical area or close in time to the SCD study were used. SCD, sickle cell disease.
Figure 8
Figure 8
Survival curves (a,b) for all ages and for the first 15 years of life (inset) for people with SCD and matched general populations in: (a) Africa, (b) Europe, (c) the Middle East, (d) North America, and (e) South America and the Caribbean. (a) Mortality curves for SCD populations from Angola 2013 [59]; Kenya 2019 [55]; and for the general population: Tanzania—Dar Es Salaam 1994–1999 [21,95], Tanzania—Morogoro 1994–1999 [21,95], Gambia 1991–1995 [21,95], and Mozambique. (b) Mortality curves for SCD populations from France 2019 [96]; Spain 2020 [97]; the Netherlands 2021 [98]; and for the general population: France 2015 [20], Spain 2015 [20], and the Netherlands 2015 [20]. (c) Mortality curves for SCD populations from Iran 2018 [99] and for the general population: Iran 2004 [100]. (d) Mortality curves for SCD populations from USA 2014 [101]; USA 2015 [102]; USA 2016 [103]; and for the general population: USA 2015 [20]. (e) Mortality curves for SCD populations from Brazil 2015; Jamaica 2018; and for the general population: Brazil 2010 [21,104], Jamaica 2011 [21,105], and Chile 2015 [20]. (a) Steps occur at each death (if available) or end of age intervals (for age-binned data). (b) Mortality data for the general population were obtained from matched sources for the same country as and similar year(s) to the SCD study. If datasets that matched geographical locations and years were unavailable, data from neighboring countries covering the same geographical area or close in time to the SCD study were used. SCD, sickle cell disease.

References

    1. Kato G.J., Piel F.B., Reid C.D., Gaston M.H., Ohene-Frempong K., Krishnamurti L., Smith W.R., Panepinto J.A., Weatherall D.J., Costa F.F., et al. Sickle cell disease. Nat. Rev. Dis. Prim. 2018;4:18010. doi: 10.1038/nrdp.2018.10. - DOI - PubMed
    1. Piel F.B., Steinberg M.H., Rees D.C. Sickle Cell Dis. N. Engl. J. Med. 2017;376:1561–1573. doi: 10.1056/NEJMra1510865. - DOI - PubMed
    1. Kanter J., Kruse-Jarres R. Management of sickle cell disease from childhood through adulthood. Blood Rev. 2013;27:279–287. doi: 10.1016/j.blre.2013.09.001. - DOI - PubMed
    1. Ranque B., Kitenge R., Ndiaye D.D., Ba M.D., Adjoumani L., Traore H., Coulibaly C., Guindo A., Boidy K., Mbuyi D., et al. Estimating the risk of child mortality attributable to sickle cell anaemia in sub-Saharan Africa: A retrospective, multicentre, case-control study. Lancet Haematol. 2022;9:e208–e216. doi: 10.1016/S2352-3026(22)00004-7. - DOI - PubMed
    1. Lubeck D., Agodoa I., Bhakta N., Danese M., Pappu K., Howard R., Gleeson M., Halperin M., Lanzkron S. Estimated life expectancy and income of patients with sickle cell disease compared with those without sickle cell disease. JAMA Netw. Open. 2019;2:e1915374. doi: 10.1001/jamanetworkopen.2019.15374. - DOI - PMC - PubMed

LinkOut - more resources