. 2023 Aug 30;24(17):13450.
doi: 10.3390/ijms241713450.

RNA-Seq and Comparative Transcriptomic Analyses of Asian Soybean Rust Resistant and Susceptible Soybean Genotypes Provide Insights into Identifying Disease Resistance Genes

Affiliations

RNA-Seq and Comparative Transcriptomic Analyses of Asian Soybean Rust Resistant and Susceptible Soybean Genotypes Provide Insights into Identifying Disease Resistance Genes

Qingnan Hao et al. Int J Mol Sci. .

Abstract

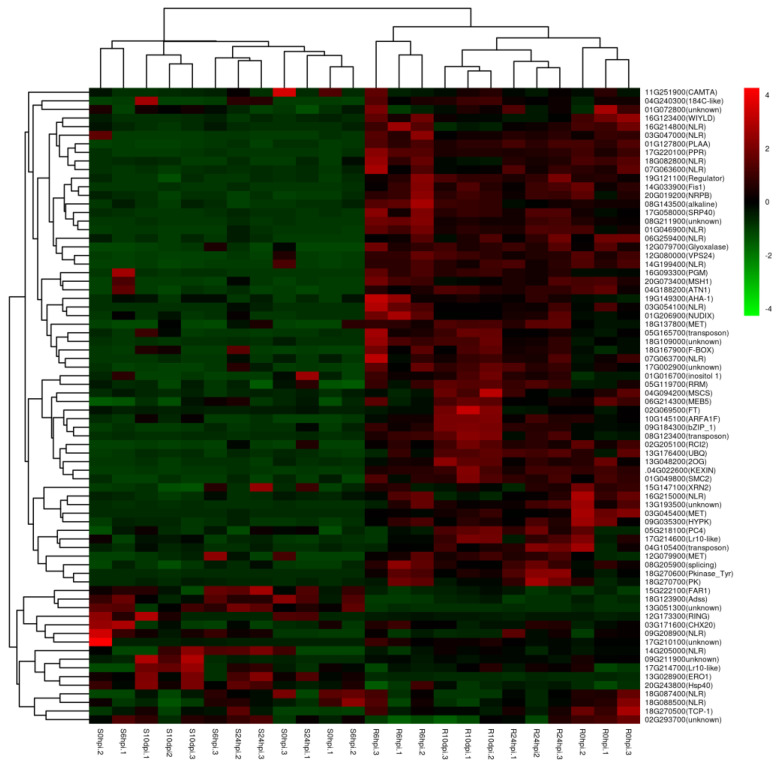
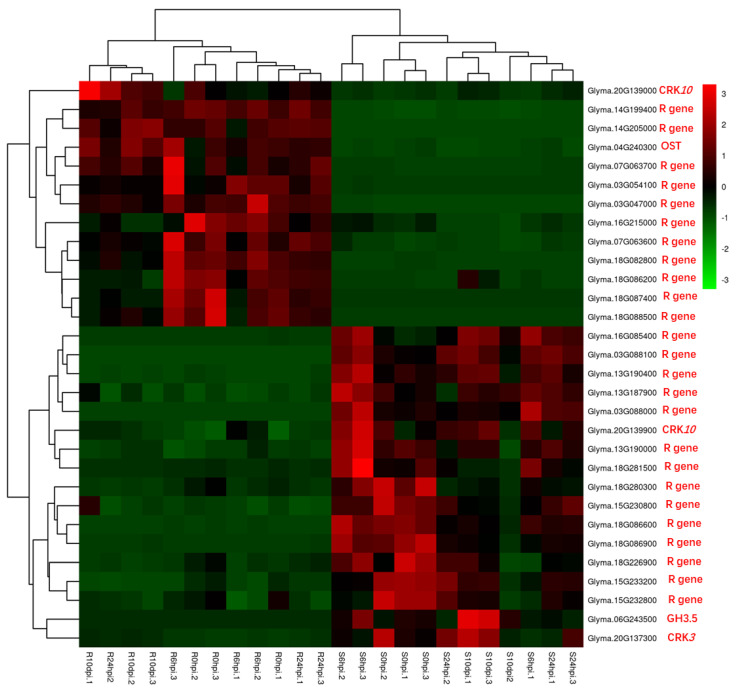
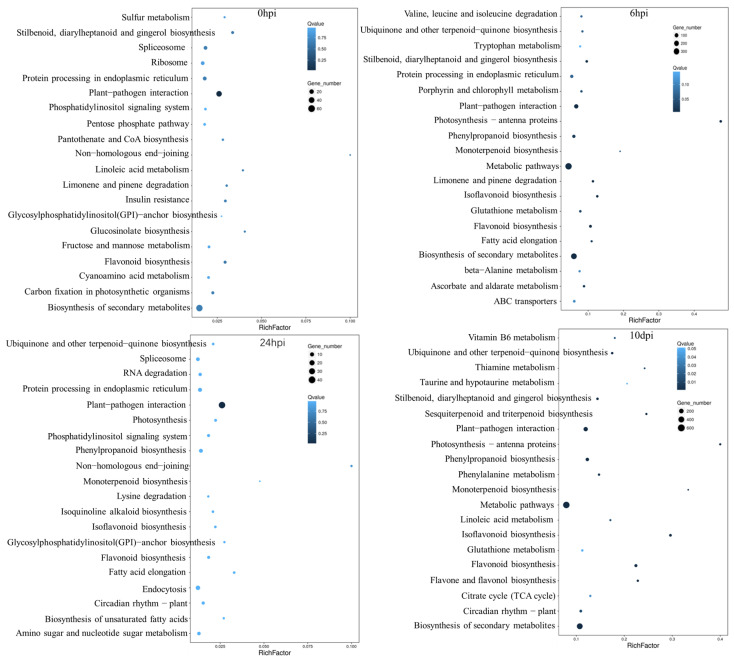
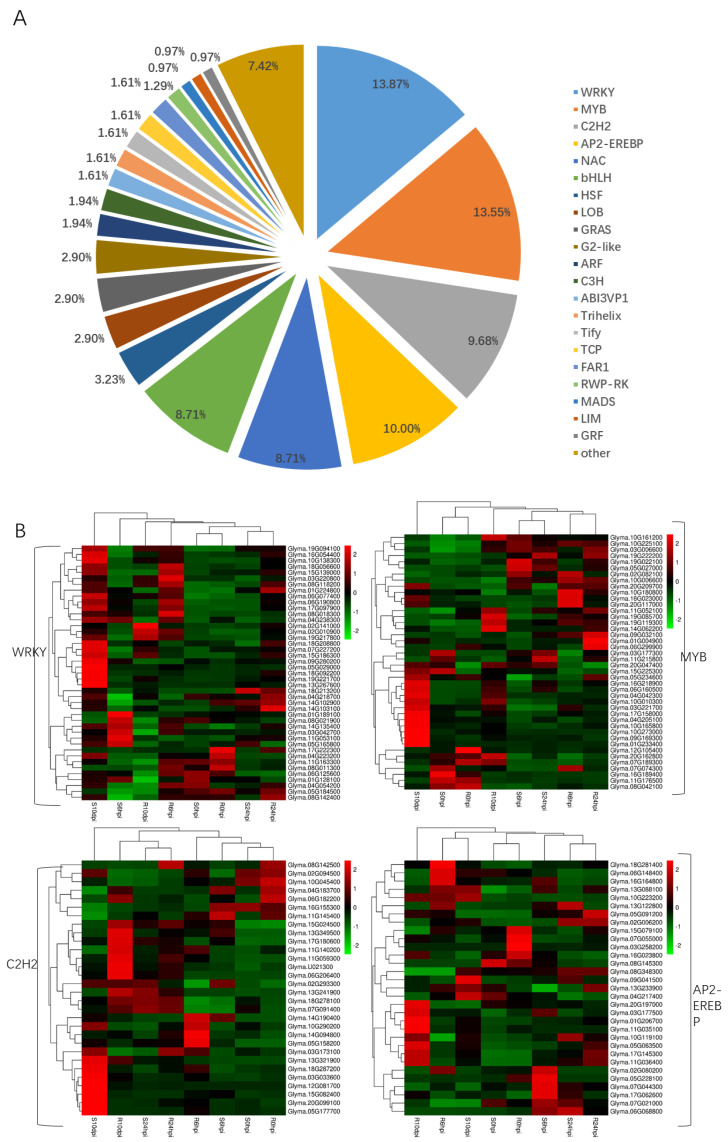
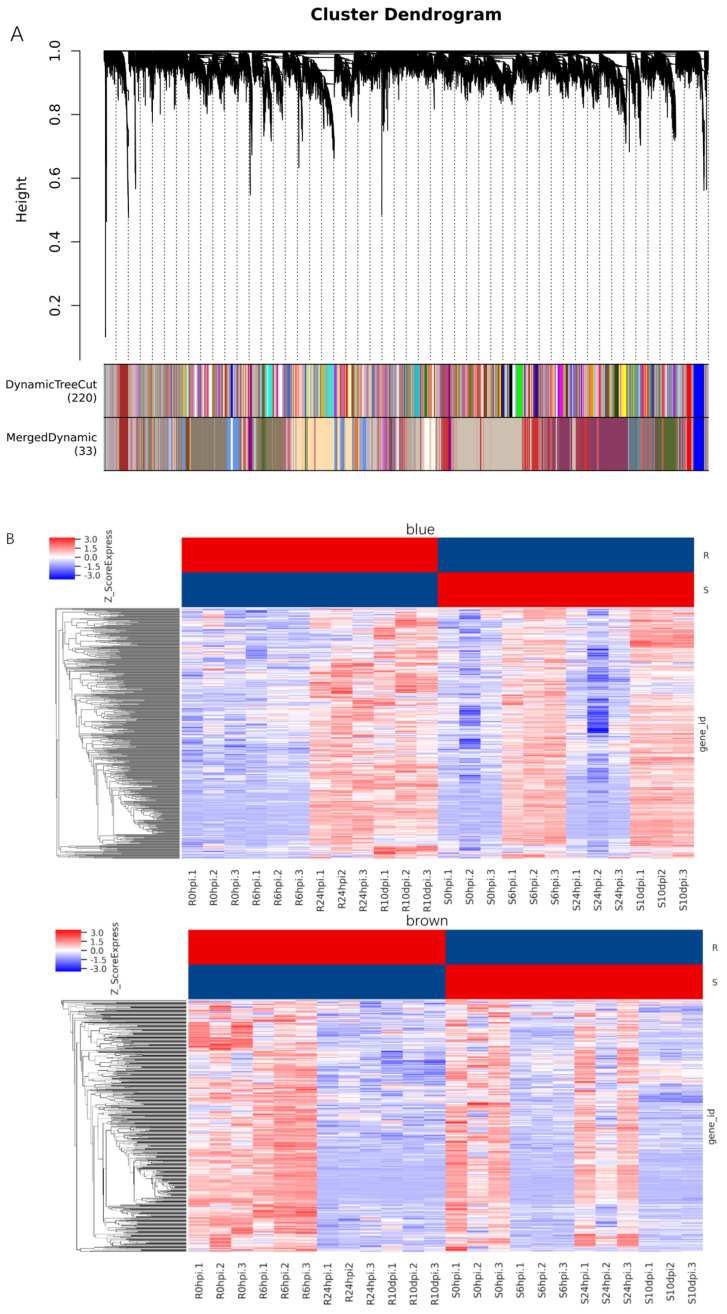
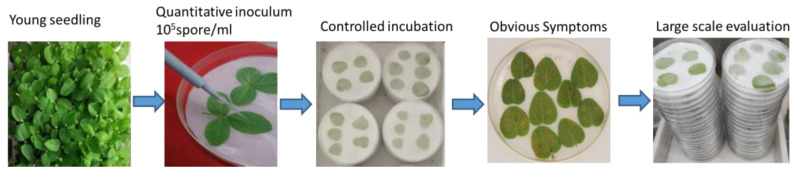
Asian soybean rust (ASR), caused by Phakopsora pachyrhizi, is one of the most destructive foliar diseases that affect soybeans. Developing resistant cultivars is the most cost-effective, environmentally friendly, and easy strategy for controlling the disease. However, the current understanding of the mechanisms underlying soybean resistance to P. pachyrhizi remains limited, which poses a significant challenge in devising effective control strategies. In this study, comparative transcriptomic profiling using one resistant genotype and one susceptible genotype was performed under infected and control conditions to understand the regulatory network operating between soybean and P. pachyrhizi. RNA-Seq analysis identified a total of 6540 differentially expressed genes (DEGs), which were shared by all four genotypes. The DEGs are involved in defense responses, stress responses, stimulus responses, flavonoid metabolism, and biosynthesis after infection with P. pachyrhizi. A total of 25,377 genes were divided into 33 modules using weighted gene co-expression network analysis (WGCNA). Two modules were significantly associated with pathogen defense. The DEGs were mainly enriched in RNA processing, plant-type hypersensitive response, negative regulation of cell growth, and a programmed cell death process. In conclusion, these results will provide an important resource for mining resistant genes to P. pachyrhizi infection and valuable resources to potentially pyramid quantitative resistance loci for improving soybean germplasm.

Keywords: Asian soybean rust; RNA-seq; WGCNA; soybean.


Conflict of interest statement

The authors declare no conflict of interest.

Figures

Figure 1
Figure 1
Asian soybean rust resistant phenotypes’ microscopic observation of SS4 growth. (A) Asian soybean rust resistant phenotypes of SX6907 and tianlong1 at seedling stages. (B) Microscopic observation of pathogen development in SX6907 and tianlong1 at different time points after SS4 infection. Urediospores (u), germ tube (Gt), appressorium (Ap), primary invasive hypha (pih), penetration hypha (ph), invasive hyphae (ih), sporogenous hyphae (sph). Scale bar is 20 μm.
Figure 2
Figure 2
The relative gene expression of 10 randomly selected genes examined by quantitative real-time PCR and RNA-seq.
Figure 3
Figure 3
Whole genomic gene expression for SX6907 and tianlong1 inoculation with P. pachyrhizi at 0 h, 6 h, 24 h, and 10 d. The y-axis represents the gene number. The blue box means fragments per kilo bases per million reads (FPKM) > 30, the orange box means FPKM 5–30, and the gray box means FPKM 1–5.
Figure 4
Figure 4
Number of differentially expressed genes in soybeans infected by Asian soybean rust. (A) The number of differently expressed genes in SX6907 compared with tianlong1 at four time points (0 h, 6 h, 24 h, and 10 d). The y-axis represents the DEGs number. Number of DEGs was counted with the criteria p < 0.05 and log2 (fold change) > 1. (B) Venn diagram comparison of differentially expressed genes (assigned by p < 0.05 and log2 (fold change) > 1) at four infection stages (0 h, 6 h, 24 h, and 10 dpi) in SX6907 compared with tianlong1. Red highlighted numbers represent the amount of upregulated DEGs, and blue highlighted numbers represent the amount of downregulated DEGs.
Figure 5
Figure 5
Heat map showing hierarchical cluster analysis of 74 expressed genes across all samples. Gradient scale represents expression levels, with red showing the highest expression to greenwith the lowest expression.
Figure 6
Figure 6
Heat map showing expression profiles of core defense genes that could be putatively involved in resistance development against P. pachyrhizi in Pp−R. Gradient scale shows Z−scores of DEGs where red represents the most induced expression and green depicts the highest repression. Abbreviations: CRK−cysteine-rich receptor-like protein kinase; GH−indole-3-acetic acid−amido synthetase; OST−organic solute transporter; R gene−NB-ARC domain-containing disease-resistant gene.
Figure 7
Figure 7
The KEGG pathway enrichment analysis of DEGs at four time points to P. pachyrhizi infection.
Figure 8
Figure 8
Analysis of differentially expressed transcription factors in four time points. (A). The ratios of differentially expressed transcription factor families. (B). Expression levels are shown for the WRKY, MYB, C2H2, and AP2−EREBP transcription factors in resistant material and susceptible material. FPKM values are represented by color gradient. Too high = red brick.
Figure 9
Figure 9
Weighted gene co-expression network analysis (WGCNA) of differentially expressed genes. (A) Dendrogram of all differentially expressed genes clustered based on a dissimilarity measure (1−TOM). The upper part of the figure is the gene cluster Tree constructed by dissTOM matrix constructed by weighted correlation coefficients; the lower part of the figure is divided into the distribution of genes in each module, the same color represents the same module; the Dynamic TreeCut color is the module identified by dynamicTreeCut method. (B) Hierarchical clustering analysis of all differentially expressed genes (DEGs) in particular interest modules. Blue color represents downregulation of genes. Red indicates upregulation of genes.
Figure 10
Figure 10
A simple diagram of the inoculation process.

Similar articles

References

    1. Hossain M.Z., Ishiga Y., Yamanaka N., Ogiso-Tanaka E., Yamaoka Y. Soybean leaves transcriptomic data dissects the phenylpropanoid pathway genes as a defence response against Phakopsora pachyrhizi. Plant Physiol. Biochem. 2018;132:424–433. doi: 10.1016/j.plaphy.2018.09.020. - DOI - PubMed
    1. Slaminko T.L., Miles M.R., Frederick R.D., Bonde M.R., Hartman G.L. New legume hosts of Phakopsora pachyrhizi based on greenhouse evaluations. Plant Dis. 2008;92:767–771. doi: 10.1094/pdis-92-5-0767. - DOI - PubMed
    1. Akamatsu H., Yamanaka N., Soares R.M., Ivancovich A., Kato M. Pathogenic variation of south American Phakopsora pachyrhizi populations isolated from soybeans from 2010 to 2015. Jpn. Agric. Res. Q. Jarq. 2017;51:221–232. doi: 10.6090/jarq.51.221. - DOI
    1. Godoy C., de Freitas Bueno A., Gazziero D. Brazilian soybean pest management and threats to its sustainability. Outlooks Pest Manag. 2015;26:113–117. doi: 10.1564/v26_jun_06. - DOI
    1. Vuong T.D., Walker D.R., Nguyen B.T., Nguyen T.T., Dinh H.X., Hyten D.L., Cregan P.B., Sleper D.A., Lee J.D., Shannon J.G., et al. Molecular characterization of resistance to soybean rust (Phakopsora pachyrhizi Syd. & Syd.) in soybean cultivar DT 2000 (PI 635999) PLoS ONE. 2016;11:e0164493. doi: 10.1371/journal.pone.0164493. - DOI - PMC - PubMed

LinkOut - more resources