. 2023 Aug 30;24(17):13484.
doi: 10.3390/ijms241713484.

Prenatal Alcohol Exposure Impairs the Placenta-Cortex Transcriptomic Signature, Leading to Dysregulation of Angiogenic Pathways

Affiliations

Prenatal Alcohol Exposure Impairs the Placenta-Cortex Transcriptomic Signature, Leading to Dysregulation of Angiogenic Pathways

Camille Sautreuil et al. Int J Mol Sci. .

Abstract

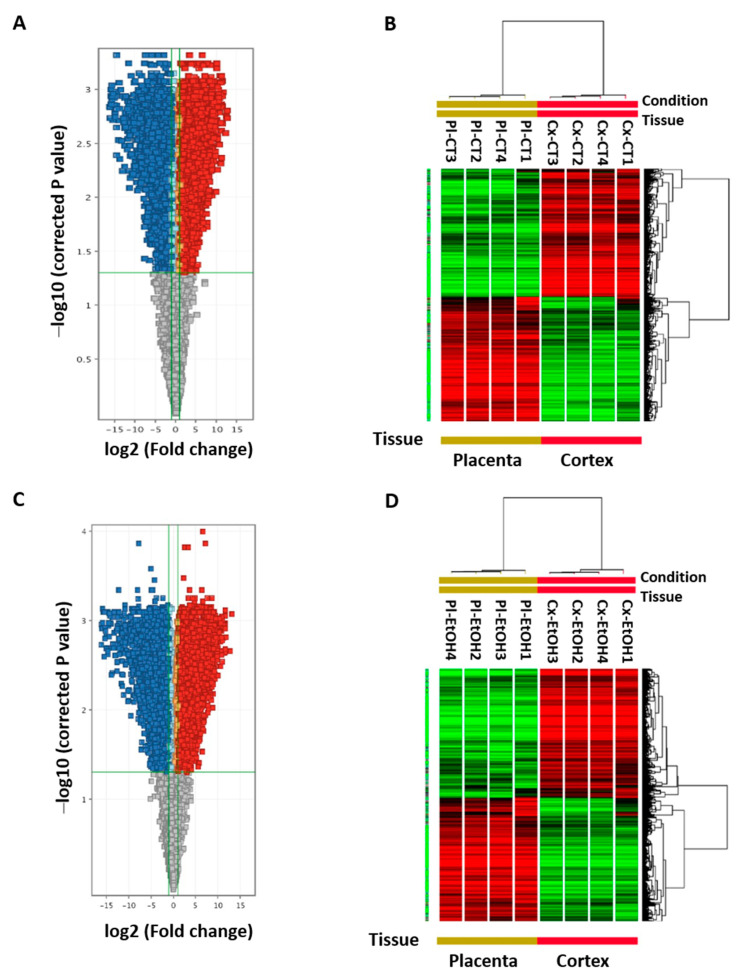
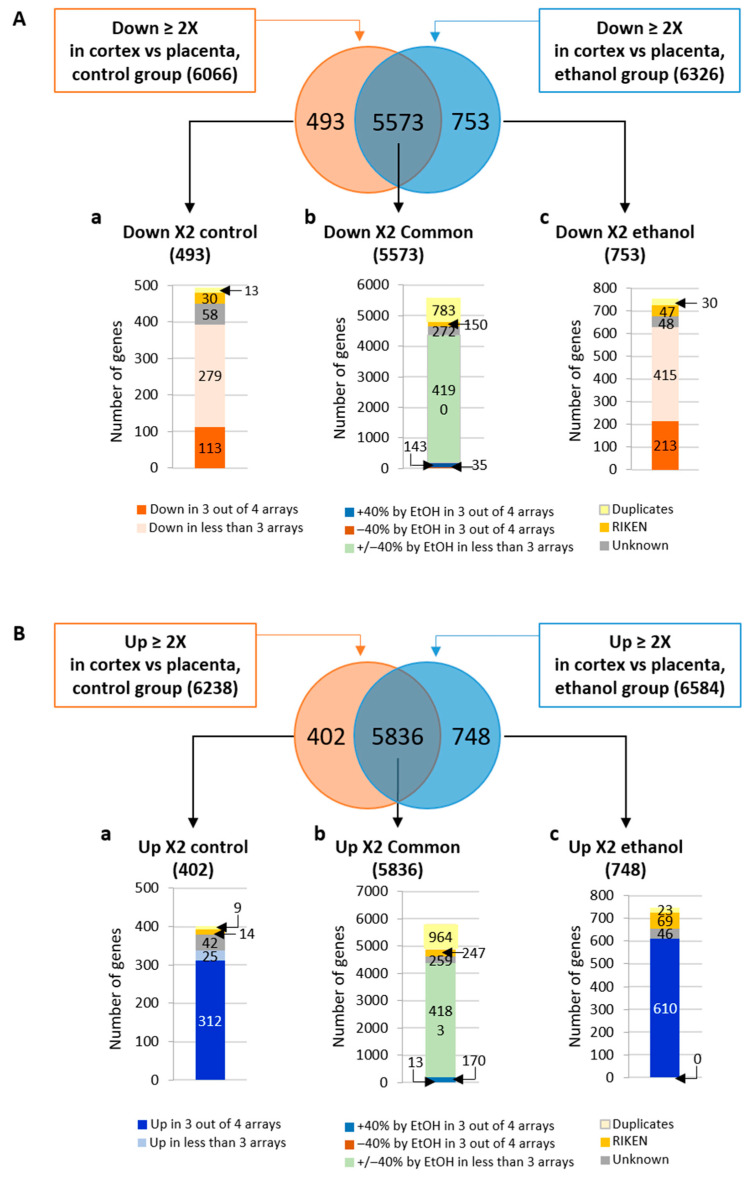
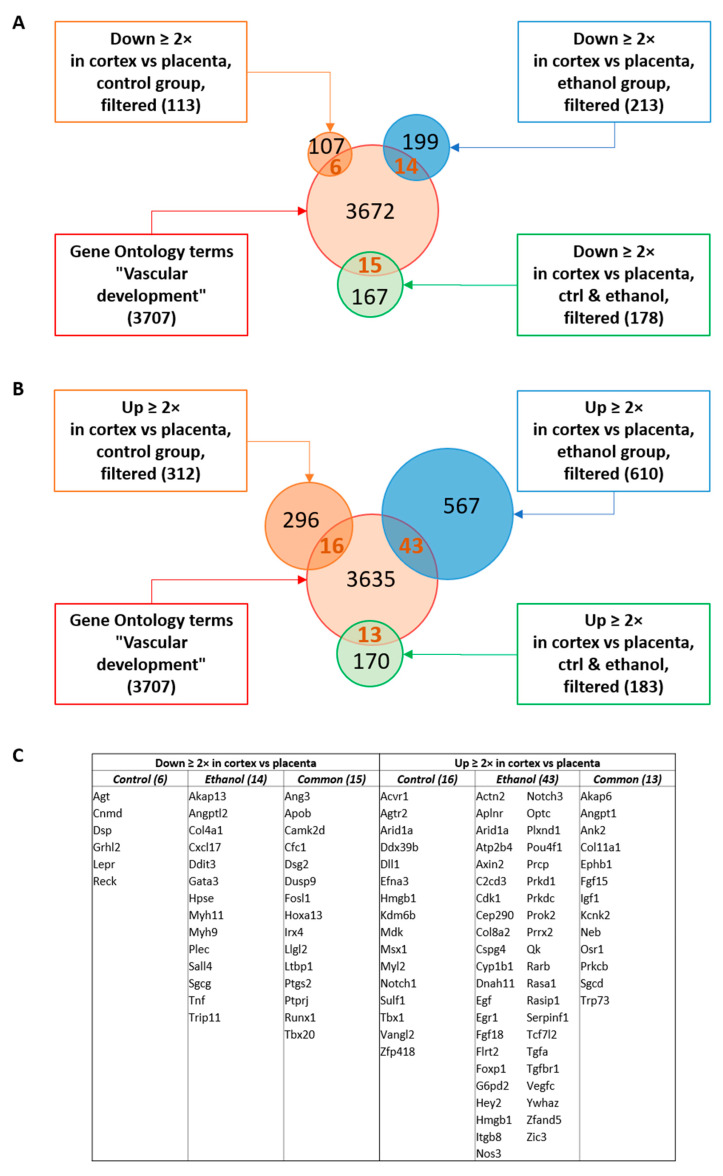
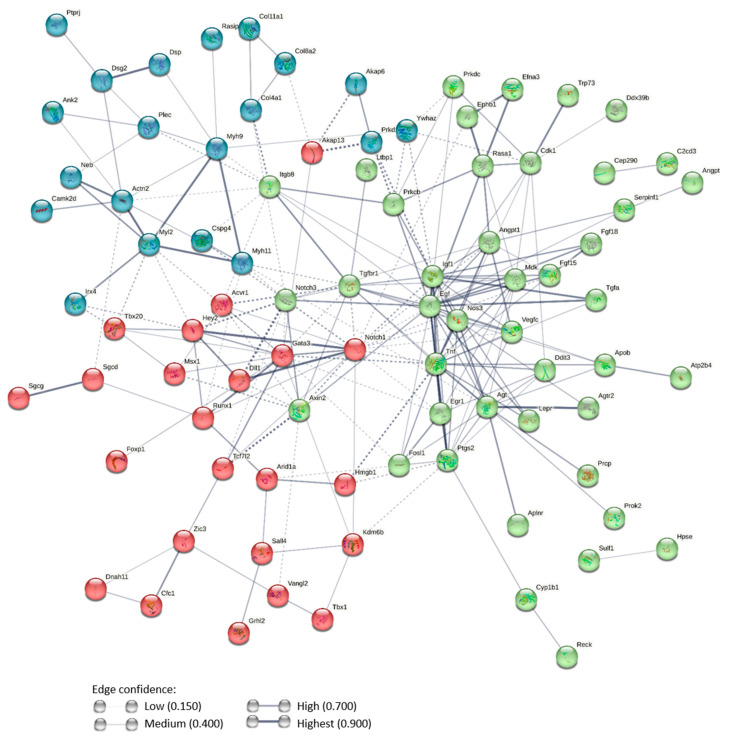
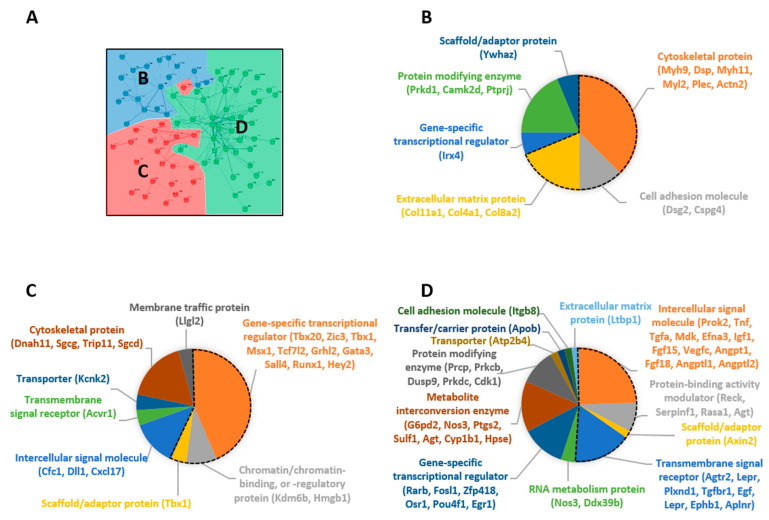
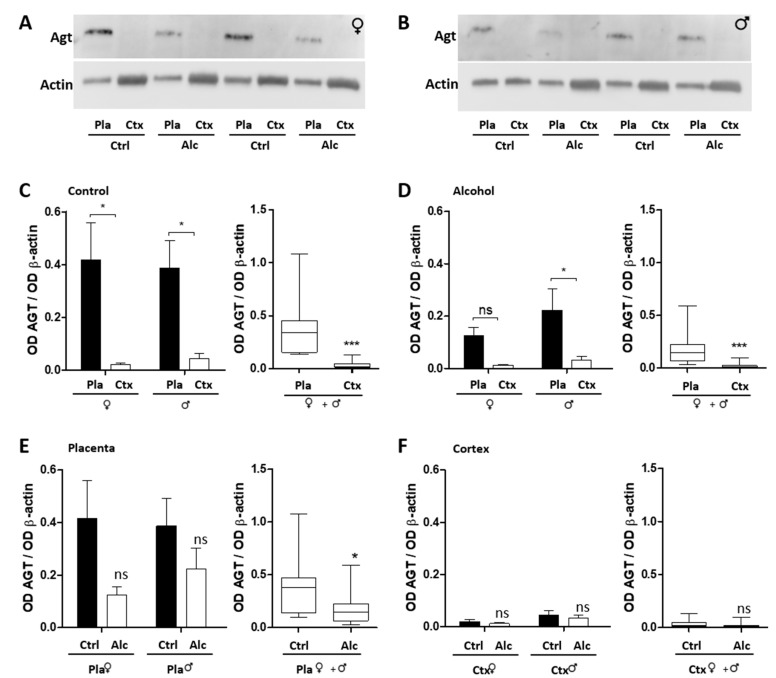
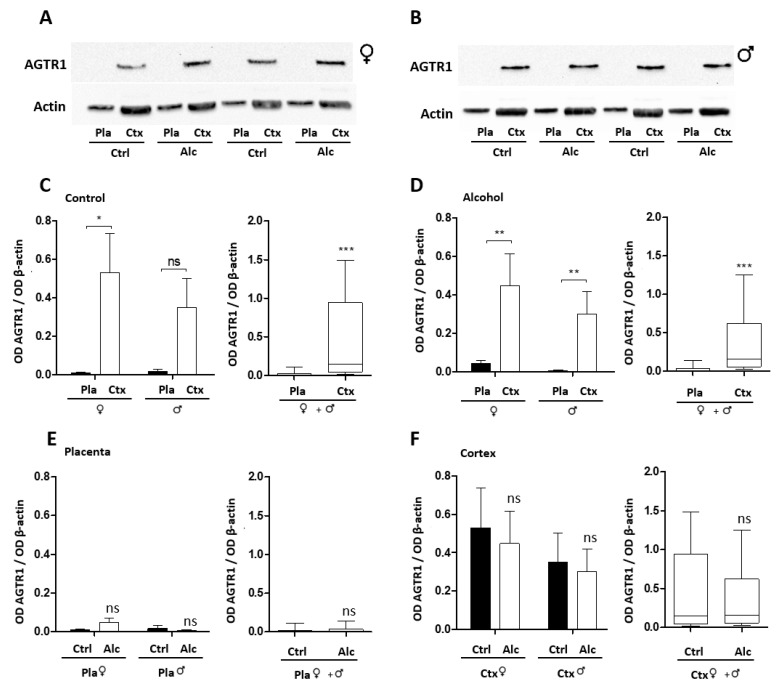
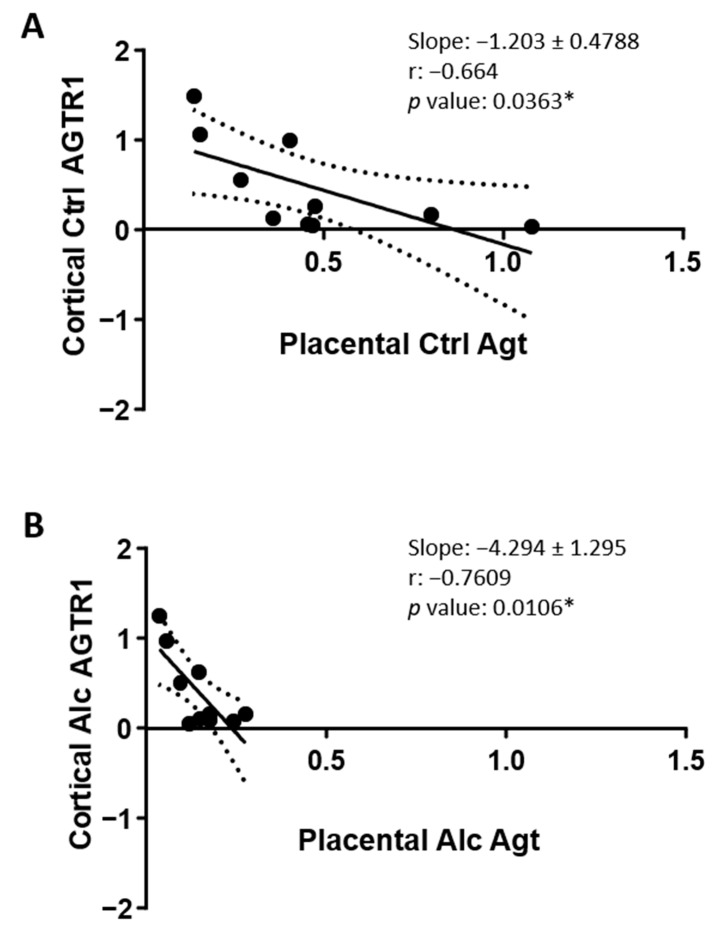
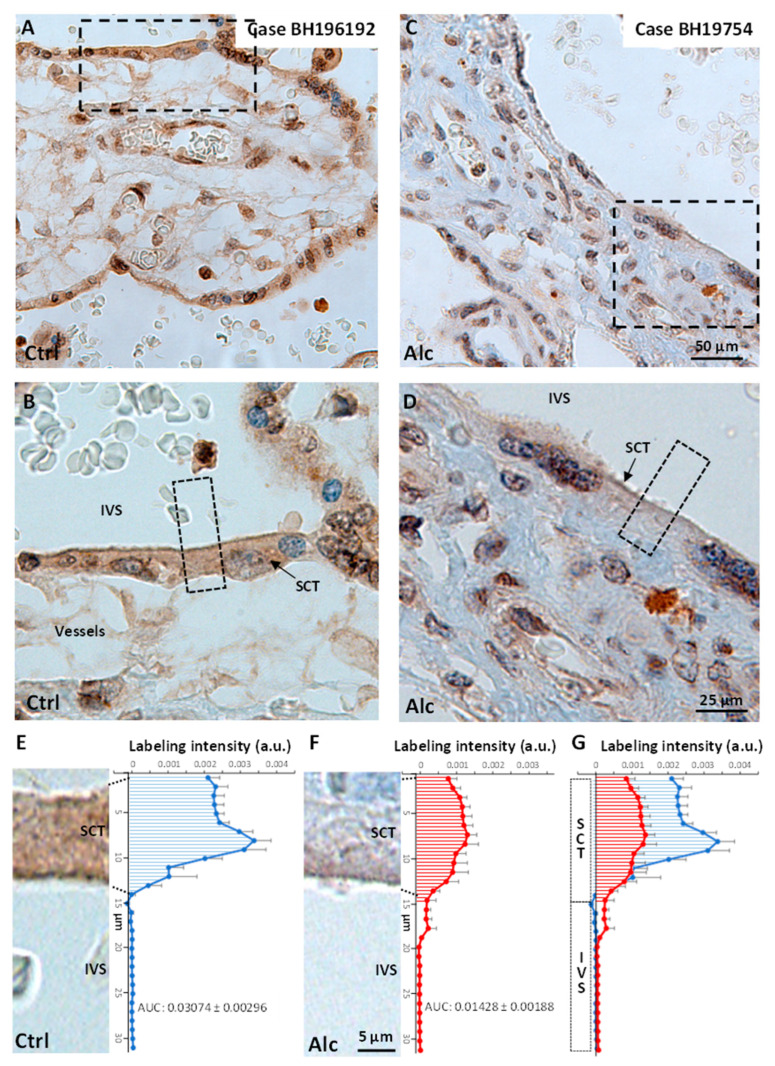
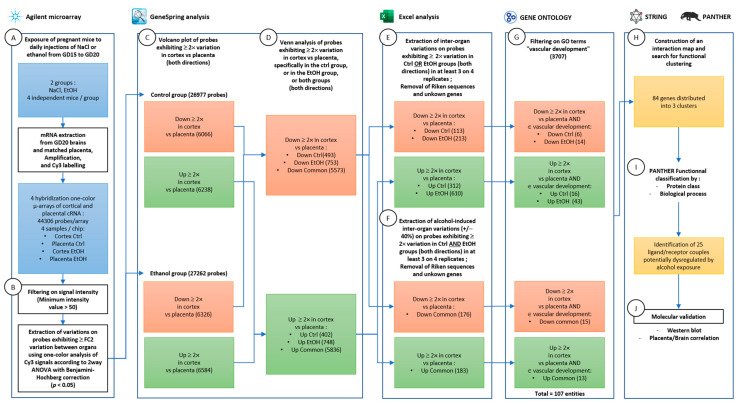
Although alcohol consumption during pregnancy is a major cause of behavioral and learning disabilities, most FASD infants are late- or even misdiagnosed due to clinician's difficulties achieving early detection of alcohol-induced neurodevelopmental impairments. Neuroplacentology has emerged as a new field of research focusing on the role of the placenta in fetal brain development. Several studies have reported that prenatal alcohol exposure (PAE) dysregulates a functional placenta-cortex axis, which is involved in the control of angiogenesis and leads to neurovascular-related defects. However, these studies were focused on PlGF, a pro-angiogenic factor. The aim of the present study is to provide the first transcriptomic "placenta-cortex" signature of the effects of PAE on fetal angiogenesis. Whole mouse genome microarrays of paired placentas and cortices were performed to establish the transcriptomic inter-organ "placenta-cortex" signature in control and PAE groups at gestational day 20. Genespring comparison of the control and PAE signatures revealed that 895 and 1501 genes were only detected in one of two placenta-cortex expression profiles, respectively. Gene ontology analysis indicated that 107 of these genes were associated with vascular development, and String protein-protein interaction analysis showed that they were associated with three functional clusters. PANTHER functional classification analysis indicated that "intercellular communication" was a significantly enriched biological process, and 27 genes were encoded for neuroactive ligand/receptors interactors. Protein validation experiments involving Western blot for one ligand-receptor couple (Agt/AGTR1/2) confirmed the transcriptomic data, and Pearson statistical analysis of paired placentas and fetal cortices revealed a negative correlation between placental Atg and cortical AGTR1, which was significantly impacted by PAE. In humans, a comparison of a 38WG control placenta with a 36WG alcohol-exposed placenta revealed low Agt immunolabeling in the syncytiotrophoblast layer of the alcohol case. In conclusion, this study establishes the first transcriptomic placenta-cortex signature of a developing mouse. The data show that PAE markedly unbalances this inter-organ signature; in particular, several ligands and/or receptors involved in the control of angiogenesis. These data support that PAE modifies the existing communication between the two organs and opens new research avenues regarding the impact of placental dysfunction on the neurovascular development of fetuses. Such a signature would present a clinical value for early diagnosis of brain defects in FASD.

Keywords: FASD; diagnosis; neurodevelopment; neuroplacentology; neurovascular.


Conflict of interest statement

The authors declare no conflicts of interest.

Figures

Figure 1
Figure 1
Comparative analysis of microarrays between GD20 placentas and matched fetal cortices in control condition and after alcohol exposure. (A,C) Volcano plots visualizing genes at least 2-fold under- (blue) or over- (red) expressed between cortex versus placenta at GD20, in control (A) and ethanol groups (C), after removal of background <50, spikes and control flags. Upon the 26,977 genic probes identified after array extraction in control condition, 6066 and 6238 probes are, respectively under- and over-expressed in the cortex compared to the placenta (A). Upon the 27,267 genic probes identified after array extraction in ethanol-exposed conditions, 6326 and 6584 probes are, respectively under- and over-expressed in the cortex compared to the placenta (C). (B,D) Hierarchical clustering of genic probes at least 2-fold under- (red) or over- (green) expressed in the cortex versus the placenta after filtration of microarrays according to Pearson coefficient metric and complete linkage.
Figure 2
Figure 2
Comparative analysis of the control and alcohol-exposed placenta–cortex signatures. (A) Venn diagram showing the number of genic probes being under-expressed in the cortex versus the placenta both in control and alcohol groups (5573), the number of genic probes under-expressed in the cortex versus placenta only in the control signature (493) and the number of genic probes under-expressed in the cortex versus placenta only in the ethanol signature (753). (B) Venn diagram showing the number of genic probes being over-expressed in the cortex versus the placenta both in control and alcohol signatures (5836), the number of genic probes over-expressed in the cortex versus placenta only in the control signature (402) and the number of genic probes over-expressed in the cortex versus placenta only in the ethanol signature (748). (ac) Histograms below each Venn diagram represent the results from filtration performed on each population. (a) Filtration on genes specifically found in the control signatures. (b) Filtration on genes commonly found in both signatures. (c) Filtration on genes specifically found in the ethanol signatures. For all categories, unknown genes, Riken sequences and duplicates were removed. For control OR ethanol-specific variations, the selection criteria were “observed in at least 3 out of 4 replicates”. For control AND ethanol common variations, the selection criteria were “ethanol induces a 40% change in the cortex/placenta ratio in at least 3 out of 4 replicates”.
Figure 3
Figure 3
Gene Ontology comparison of the control and alcohol-exposed placenta–cortex signatures with the GO terms of the “vascular development” hierarchy. (A) Venn diagram showing the interaction between GO terms “vascular development” (3707) and the genic probes being under-expressed in cortex versus placenta only in the control signature (6), the genic probes under-expressed in cortex versus placenta only in the ethanol signature (14) and in both control and alcohol signatures (15). (B) Venn diagram showing the interaction between GO terms “vascular development” (3707) and the genic probes being over-expressed in cortex versus placenta only in the control signature (16), the genic probes over-expressed in cortex versus placenta only in the ethanol signature (43), and in both control and alcohol signatures (13). (C) Lists of genic probes resulting from the bioinformatic analysis, representing 107 proteins associated with vascular development. A total of 22 proteins are under- (6) or over- (16) expressed on cortex versus placenta only in the control signature, 57 proteins are under- (14) or over- (43) expressed on the cortex versus placenta only in the alcohol signature and 28 proteins present in both signatures (common) are down (15) or up (13) dysregulated (+/− 40%) by alcohol exposure in the cortex versus placenta.
Figure 4
Figure 4
String analysis of genes from the placenta/cortex signature and dysregulated by PAE. The protein–protein interaction (PPI) network was constructed from the 107 proteins identified through the vascular development analysis. The color of nodes is representative of three functional clusters, while the thickness of edges represents the degree of confidence. Solid lines represent PPI within a cluster. Dotted lines represent PPI between clusters.
Figure 5
Figure 5
PANTHER functional classification of String clusters by protein class. Annotation and functional classification of proteins belonging to each String cluster was performed using the PANTHER Classification System (Protein ANalysis THrough Evolutionary Relationships; www.pantherdb.org (accessed on 17 January 2023) version 17.0). (A) Color map visualizing each cluster submitted to PANTHER analysis. (B) Among the 16 assigned proteins of the blue-node cluster (20 proteins), more than two-thirds (11 proteins) are involved in cell structure and cell adhesion (dotted black line). (C) Among the 23 assigned proteins of the red-node cluster (28 proteins), 13 are regulators of transcriptional activity (dotted black line). (D) Among the 34 assigned proteins of the green-node cluster (42 proteins), 25 are intercellular communication molecules (signal molecules or transmembrane receptors; dotted black line). Among the 3 clusters, 14 ligands and 13 receptors have been identified and constitute candidates representative of a PAE-dysregulated placenta–cortex communication.
Figure 6
Figure 6
Protein validation of angiotensinogen expression in paired placenta/cortex extracts from control and alcohol-exposed mice. (A,B) Western blots visualizing the relative expression of angiotensinogen in placentas and paired cortices of females (A) and males (B) fetuses from control and alcohol-exposed mice. (C) Quantification of the relative placenta/cortex expression of angiotensinogen in females and males of the control group. *, p < 0.05; ***, p < 0.001 vs. Placenta. (D) Quantification of the relative placenta/cortex expression of angiotensinogen in females and males of the PAE group. *, p < 0.05; ***, p < 0.001 vs. Placenta. (E) Comparison of angiotensinogen expression in female and male placentas of control and PAE mice. *, p < 0.05 vs. Control. (F) Comparison of angiotensinogen expression in female and male cortices of control and PAE fetuses.
Figure 7
Figure 7
Protein validation of AGTR1 receptor expression in paired placenta/cortex extracts from control and alcohol-exposed mice. (A,B) Western blots visualizing the relative expression of AGTR1 in placentas and paired cortices of female (A) and male (B) fetuses from control and alcohol-exposed mice. (C) Quantification of the relative placenta/cortex expression of AGTR1 in females and males in the control group. *, p < 0.05; ***, p < 0.001 vs. Placenta. (D) Quantification of the relative placenta/cortex expression of AGTR1 in females and males in the PAE group. **, p < 0.01; ***, p < 0.001 vs. Placenta. (E) Comparison of AGTR1 expression in female and male placentas in control and PAE mice. (F) Comparison of AGTR1 expression in female and male cortices of control and PAE fetuses.
Figure 8
Figure 8
Pearson correlation analysis between placental AGT expression and cortical AGTR1 expression. (A) Graph visualizing the paired expression of placental AGT and cortical AGTR1 in the control group. (B) Graph visualizing the paired expression of placental AGT and cortical AGTR1 in the PAE group. *, p < 0.05.
Figure 9
Figure 9
Angiotensinogen immunoreactivity in human placentas from control and alcohol-exposed cases. (A,B) Visualization at low (A) and high (B) magnifications of angiotensinogen immunolabeling in villi of a control case. (C,D) Visualization at low (C) and high (D) magnifications of angiotensinogen immunolabeling in placental villi from an alcohol-consuming woman. (E,F) Scanline analysis of the intensity profile of angiotensinogen immunolabeling in the syncytiotrophoblastic layer of a control case (E) and an alcohol-consuming woman (F). (G) Overlay of the two scanline intensity profiles. Hatched areas represent the integrated zone used to measure the area under the curves (AUC). SCT: syncytiotrophoblast; IVS: Intervillous space. Dotted rectangles visualize regions shown at higher magnification.
Figure 10
Figure 10
Experimental design of the study. (A) The in utero alcohol exposure model consisted of daily sc injection of 0.9% NaCl or ethanol (3 g/kg) in pregnant mice from gestational day (GD) 15 to GD20. Each group comprised 4 independent replicates. At GD20, fetuses were collected with their matched placenta. mRNA were extracted from cortices and placentas, amplified and labeled with Cy3. Resulting cRNA were hybridized on Agilent micro-array chips. (B) Detected signals were filtered based upon spots intensities and fold change variations between cortex versus placenta. (C) Volcano plots were generated using Genespring analysis to sort the genic probes that display, at least, a twofold variation (upper or lower) between cortex and placenta in the control group and after ethanol treatment. (D) Comparison of the two (control and alcohol) placenta–cortex signatures. A Venn analysis was carried out to search for genic probes present either in the control placenta–cortex signature, the ethanol-exposed placenta–cortex signature, or both. (E) Treatment-specific inter-organ lists were filtered to retain variations in at least 3 out of 4 replicates. (F) Genes common in the two placenta–cortex signatures were filtered based on a 40% change in the cortex/placenta ratio after ethanol treatment. (G) Entity lists were compared with Gene Ontology “vascular development” terms. (H) Resulting gene list was submitted to String analysis for network and functional clustering. (I) Proteins within each cluster were analyzed by PANTHER upon cell component and biological process classification. Analysis led to the identification of ligand/receptor couples dysregulated by PAE. (J) Protein validation of a PAE-dysregulated ligand/receptor couple by Western blot and placenta/cortex correlation analysis.

Similar articles

Cited by

References

    1. Chudley A.E. Fetal Alcohol Spectrum Disorder-high rates, high needs, high time for action. JAMA Pediatr. 2017;171:940–941. doi: 10.1001/jamapediatrics.2017.2232. - DOI - PubMed
    1. Wozniak J.R., Riley E.P., Charness M.E. Clinical presentation, diagnosis, and management of fetal alcohol spectrum disorder. Lancet Neurol. 2019;18:760–770. doi: 10.1016/S1474-4422(19)30150-4. - DOI - PMC - PubMed
    1. Chasnoff I.J., Wells A.M., King L. Misdiagnosis and missed diagnoses in foster and adopted children with prenatal alcohol exposure. Pediatrics. 2015;135:264–270. doi: 10.1542/peds.2014-2171. - DOI - PubMed
    1. Popova S., Lange S., Probst C., Gmel G., Rehm J. Estimation of national, regional, and global prevalence of alcohol use during pregnancy and fetal alcohol syndrome: A systematic review and meta-analysis. Lancet Glob. Health. 2017;5:e290–e299. doi: 10.1016/S2214-109X(17)30021-9. - DOI - PubMed
    1. Popova S., Lange S., Shield K., Burd L., Rehm J. Prevalence of fetal alcohol spectrum disorder among special subpopulations: A systematic review and meta-analysis. Addiction. 2019;114:1150–1172. doi: 10.1111/add.14598. - DOI - PMC - PubMed