. 2023 Aug 31;24(17):13541.
doi: 10.3390/ijms241713541.

Biomarkers of Oxidative Stress in Diabetes Mellitus with Diabetic Nephropathy Complications

Affiliations

Biomarkers of Oxidative Stress in Diabetes Mellitus with Diabetic Nephropathy Complications

Petya Goycheva et al. Int J Mol Sci. .

Abstract

The present study aimed to investigate and compare biomarkers of oxidative stress and the activity of antioxidant enzymes in the plasma of patients with different stages of diabetic nephropathy. For this purpose, we studied (1) the levels of reactive oxygen species and reactive nitrogen species as oxidative stress parameters, (2) lipid and protein oxidation, (3) the activity of antioxidant enzymes, and (4) cytokine production. Patients with type 2 diabetes mellitus were divided into three groups according to the loss of renal function: patients with compensated diabetes mellitus with normal renal function DMT2N0 measured as an estimated glomerular filtration rate (eGFR) ≥ 90 mL/min/1.73 m2, a group with decompensated diabetes mellitus with complication diabetic nephropathy and mild-to-moderate loss of renal function DMT2N1 (eGFR < 60 mL/min/1.73 m2: 59-45 mL/min/1.73 m2), and a decompensated diabetes mellitus with diabetic nephropathy group with moderate-to-severe loss of renal function DMT2N2 (eGFR > 30 mL/min/1.73 m2: 30-44 mL/min/1.73 m2). All results were compared with healthy volunteers. The results showed that patients with diabetic nephropathy had significantly higher levels of ROS, cytokine production, and end products of lipid and protein oxidation compared to healthy volunteers. Furthermore, patients with diabetic nephropathy had depleted levels of nitric oxide (NO), an impaired NO synthase (NOS) system, and reduced antioxidant enzyme activity (p < 0.05). These findings suggest that patients with impaired renal function are unable to compensate for oxidative stress. The decreased levels of NO radicals in patients with advanced renal complications may be attributed to damage NO availability in plasma. The study highlights the compromised oxidative status as a contributing factor to impaired renal function in patients with decompensated type 2 diabetes mellitus. The findings of this study have implications for understanding the pathogenesis of diabetic nephropathy and the role of oxidative stress and chronic inflammation in its development. The assessment of oxidative stress levels and inflammatory biomarkers may aid in the early detection and prediction of diabetic complications.

Keywords: NO radicals; NOS; diabetes mellitus; diabetic nephropathy; oxidative stress.


Conflict of interest statement

The authors declare no conflict of interest.

Figures

Figure 1
Figure 1
Present the levels of nitric oxide (NO), eNOS and iNOS in plasma samples. (A) NO: (1) healthy controls; (2) DMT2N0 patients with normal kidney function (eGFR ≥ 90 mL/min/1.73 m2, stage 1); (3) DMT2N1 with mild-to-moderate renal function loss (eGFR < 60 mL/min/1.73 m2, stage 3a); (4) DMT2N2 with moderate-to-severe renal function loss (eGFR > 30 mL/min/1.73 m2, stage 3b). (B) eNOS: (1) healthy controls; (2) DMT2N0 patients with normal kidney function (eGFR ≥ 90 mL/min/1.73 m2, stage 1); (3) DMT2N1 with mild-to-moderate renal function loss (eGFR < 60 mL/min/1.73 m2, stage 3a); (4) DMT2N2 with moderate-to-severe renal function loss (eGFR > 30 mL/min/1.73 m2, stage 3b). (C) iNOS: (1) healthy controls; (2) DMT2N0 patients with normal kidney function (eGFR ≥ 90 mL/min/1.73 m2, stage 1); (3) DMT2N1 with mild-to-moderate renal function loss (eGFR < 60 mL/min/1.73 m2, stage 3a); (4) DMT2N2 with moderate-to-severe renal function loss (eGFR > 30 mL/min/1.73 m2, stage 3b). LSD post hoc test; * p < 0.05 vs. control group; ** p < 0.05 vs. DMT2N0 group (stage 1).
Figure 2
Figure 2
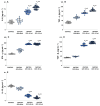
Displays the levels of oxidative stress markers presented as MD, ROS production and 8-Iso-PGF. (A) MDA levels—controls; DMT2N0 stage 1; DMT2N1 stage 3a; DMT2N2 stage 3b. (B) ROS production—controls; DMT2N0 stage 1; DMT2N1 stage 3a; DMT2N2 stage 3b. (C) 8-Iso-PGF—controls; DMT2N0 stage 1; DMT2N1 stage 3a; DMT2N2 stage 3b. LSD post hoc test; (*) p < 0.05 vs. control; (**) p < 0.05 vs. DMT2N0 stage 1.
Figure 3
Figure 3
Correlation graphs presented as individual measurements. (A) correlation between MDA and eGFR; (B) correlation between 8-IsoPGF and eGFR; (C) correlation between MDA and UAE; (D) correlation between 8-IsoPGF and UAE.
Figure 3
Figure 3
Correlation graphs presented as individual measurements. (A) correlation between MDA and eGFR; (B) correlation between 8-IsoPGF and eGFR; (C) correlation between MDA and UAE; (D) correlation between 8-IsoPGF and UAE.
Figure 4
Figure 4
Levels of protein carbonyls and advanced glycation end products. (A) PC levels—controls; DMT2N0 stage 1; DMT2N1 stage 3a; DMT2N2 stage 3b. (B) AGEs levels—controls; DMT2N0 stage 1; DMT2N1 stage 3a; DMT2N2 stage 3b. * p < 0.05 vs. control.
Figure 5
Figure 5
Scatter plot between plasma levels of (A) PC and IL-10 and (B) AGEs and IL-10.
Figure 6
Figure 6
Activity of antioxidant enzymes –SOD, CAT and GPx. (A) SOD activity—controls; DMT2N0 stage 1; DMT2N1 stage 3a; DMT2N0 stage 3b. (B) CAT activity—controls; DMT2N0 stage 1; DMT2N1 stage 3a; DMT2N2 stage 3b. (C) GPx activity—controls; DMT2N0 stage 1; DMT2N1 stage 3a; DMT2N2, GFR stage 3b. LSD post hoc test; (*) p < 0.05 vs. control; (**) p < 0.05 vs. DMT2N0 stage 1.
Figure 7
Figure 7
Pro-inflammatory cytokine levels: (A) IL-6; (B) TNF-α; (C) IFN-γ; (D) TGF-β; (E) IL-10. LSD post hoc test, * p < 0.05 vs. control; ** p < 0.05 vs. DMT2N0 stage 1.

Similar articles

Cited by

References

    1. ElSayed N.A., Aleppo G., Aroda V.R., Bannuru R.R., Brown F.M., Bruemmer D., Gabbay R.A. 2. Classification and diagnosis of diabetes: Standards of care in diabetes—2023. Diabetes Care. 2023;46:S19–S40. doi: 10.2337/dc23-S002. - DOI - PMC - PubMed
    1. Giaccari A., Sorice G., Muscogiuri G. Glucose toxicity: The leading actor in the pathogenesis and clinical history of type 2 diabetes—Mechanisms and potentials for treatment. Nutr. Metab. Cardiovasc. Dis. 2009;19:365–377. doi: 10.1016/j.numecd.2009.03.018. - DOI - PubMed
    1. John S. Complication in diabetic nephropathy. Diabetes Metab. Syndr. Clin. Res. Rev. 2016;10:247–249. doi: 10.1016/j.dsx.2016.06.005. - DOI - PubMed
    1. Zhang P., Li T., Wu X., Nice E.C., Huang C., Zhang Y. Oxidative stress and diabetes: Antioxidative strategies. Front. Med. 2020;14:583–600. doi: 10.1007/s11684-019-0729-1. - DOI - PubMed
    1. Sol M., Kamps J.A.A.M., van den Born J., van den Heuvel M.C., van der Vlag J., Krenning G., Hillebrands J.L. Glomerular Endothelial Cells as Instigators of Glomerular Sclerotic Diseases. Front. Pharmacol. 2020;11:573557. doi: 10.3389/fphar.2020.573557. - DOI - PMC - PubMed