. 2023 Aug 25;15(17):3736.
doi: 10.3390/nu15173736.

Positive Regulation of Acetate in Adipocyte Differentiation and Lipid Deposition in Obese Mice

Affiliations

Positive Regulation of Acetate in Adipocyte Differentiation and Lipid Deposition in Obese Mice

Changbao Sun et al. Nutrients. .

Abstract

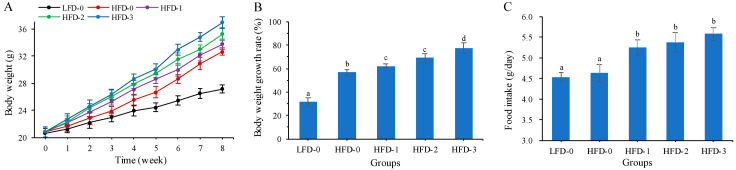
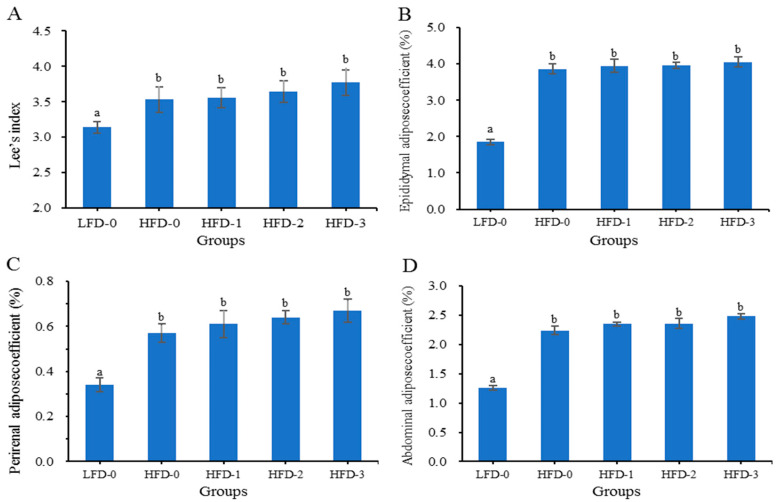
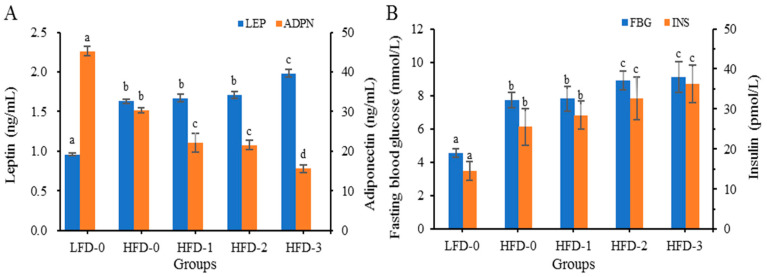
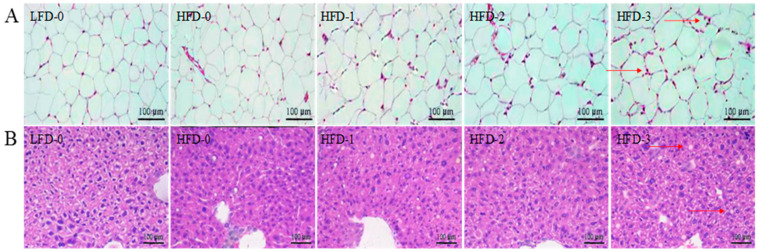
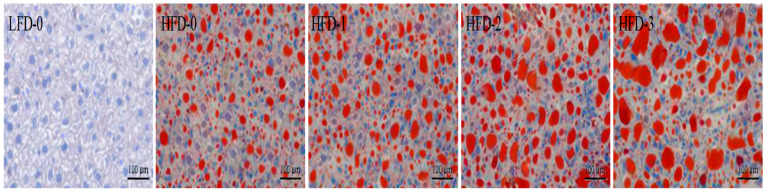
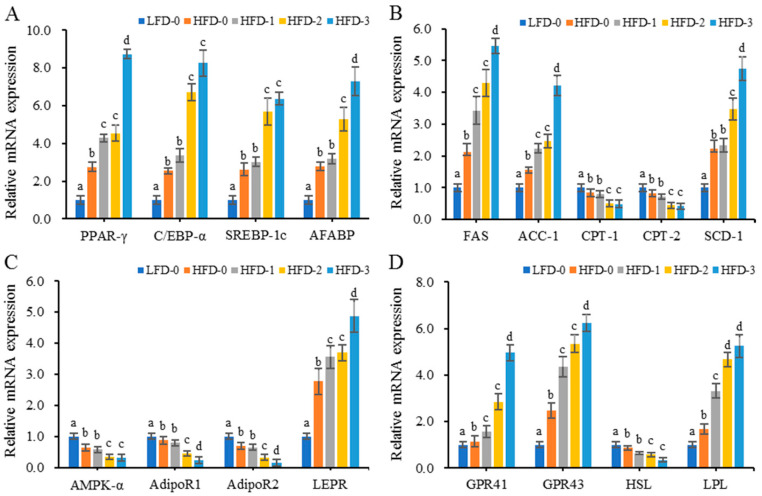
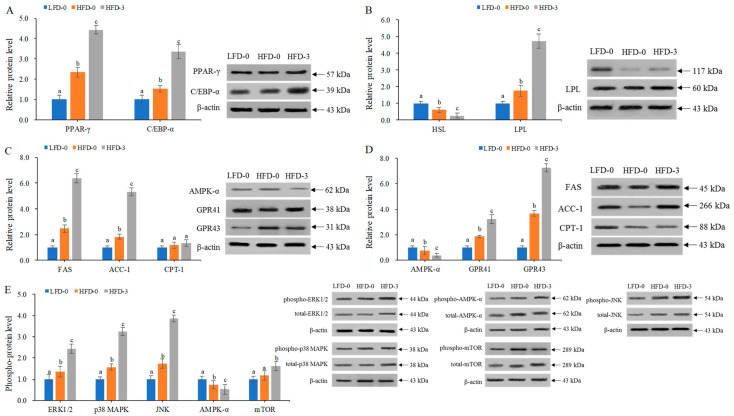
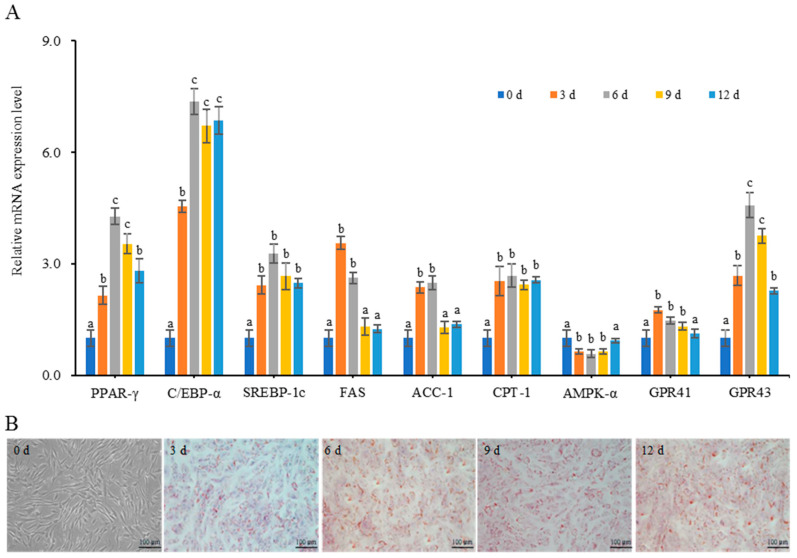
Acetate is associated with adipocyte differentiation and lipid deposition. To further develop this scientific point, obese mice on a high-fat diet were given an intragastric administration of acetate for 8 weeks and mouse adipose mesenchymal stem cells (mAMSCs) were treated with acetate for 24 h. The results showed that the body weight, food intake, Lee's index, adipose tissue coefficient, liver index, blood lipid levels, insulin resistance, pro-inflammatory factors levels and fatty lesions in liver and adipose tissue in obese mice treated with acetate increased markedly, while anti-inflammatory factors levels and liver function decreased significantly (p < 0.05). The mRNA expression levels of PPAR-γ, C/EBP-α, SREBP, AFABP, FAS, ACC-1, SCD-1, LPL, LEPR, GPR41 and GPR43 genes in adipose tissue and mAMSCs were significantly increased, while the mRNA expression levels of HSL, CPT-1, CPT-2, AMPK, AdipoR1 and AdipoR2 genes were significantly reduced (p < 0.05). Except for AMPK-α signaling pathway proteins, the phosphorylation levels of p38 MAPK, ERK1/2, JNK and mTOR were significantly increased (p < 0.05) and these changes were dose-dependent. The findings indicated that acetate played a positive role in regulating adipocyte differentiation and lipid deposition by activating MAPKs and mTOR signaling pathways (the expression up-regulation of genes such as PPAR-γ, C/EBP-α and SREBP-1, etc.) and inhibiting the AMPK signaling pathway (the expression down-regulation of genes such as HSL, CPT-1 and AMPK-α, etc.).

Keywords: acetate; adipocyte differentiation; lipid deposition; lipid metabolism; obesity.


Conflict of interest statement

The authors declare no conflict of interest.

Figures

Figure 1
Figure 1
Body weight and food intake of mice in each group. Acetate promoted the elevation of (A) body weight, (B) body weight growth rate and (C) food intake in obese mice on a high-fat diet in a dose-dependent manner. Data are mean ± SD, and statistical significance was determined using a one-way analysis of variance (ANOVA) with Tukey’s multiple comparison test, n = 15/group. Different lowercase letters in Figure 1B indicate significant differences between groups (p < 0.05). LFD-0 represents control mice treated with 0.9% NaCl solution via gavage. HFD-0 represents obese mice treated with 0.9% NaCl solution via gavage. HFD-1 represents obese mice treated with 1.0 g/kg of acetate via gavage. HFD-2 represents obese mice treated with 2.0 g/kg of acetate via gavage. HFD-3 represents obese mice treated with 3.0 g/kg of acetate via gavage.
Figure 2
Figure 2
The Lee’s index and adipose tissue coefficient of mice in each group. Acetate promoted the elevation of the (A) Lee’s index, (B) epididymal adipose tissue coefficient, (C) perirenal adipose tissue coefficient and (D) abdominal subcutaneous adipose tissue coefficient in obese mice on a high-fat diet. Data are mean ± SD, and statistical significance was determined using a one-way analysis of variance (ANOVA) with Tukey’s multiple comparison test, n = 15/group. Different lowercase letters in figure indicate significant differences between groups (p < 0.05). LFD-0 represents control mice treated with 0.9% NaCl solution via gavage. HFD-0 represents obese mice treated with 0.9% NaCl solution via gavage. HFD-1 represents obese mice treated with 1.0 g/kg of acetate via gavage. HFD-2 represents obese mice treated with 2.0 g/kg of acetate via gavage. HFD-3 represents obese mice treated with 3.0 g/kg of acetate via gavage.
Figure 3
Figure 3
Serum leptin, adiponectin, fasting blood glucose and insulin levels of mice in each group. (A) Increased level of leptin and reduced level of adiponectin due to acetate treatment; (B) Increased levels of fasting blood glucose and insulin due to acetate treatment. Data are mean ± SD, and statistical significance was determined using a one-way analysis of variance (ANOVA) with Tukey’s multiple comparison test; n = 15/group. Different lowercase letters in the same color bars indicate significant differences between groups (p < 0.05). LFD-0 represents control mice treated with 0.9% NaCl solution via gavage. HFD-0 represents obese mice treated with 0.9% NaCl solution via gavage. HFD-1 represents obese mice treated with 1.0 g/kg of acetate via gavage. HFD-2 represents obese mice treated with 2.0 g/kg of acetate via gavage. HFD-3 represents obese mice treated with 3.0 g/kg of acetate via gavage.
Figure 4
Figure 4
Hematoxylin–eosin staining of abdominal subcutaneous adipose tissue and liver tissue. (A) Increased white lipid accumulation and inflammatory response in the abdominal subcutaneous adipose tissue of obese mice due to acetate treatment, with the red arrow indicating coronal structure; (B) Increased degree of liver injury and fatty lesions in the liver tissue of obese mice due to acetate treatment, with the red arrow indicating lipid vacuoles. Magnification = 200×; scale bar = 100 μm. LFD-0 represents control mice treated with 0.9% NaCl solution via gavage. HFD-0 represents obese mice treated with 0.9% NaCl solution via gavage. HFD-1 represents obese mice treated with 1.0 g/kg of acetate via gavage. HFD-2 represents obese mice treated with 2.0 g/kg of acetate via gavage. HFD-3 represents obese mice treated with 3.0 g/kg of acetate via gavage.
Figure 5
Figure 5
Increased lipid deposition in obese mice that was further aggravated via acetate gavage treatment indicated via the Oil Red O staining of liver tissue. Magnification = 200×; scale bar = 100 μm. LFD-0 represents control mice treated with 0.9% NaCl solution via gavage. HFD-0 represents obese mice treated with 0.9% NaCl solution via gavage. HFD-1 represents obese mice treated with 1.0 g/kg of acetate via gavage. HFD-2 represents obese mice treated with 2.0 g/kg of acetate via gavage. HFD-3 represents obese mice treated with 3.0 g/kg of acetate via gavage.
Figure 6
Figure 6
The relative mRNA expression levels of lipid metabolism-related genes in the abdominal subcutaneous adipose tissue of mice. (A) Increased relative mRNA expression levels of adipocyte differentiation factor (PPAR-γ, C/EBP, SREBP, and AFABP) genes due to acetate treatment; (B) Increased relative mRNA expression levels of fatty acid synthesis factor (FAS, ACC-1, and SCD-1) genes and decreased relative mRNA expression levels of fatty acid decomposition factor (CPT-1, and CPT-2) genes due to acetate treatment; (C) Increased relative mRNA expression level of leptin receptor (LEPR) gene and decreased relative mRNA expression levels of adiponectin receptor (AdipoR1, and AdipoR2) and AMPK-α genes due to acetate treatment; (D) Increased relative mRNA expression levels of short-chain fatty acid receptors (GPR41 and GPR43) and lipid synthesis factor (LPL) genes and decreased relative mRNA expression levels of the lipolytic factor (HSL) gene due to acetate treatment. Data are mean ± SD, and statistical significance was determined using one-way analysis of variance (ANOVA) with Tukey’s multiple comparison test; n = 15/group. Different lowercase letters in the same gene indicate significant differences between groups (p < 0.05). LFD-0 represents control mice treated with 0.9% NaCl solution via gavage. HFD-0 represents obese mice treated with 0.9% NaCl solution via gavage. HFD-1 represents obese mice treated with 1.0 g/kg of acetate via gavage. HFD-2 represents obese mice treated with 2.0 g/kg of acetate via gavage. HFD-3 represents obese mice treated with 3.0 g/kg of acetate via gavage.
Figure 7
Figure 7
The protein expression levels of lipid metabolism-related genes in the abdominal subcutaneous adipose tissue of mice. (A) Increased protein expression levels of adipocyte differentiation factor (PPAR-γ and C/EBP-α) genes due to acetate treatment; (B) Increased protein expression level of the lipid synthesis (LPL) gene and decreased protein expression level of the lipolytic factor (HSL) gene due to acetate treatment; (C) Increased the protein expression levels of fatty acid synthesis factor (FAS and ACC-1) genes and decreased protein expression level of fatty acid decomposition factor (CPT-1) genes due to acetate treatment; (D) Increased protein expression levels of short-chain fatty acid receptor (GPR41 and GPR43) genes and decreased protein expression level of fatty acid metabolism signaling factors (AMPK-α) due to acetate treatment; (E) Increased phosphorylation levels of signaling pathway proteins (p38 MAPK, ERK1/2, JNK and mTOR) and decreased phosphorylation levels of signaling pathway proteins (AMPK-α) due to acetate treatment, with the phosphorylation levels being represented by phospho-protein/total protein. A representative Western blot is shown in the figure. Data are mean ± SD, and statistical significance was determined using a one-way analysis of variance (ANOVA) with Tukey’s multiple comparison test; n = 15/group. Different lowercase letters in the same gene/protein indicate significant differences between groups (p < 0.05). LFD-0 represents control mice treated with 0.9% NaCl solution via gavage. HFD-0 represents obese mice treated with 0.9% NaCl solution via gavage. HFD-3 represents obese mice treated with 3.0 g/kg of acetate via gavage.
Figure 8
Figure 8
The relative mRNA expression levels of lipid metabolism-related genes and lipid droplet deposition in differentiated cells. (A) The relative mRNA expression levels of lipid synthesis-related genes that increased from the 3rd day of cell differentiation; data are mean ± SD, and statistical significance was determined using a one-way analysis of variance (ANOVA) with Tukey’s multiple comparison test; n = 15/group. Different lowercase letters in the same gene indicate significant differences between groups (p < 0.05). (B) Lipid droplets began to form in cells from the 3rd day of cell differentiation. Magnification = 200×; scale bar = 100 μm.
Figure 9
Figure 9
Oil Red O staining of mice adipose-derived mesenchymal stem cells treated with acetate indicating that acetate promoted the lipid deposition of cells in a dose-dependent manner. Magnification = 200×; scale bar = 100 μm.

Similar articles

Cited by

References

    1. Peng W., Zhang J., Zhou H., Zhang A., Wang Y., Tian X., Wen D., Wang Y. Obesity intervention efforts in China and the 2022 World Obesity Day. Glob. Health J. 2022;6:118–121. doi: 10.1016/j.glohj.2022.07.007. - DOI
    1. Hu G. More vigorous efforts are needed to fight obesity, a serious public health problem in China. Obesity. 2021;29:1580–1581. doi: 10.1002/oby.23259. - DOI - PMC - PubMed
    1. Canfora E.E., Meex R.C.R., Venema K., Blaak E.E. Gut microbial metabolites in obesity, NAFLD and T2DM. Nat. Rev. Endocrinol. 2019;15:261–273. doi: 10.1038/s41574-019-0156-z. - DOI - PubMed
    1. Halmos E.P., Mack A., Gibson G.R. Review article: Emulsifiers in the food supply and implications for gastrointestinal disease. Aliment. Pharmacol. Ther. 2019;49:41–50. doi: 10.1111/apt.15045. - DOI - PubMed
    1. Yang Q., Liang Q., Balakrishnan B., Belobrajdic D.P., Feng Q.J., Zhang W. Role of Dietary Nutrients in the Modulation of Gut Microbiota: A Narrative Review. Nutrients. 2020;12:381. doi: 10.3390/nu12020381. - DOI - PMC - PubMed

Substances