. 2023 Sep 1;15(17):3829.
doi: 10.3390/nu15173829.

A High-Fat, High-Cholesterol Diet Promotes Intestinal Inflammation by Exacerbating Gut Microbiome Dysbiosis and Bile Acid Disorders in Cholecystectomy

Affiliations

A High-Fat, High-Cholesterol Diet Promotes Intestinal Inflammation by Exacerbating Gut Microbiome Dysbiosis and Bile Acid Disorders in Cholecystectomy

Fusheng Xu et al. Nutrients. .

Abstract

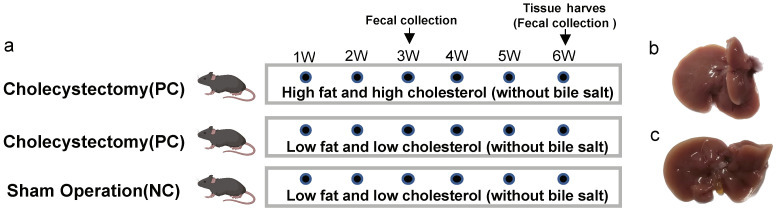
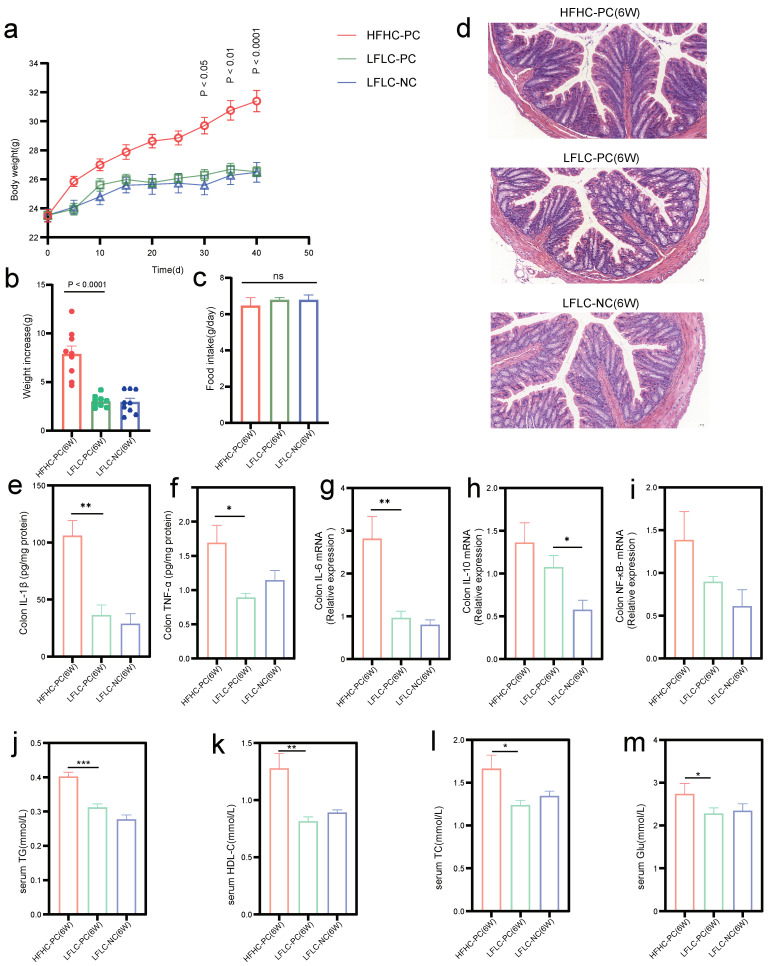
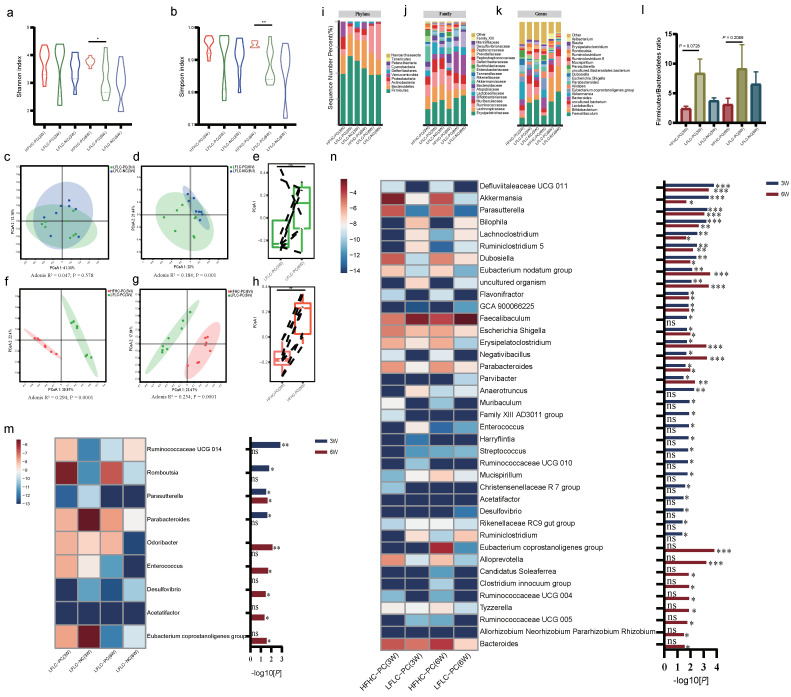
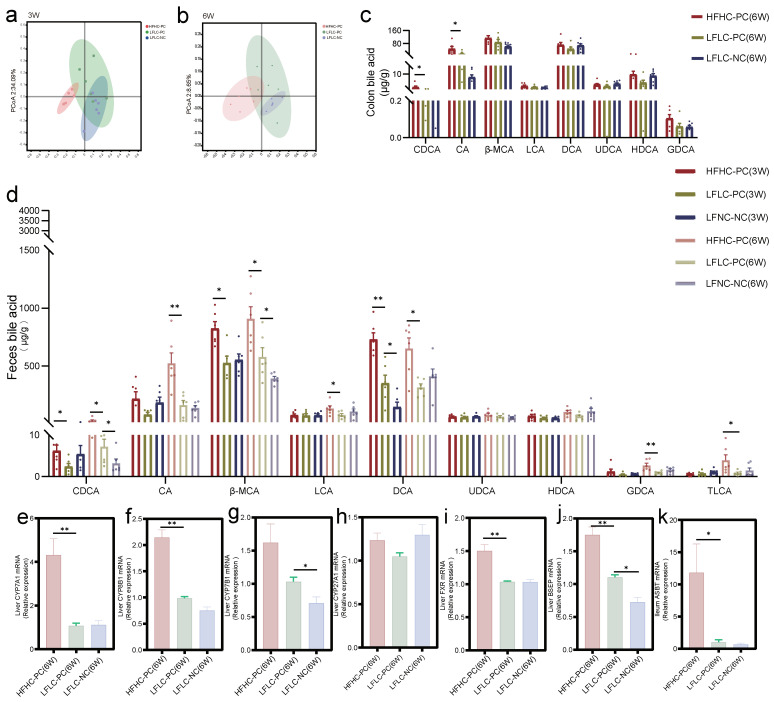
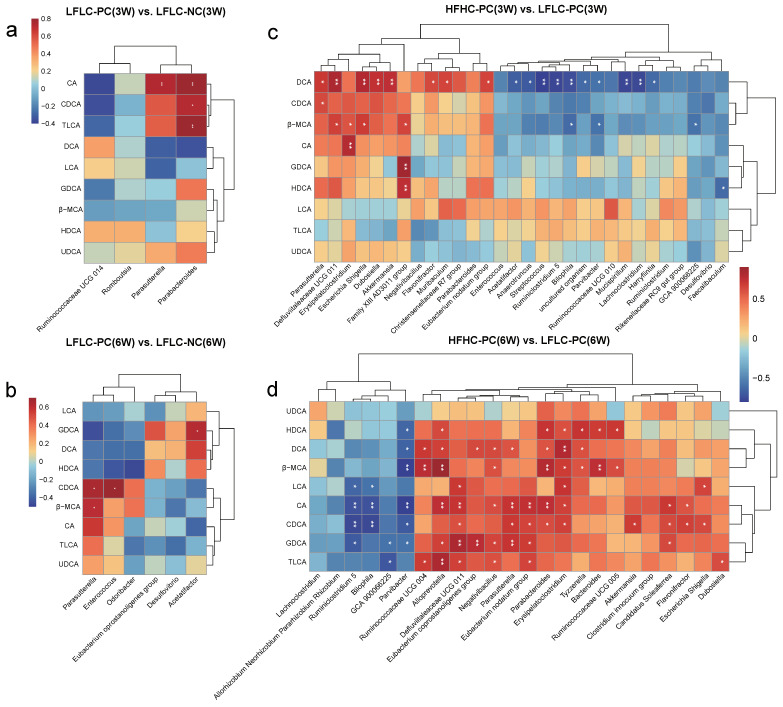
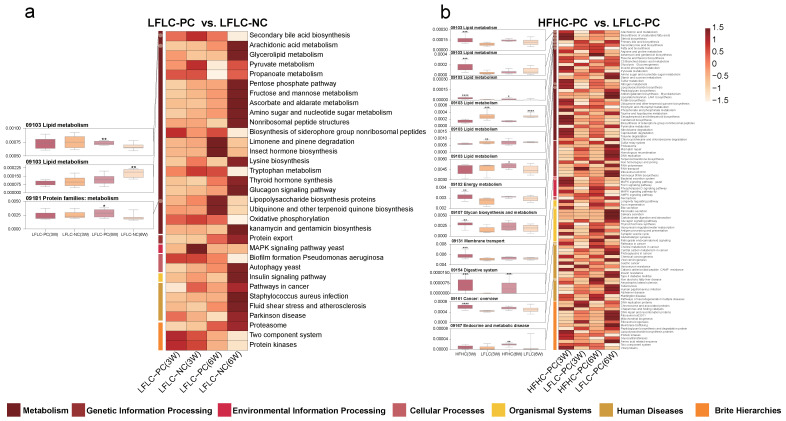
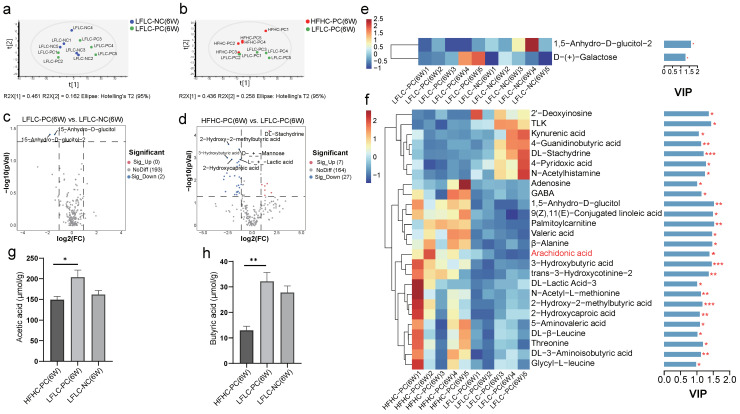
Patients with post-cholecystectomy (PC) often experience adverse gastrointestinal conditions, such as PC syndrome, colorectal cancer (CRC), and non-alcoholic fatty liver disease (NAFLD), that accumulate over time. An epidemiological survey further revealed that the risk of cholecystectomy is associated with high-fat and high-cholesterol (HFHC) dietary intake. Mounting evidence suggests that cholecystectomy is associated with disrupted gut microbial homeostasis and dysregulated bile acids (BAs) metabolism. However, the effect of an HFHC diet on gastrointestinal complications after cholecystectomy has not been elucidated. Here, we aimed to investigate the effect of an HFHC diet after cholecystectomy on the gut microbiota-BA metabolic axis and elucidate the association between this alteration and the development of intestinal inflammation. In this study, a mice cholecystectomy model was established, and the levels of IL-Iβ, TNF-α, and IL-6 in the colon were increased in mice fed an HFHC diet for 6 weeks. Analysis of fecal BA metabolism showed that an HFHC diet after cholecystectomy altered the rhythm of the BA metabolism by upregulating liver CPY7A1, CYP8B1, and BSEP and ileal ASBT mRNA expression levels, resulting in increased fecal BA levels. In addition, feeding an HFHC diet after cholecystectomy caused a significant dysbiosis of the gut microbiota, which was characterized by the enrichment of the metabolic microbiota involved in BAs; the abundance of pro-inflammatory gut microbiota and related pro-inflammatory metabolite levels was also significantly higher. In contrast, the abundance of major short-chain fatty acid (SCFA)-producing bacteria significantly decreased. Overall, our study suggests that an HFHC diet after cholecystectomy promotes intestinal inflammation by exacerbating the gut microbiome and BA metabolism dysbiosis in cholecystectomy. Our study also provides useful insights into the maintenance of intestinal health after cholecystectomy through dietary or probiotic intervention strategies.

Keywords: bile acids; cholesterol; diet; gut microbiota; inflammation; post-cholecystectomy.


Conflict of interest statement

The authors declare no conflict of interest.

Figures

Figure 1
Figure 1
Animal experiments (a). Mice grouping instructions. (b,c). Diagram of cholecystectomy (b) with sham surgery (c).
Figure 2
Figure 2
HFHC feeding and PC induce an inflammatory colonic environment in mice. (a): Changes in body weight of mice throughout surgical molding and different dietary feeding. (b): Weight increase in mice from week 1 to 6. (c): Mean food intake of mice throughout the experimental cycle. (d): Representative hematoxylin-and-eosin-stained sections in HFHC−PC, LFLC−PC, and LFLC−NC groups at week 6. (e,f): ELISA assay was used to detect IL-1β and TNF-α levels in the colon. (gi): Relative mRNA expression of IL-6, IL-10, and NF-κB in the colon. (jm): Serum TG, HDL-C, TC, and Glu levels. * p < 0.05, ** p < 0.01, *** p < 0.001, ns, nonsignificant.
Figure 3
Figure 3
HFHC diet and PC altered gut microbial homeostasis. (a,b): Shannon or Simpson index of fecal microbiota (weeks 3 and 6). (c,d): Microbial clustering based on Bray Curtis distances in the LFLC−PC and LFLC−NC groups at weeks 3 (c) and 6 (d), visualized using principle coordinate analysis (PCoA). (Adonis; R2 = 0.047, p = 0.578 at week 3; R2 = 0.184, p = 0.001 at week 6; LFLC−PC vs. LFLC−NC). (f,g): Microbial clustering based on Bray Curtis distances in the HFHC−PC and LFLC−PC groups at weeks 3 (f) and 6 (g), visualized using principle coordinate analysis (PCoA) (Adonis; R2 = 0.294, p = 0.0001 at week 3; R2 = 0.254, p = 0.0001 at week 6; HFHC−PC vs. LFLC−PC). (e,h): Boxplot showing changes in microbiome from weeks 3 to 6, in the HFHC−PC (h) andLFLC−PC (e) groups. In both groups, the HFHC diet resulted in an increase along the first principal axis (** p < 0.01; ns, nonsignificant). (ik): The relative abundance of gut microbiota at Phylum (i), Family (j), and Genus (k) levels from different groups (the HFHC−PC, LFLC−PC, and LFLC−NC groups). (l): Firmicutes/Bacteroidetes ratio. (m,n): Heat-map analysis of bacteria in fecal samples from cholecystectomized (m) and differentially diet-fed (n) mice at weeks 3 and 6, respectively. The color indicates the median relative abundance of bacteria in that group of samples. The significance of the difference in bacteria between the two groups is shown on the right. The bar color indicates the statistical significances (p value, values converted by −log10) of bacteria between two groups. * p < 0.05, ** p < 0.01, *** p < 0.001, ns, nonsignificant. The two groups were compared using Mann–Whitney test.
Figure 4
Figure 4
HFHC diet and PC altered BAs metabolic homeostasis. (a,b): PCoA analysis of fecal BAs profile at week 3 (a) or 6 (b) in the HFHC−PC, LFLC−PC, and LFLC−NC groups. (c): The relative concentration of colonic total CDCA, CA, β-MCA, LCA, DCA, ursodeoxycholic (UDCA), hyodeoxycholic acid (HDCA), and GDCA in the HFHC−PC, LFLC−PC, and LFLC−NC groups at week 6, respectively. (d): The relative concentration of feces total CDCA, CA, β-MCA, LCA, DCA, UDCA, HDCA, GDCA, and TLCA in the HFHC−PC, LFLC−PC, and LFLC−NC groups at weeks 3 and 6. (ek): Relative mRNA expression of CYP7A1 (e), CYP8B1 (f), CYP7B1 (g), CYP27A1 (h), FXR (i), and BSEP (j) in liver, and ASBT (k) in the colon. * p < 0.05, ** p < 0.01.
Figure 5
Figure 5
Effect of different diets and PC on BA metabolism in relation to gut microbiota. (a,b): Spearman’s correlation between gut microbiota and fecal BAs in LFLC−PC vs. LFLC−NC groups at weeks 3 (a) and 6 (b). (c,d): Spearman’s correlation between gut microbiota and BAs in HFHC−PC vs. LFLC−PC groups at weeks 3 (c) and 6 (d). Red denotes a positive correlation; blue denotes a negative correlation. The color intensity is proportional to the strength of the Spearman’s correlation. * p ≤ 0.05, ** p ≤ 0.01.
Figure 6
Figure 6
HFHC diets and PC altered gut microbiota metabolism in mice. PICRUSt analysis in the KEGG pathways. (a): HFHC−PC vs. LFLC−PC groups (at weeks 3 and 6). (b): LFLC−PC vs. LFLC−NC groups (at weeks 3 and 6). The boxplots (left) show the relative abundance of the metabolic pathway of the HFHC−PC, LFLC−PC, and LFLC−NC groups (at weeks 3 and 6). All boxplots represent the min to max of the distribution; the median is shown as a thick line in the middle of the box. Heat maps (right) show differential metabolic pathways between the two groups (a: top 60 pathways). The color indicates the median relative abundance of the metabolic pathway in the group. Mann–Whitney test was used for comparison between the two groups (p < 0.05). * p < 0.05, ** p < 0.01, *** p < 0.001, **** p < 0.0001.
Figure 7
Figure 7
HFHC diet and PC altered the fecal metabolites in mice. (a,b): Principal component analysis (PCA) at week 6 (LFLC−PC vs. LFLC−NC (a); HFHC−PC vs. LFLC−PC (b)). (c,d): Volcanic map of all differential metabolites and known metabolites (p < 0.05) (LFLC−PC vs. LFLC−NC (c); HFHC−PC vs. LFLC−PC (d)). (e,f): Heat map analysis of fecal differential metabolites at week 6 in HFHC−PC vs. LFLC−PC groups (e) and LFLC−PC vs. LFLC−NC (f). The color indicates the median relative abundance of the metabolite in the group of samples. The metabolite clustering tree is shown on the left. The metabolite variable importance (VIP) in the projected values indicates the contribution of the metabolite to the difference between the two groups, as shown on the right. Higher VIP values indicate greater differences in the composition of that metabolite between the two groups. The differential metabolites were set as not less than 1. (g,h): Acetic acid, Butyric acid. The statistical significance (p−value) of the differential metabolites is marked on the right of the bar chart. p values were determined using a t-test. * p ≤ 0.05, ** p ≤ 0.01, *** p ≤ 0.001.

References

    1. Shaffer E.A. Review article: Control of gall-bladder motor function. Aliment. Pharmacol. Ther. 2000;14:2–8. doi: 10.1046/j.1365-2036.2000.014s2002.x. - DOI - PubMed
    1. Maldonado-Valderrama J., Wilde P., Macierzanka A., Mackie A. The role of bile salts in digestion. Adv. Colloid. Interface Sci. 2011;165:36–46. doi: 10.1016/j.cis.2010.12.002. - DOI - PubMed
    1. Bertolini A., Fiorotto R., Strazzabosco M. Bile acids and their receptors: Modulators and therapeutic targets in liver inflammation. Semin. Immunopathol. 2022;44:547–564. doi: 10.1007/s00281-022-00935-7. - DOI - PMC - PubMed
    1. Kullak-Ublick G.A., Paumgartner G., Berr F. Long-term effects of cholecystectomy on bile acid metabolism. Hepatology. 1995;21:41–45. doi: 10.1002/hep.1840210109. - DOI - PubMed
    1. Lagergren J., Ye W., Ekbom A. Intestinal cancer after cholecystectomy: Is bile involved in carcinogenesis? Gastroenterology. 2001;121:542–547. doi: 10.1053/gast.2001.27083. - DOI - PubMed