. 2023 Aug 23;13(17):2401.
doi: 10.3390/nano13172401.

Amplitude-Resolved Single Particle Spectrophotometry: A Robust Tool for High-Throughput Size Characterization of Plasmonic Nanoparticles

Affiliations

Amplitude-Resolved Single Particle Spectrophotometry: A Robust Tool for High-Throughput Size Characterization of Plasmonic Nanoparticles

Rodrigo Calvo et al. Nanomaterials (Basel). .

Abstract

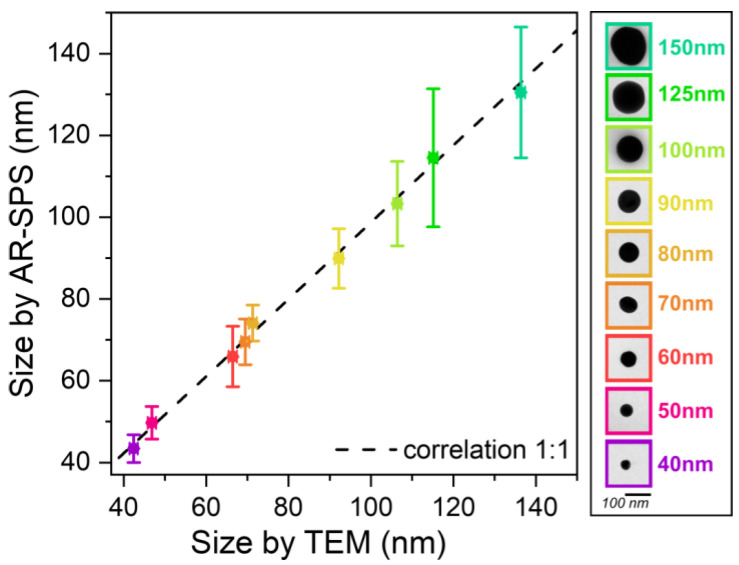
Plasmonic nanoparticles have a wide range of applications in science and industry. Despite the numerous synthesis methods reported in the literature over the last decades, achieving precise control over the size and shape of large nanoparticle populations remains a challenge. Since variations in size and shape significantly affect the plasmonic properties of nanoparticles, accurate metrological techniques to characterize their morphological features are essential. Here, we present a novel spectrophotometric method, called Amplitude-Resolved Single Particle Spectrophotometry, that can measure the individual sizes of thousands of particles with nanometric accuracy in just a few minutes. This new method, based on the measurement of the scattering amplitude of each nanoparticle, overcomes some of the limitations observed in previous works and theoretically allows the characterization of nanoparticles of any size with a simple extra calibration step. As proof of concept, we characterized thousands of spherical nanoparticles of different sizes. This new method shows excellent accuracy, with less than a 3% discrepancy in direct comparison with transmission electron microscopy. Although the effectiveness of this method has been demonstrated with spherical nanoparticles, its real strength lies in its adaptability to more complex geometries by using an alternative analytical method to the one described here.

Keywords: metrology; nanoparticles; plasmonic.


Conflict of interest statement

The authors declare no conflict of interest.

Figures

Figure 1
Figure 1
Schematic drawing of the AR-SPS experimental setup; the sample imaging is performed in reflection mode, while the sample spectrophotometry is performed in transmission mode.
Figure 2
Figure 2
Sample preparation scheme, spectral images, and scattering spectra of gold nanoparticles (GNPs). (a) Schematic representation of the sample preparation process, in which a 50 μL drop of GNPs at a concentration of 200 μg/mL was deposited on a glass slide, followed by the addition of a 2 μL drop of glycerol and a coverslip. (b) Cropped spectral images obtained for 100 nm particles used to measure the scattering amplitude at different wavelengths. (c) Scattering spectra of approximately 1000 GNPs extracted from the spectral images shown in (b) and normalized to the sample background. The red line represents the average scattering amplitude at each wavelength. The average size of the GNPs, extracted from the amplitude using Equation (1), is 106 ± 10 nm.
Figure 3
Figure 3
Spectral analysis and theoretical dependence of the scattering amplitude on the nanoparticle size. (a) Thousands of individual normalized particle spectra are obtained for each batch using the AR-SPS technique, with the mean value represented by the black line. The dotted line marks the spectral shift between batches, and all data have been normalized to the sample background. (b) This graph shows the normalized mean amplitude values for different batches of nanoparticles measured using AR-SPS, with each point value corresponding to a different nanoparticle size. Every point is normalized to a reference batch of 90 nm. The associated error bars show the standard deviation for each measurement. The nanoparticle sizes shown represent the mean values obtained by TEM characterization. A black dashed line on the graph illustrates the theoretical amplitude-to-reference ratio (A/Aref) as a function of the nanoparticle size, as derived from Equation (1).
Figure 4
Figure 4
Correlation between nanoparticle size values obtained by AR-SPS and those obtained by TEM. The legend shows the nominal values for each batch, along with an image of a single nanoparticle taken by TEM. The points follow a very near-ideal linear relationship, represented by the black dashed line; in fact, when a linear fit is performed, the resulting slope has a value of 0.94.

References

    1. Amendola V., Pilot R., Frasconi M., Maragò O.M., Iatì M.A. Surface plasmon resonance in gold nanoparticles: A review. J. Phys. Condens. Matter. 2017;29:203002. doi: 10.1088/1361-648X/aa60f3. - DOI - PubMed
    1. Sadeghi H., Zolanvar A., Khalili H., Goodarzi M., Nezamdost J., Nezamdost S. Effective Permittivity of Metal–Dielectric Plasmonics Nanostructures. Plasmonics. 2014;9:415–425. doi: 10.1007/s11468-013-9638-3. - DOI
    1. Holzinger M., Le Goff A., Cosnier S. Nanomaterials for biosensing applications: A review. Front. Chem. 2014;2:63. doi: 10.3389/fchem.2014.00063. - DOI - PMC - PubMed
    1. Anker J.N., Hall W.P., Lyandres O., Shah N.C., Zhao J., Van Duyne R.P. Biosensing with plasmonic nanosensors. Nat. Mater. 2008;7:442–453. doi: 10.1038/nmat2162. - DOI - PubMed
    1. Kong F., Zhang J., Li R., Wang Z., Wang W., Wang W. Unique Roles of Gold Nanoparticles in Drug Delivery, Targeting and Imaging Applications. Molecules. 2017;22:1445. doi: 10.3390/molecules22091445. - DOI - PMC - PubMed