. 2023 Aug 26;13(17):2426.
doi: 10.3390/nano13172426.

Mesoporous Dual-Semiconductor ZnS/CdS Nanocomposites as Efficient Visible Light Photocatalysts for Hydrogen Generation

Affiliations

Mesoporous Dual-Semiconductor ZnS/CdS Nanocomposites as Efficient Visible Light Photocatalysts for Hydrogen Generation

Ioannis Vamvasakis et al. Nanomaterials (Basel). .

Abstract

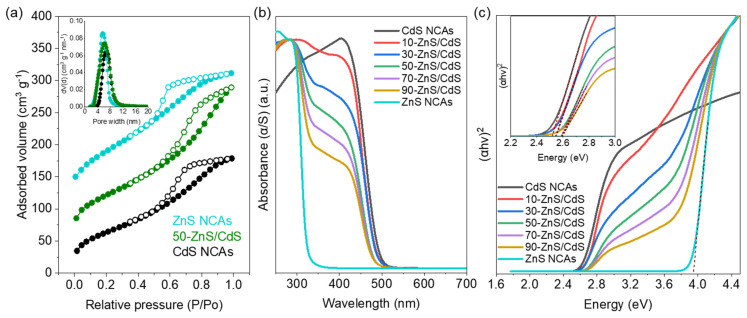
The development of functional catalysts for the photogeneration of hydrogen (H2) via water-splitting is crucial in the pursuit of sustainable energy solutions. To that end, metal-sulfide semiconductors, such as CdS and ZnS, can play a significant role in the process due to their interesting optoelectronic and catalytic properties. However, inefficient charge-carrier dissociation and poor photochemical stability remain significant limitations to photocatalytic efficiency. Herein, dual-semiconductor nanocomposites of ZnS/CdS nanocrystal assemblies (NCAs) are developed as efficient visible light photocatalysts for H2 generation. The resultant materials, synthesized via a polymer-templated self-polymerization method, comprise a unique combination of ~5-7 nm-sized metal-sulfide nanoparticles that are interlinked to form a 3D open-pore structure with large internal surface area (up to 285 m2 g-1) and uniform pores (circa 6-7 nm). By adjusting the ratio of constituent nanoparticles, the optimized ZnS/CdS catalyst with 50 wt.% ZnS content demonstrates a remarkable stability and visible light H2-evolution activity (~29 mmol g-1 h-1 mass activity) with an apparent quantum yield (AQY) of 60% at 420 nm. Photocatalytic evaluation experiments combined with electrochemical and spectroscopic studies suggest that the superior photocatalytic performance of these materials stems from the accessible 3D open-pore structure and the efficient defect-mediated charge transfer mechanism at the ZnS/CdS nanointerfaces. Overall, this work provides a new perspective for designing functional and stable photocatalytic materials for sustainable H2 production.

Keywords: ZnS/CdS heterojunctions; cadmium sulfide; mesoporous materials; metal chalcogenides; nanocomposites; nanoparticles; photocatalytic hydrogen production; water splitting; zinc sulfide.


Conflict of interest statement

The authors declare no conflict of interest.

Figures

Figure 1
Figure 1
(a) Schematic representation of the synthetic procedure of mesoporous ZnS/CdS NCAs. (b) Typical XRD patterns of mesoporous CdS and ZnS NCAs and the as-prepared ZnS/CdS nanocomposites with different ZnS loadings.
Figure 2
Figure 2
(a) Typical FE-SEM image, (b) EDS mappings of Cd, Zn and S elements, (c) TEM image and high magnification TEM image (inset) showing CdS (yellow circles) and ZnS (white circles) nanoparticles in intimate contact, and (d) HRTEM image for the mesoporous 50-ZnS/CdS nanocomposite. In HRTEM, the lattice fringes with d-spacings of 3.1 and 3.4 Å are indexed to the (111) planes of the cubic structures of ZnS (white lines) and CdS (yellow lines), respectively.
Figure 3
Figure 3
(a) Cd 3d, (b) Zn 2p and (c) S 2p XPS core-level spectra of mesoporous CdS and ZnS NCAs and the 50-ZnS/CdS nanocomposite.
Figure 4
Figure 4
(a) Comparative N2 adsorption (filled cycles) and desorption (open cycles) isotherms at −196 °C and (inset) the corresponding NLDFT pore size distribution plots calculated from the adsorption branch of isotherms for the mesoporous CdS, ZnS and 50-ZnS/CdS NCAs. For clarity, the isotherms of 50-ZnS/CdS and ZnS NCAs are offset by 50 and 100 cm3 g−1, respectively. (b) UV-vis/NIR diffuse reflectance spectra and (c) Tauc plots (i.e., the curves of (αhν)2 versus photon energy (hν), where α, h and ν are the absorption coefficient, Planck’s constant and light frequency, respectively) of mesoporous CdS, ZnS and ZnS/CdS NCAs with different wt.% ZnS content. Inset: magnification of the Tauc plot in the energy range of 2.2–3.0 eV for clarity.
Figure 5
Figure 5
(a) Photocatalytic H2 evolution activities for mesoporous CdS, ZnS and the different ZnS/CdS NCAs, together with the ZnS/CdS bulk and ZnS/CdS RNAs reference catalysts with 50 wt.% ZnS content. The photocatalytic reactions were carried out in an airtight reactor, using 1 mg mL−1 catalyst concentration in a 0.35 M Na2S and 0.25 M Na2SO3 aqueous electrolyte. (b) Photocatalytic H2 evolution rates for the mesoporous 50-ZnS/CdS catalyst (1 mg mL−1 catalyst concentration) using different concentrations of Na2S/Na2SO3 reagents and (c) different mass loadings of the catalyst in a 1.4 M Na2S and 1.0 M Na2SO3 aqueous electrolyte. (d) Photocatalytic recycling tests of the 50-ZnS/CdS catalyst (1 mg mL−1) in a 1.4 M Na2S and 1.0 M Na2SO3 aqueous electrolyte. All the H2-evolution rates obtained as an average over the initial 3-h reaction period. All photocatalytic tests were conducted under visible light irradiation using a 300 W Xenon light source with a UV cutoff filter (λ ≥ 420 nm).
Figure 6
Figure 6
(a) Mott–Schottky plots where the EFB values are obtained from the intercepts of the extrapolated linear fits of the 1/C2 vs. potential curves, (b) energy band diagrams (the band-edge diagram of the ZnS/CdS bulk sample with 50 wt.% ZnS is also given) and (c) EIS Nyquist plots and equivalent circuit model (inset) for the mesoporous CdS, ZnS and ZnS/CdS NCAs. (d) Comparative time-resolved photoluminescence (TR-PL) decay curves of mesoporous CdS and 50-ZnS/CdS NCAs and ZnS/CdS bulk reference with 50 wt.% ZnS content.
Figure 7
Figure 7
(a) Schematic energy diagram for the point defect states in ZnS (VS = sulfur vacancy, IS = interstitial sulfur, VZn = zinc vacancy, and IZn = interstitial zinc). The defect-state energy levels are estimated according to the peak positions of the ZnS NCAs PL spectrum. (b) Schematic illustration of the proposed quasi-type-II charge-transfer and visible light photocatalytic H2-generation mechanism for the ZnS/CdS nanocomposites. The presented energy levels correspond to the band diagram of the 50-ZnS/CdS catalyst (ECB = conduction band level, EVB = valence band level, EF = Fermi level and DS = donor states).

References

    1. Höök M., Tang X. Depletion of Fossil Fuels and Anthropogenic Climate Change—A Review. Energy Policy. 2013;52:797–809. doi: 10.1016/j.enpol.2012.10.046. - DOI
    1. Kampa M., Castanas E. Human Health Effects of Air Pollution. Environ. Pollut. 2008;151:362–367. doi: 10.1016/j.envpol.2007.06.012. - DOI - PubMed
    1. Mazloomi K., Gomes C. Hydrogen as an Energy Carrier: Prospects and Challenges. Renew. Sustain. Energy Rev. 2012;16:3024–3033. doi: 10.1016/j.rser.2012.02.028. - DOI
    1. Mohsin M., Ishaq T., Bhatti I.A., Maryam, Jilani A., Melaibari A.A., Abu-Hamdeh N.H. Semiconductor Nanomaterial Photocatalysts for Water-Splitting Hydrogen Production: The Holy Grail of Converting Solar Energy to Fuel. Nanomaterials. 2023;13:546. doi: 10.3390/nano13030546. - DOI - PMC - PubMed
    1. Li J., Wu N. Semiconductor-Based Photocatalysts and Photoelectrochemical Cells for Solar Fuel Generation: A Review. Catal. Sci. Technol. 2015;5:1360–1384. doi: 10.1039/C4CY00974F. - DOI

LinkOut - more resources