

Field-Flow Fractionation in Molecular Biology and Biotechnology
- PMID: 37687030
- PMCID: PMC10488451
- DOI: 10.3390/molecules28176201
Field-Flow Fractionation in Molecular Biology and Biotechnology
Abstract
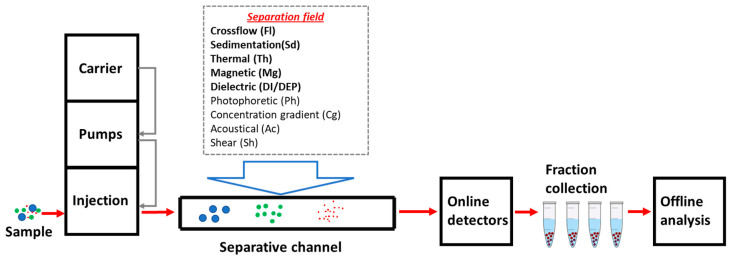
Field-flow fractionation (FFF) is a family of single-phase separative techniques exploited to gently separate and characterize nano- and microsystems in suspension. These techniques cover an extremely wide dynamic range and are able to separate analytes in an interval between a few nm to 100 µm size-wise (over 15 orders of magnitude mass-wise). They are flexible in terms of mobile phase and can separate the analytes in native conditions, preserving their original structures/properties as much as possible. Molecular biology is the branch of biology that studies the molecular basis of biological activity, while biotechnology deals with the technological applications of biology. The areas where biotechnologies are required include industrial, agri-food, environmental, and pharmaceutical. Many species of biological interest belong to the operational range of FFF techniques, and their application to the analysis of such samples has steadily grown in the last 30 years. This work aims to summarize the main features, milestones, and results provided by the application of FFF in the field of molecular biology and biotechnology, with a focus on the years from 2000 to 2022. After a theoretical background overview of FFF and its methodologies, the results are reported based on the nature of the samples analyzed.
Keywords: asymmetrical flow field-flow fractionation (AF4); bio-nanoparticles; cell sorting; laser scattering; molecular biology; native separation; pharmaceutics; separation science.
Conflict of interest statement
V.M., B.R., P.R. and A.Z. are associates of the academic spinoff company byFlow Srl (Bologna, Italy). The company’s mission includes know-how transfer, development, and application of novel technologies and methodologies for the analysis and characterization of samples of nano-biotechnological interest. B.R., P.R. and A.Z. are associates of the academic spinoff company Stem Sel Srl (Bologna, Italy). The company’s mission includes the development and production of novel technologies and methodologies for the separation and characterization of cells and biosamples. All the other authors report no conflicts of interest.
Figures
Similar articles
-
The use of asymmetrical flow field-flow fractionation in pharmaceutics and biopharmaceutics.Eur J Pharm Biopharm. 2004 Sep;58(2):369-83. doi: 10.1016/j.ejpb.2004.03.034. Eur J Pharm Biopharm. 2004. PMID: 15296962 Review.
-
Electrical asymmetrical flow field-flow fractionation: Fundamentals, evolution, applications, and prospects.J Chromatogr A. 2025 Jan 4;1739:465522. doi: 10.1016/j.chroma.2024.465522. Epub 2024 Nov 14. J Chromatogr A. 2025. PMID: 39579547 Review.
-
Advanced analysis of polymer emulsions: Particle size and particle size distribution by field-flow fractionation and dynamic light scattering.J Chromatogr A. 2016 Apr 15;1442:94-106. doi: 10.1016/j.chroma.2016.03.013. Epub 2016 Mar 9. J Chromatogr A. 2016. PMID: 26987415
-
Influence of oscillating main flow on separation efficiency in asymmetrical flow field-flow fractionation.J Chromatogr A. 2021 Mar 15;1640:461941. doi: 10.1016/j.chroma.2021.461941. Epub 2021 Jan 27. J Chromatogr A. 2021. PMID: 33556685
-
[Present situation and development trends of asymmetrical flow field-flow fractionation].Se Pu. 2017 Sep 8;35(9):918-926. doi: 10.3724/SP.J.1123.2017.05021. Se Pu. 2017. PMID: 29048848 Review. Chinese.
Cited by
-
Carrier-free nanoparticles-new strategy of improving druggability of natural products.J Nanobiotechnology. 2025 Feb 14;23(1):108. doi: 10.1186/s12951-025-03146-y. J Nanobiotechnology. 2025. PMID: 39953594 Free PMC article. Review.
-
Evaluating the impact of bioinspired counterion inclusion on silk nanoparticle physicochemical attributes and physical stability.Nanoscale Adv. 2025 Jul 21. doi: 10.1039/d5na00365b. Online ahead of print. Nanoscale Adv. 2025. PMID: 40734701 Free PMC article.
-
Online Coupling of Asymmetrical Flow Field-Flow Fractionation with Native Mass Spectrometry for Monoclonal Antibody Characterization.J Am Soc Mass Spectrom. 2025 Jul 2;36(7):1518-1526. doi: 10.1021/jasms.5c00089. Epub 2025 Jun 11. J Am Soc Mass Spectrom. 2025. PMID: 40495648 Free PMC article.
-
Mediation effect analysis of lipoprotein levels on BMI and cardiovascular outcomes in patients with heart failure.BMC Cardiovasc Disord. 2024 Oct 12;24(1):553. doi: 10.1186/s12872-024-04155-9. BMC Cardiovasc Disord. 2024. PMID: 39395939 Free PMC article.
-
Multitechnique characterization of eco-corona formation on airborne nanoplastics.RSC Adv. 2025 Aug 28;15(37):30849-30864. doi: 10.1039/d5ra03254g. eCollection 2025 Aug 22. RSC Adv. 2025. PMID: 40895726 Free PMC article.
References
-
- Schimpf M.E., Caldwell K., Giddings J.C. Field-Flow Fractionation Handbook. John Wiley & Sons; Hoboken, NJ, USA: 2000.
-
- Marassi V., Macis M., Giordani S., Ferrazzano L., Tolomelli A., Roda B., Zattoni A., Ricci A., Reschiglian P., Cabri W. Application of Af4-Multidetection to Liraglutide in Its Formulation: Preserving and Representing Native Aggregation. Molecules. 2022;27:5485. doi: 10.3390/molecules27175485. - DOI - PMC - PubMed
Publication types
MeSH terms
LinkOut - more resources
Full Text Sources
