

A Low Complexity Rolling Bearing Diagnosis Technique Based on Machine Learning and Smart Preprocessing
- PMID: 37688002
- PMCID: PMC10490720
- DOI: 10.3390/s23177546
A Low Complexity Rolling Bearing Diagnosis Technique Based on Machine Learning and Smart Preprocessing
Abstract
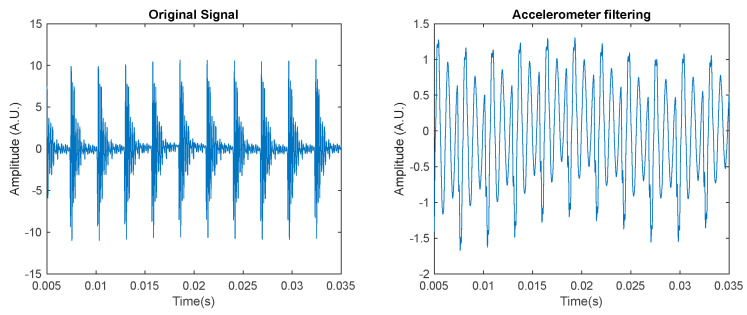
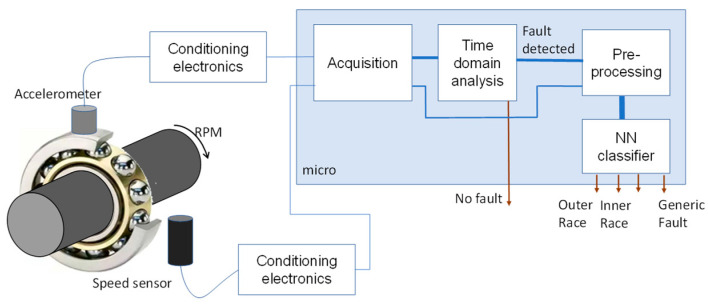
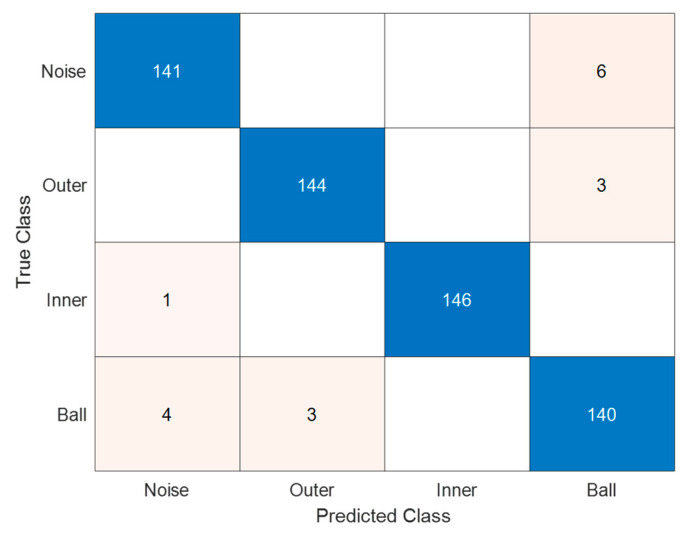
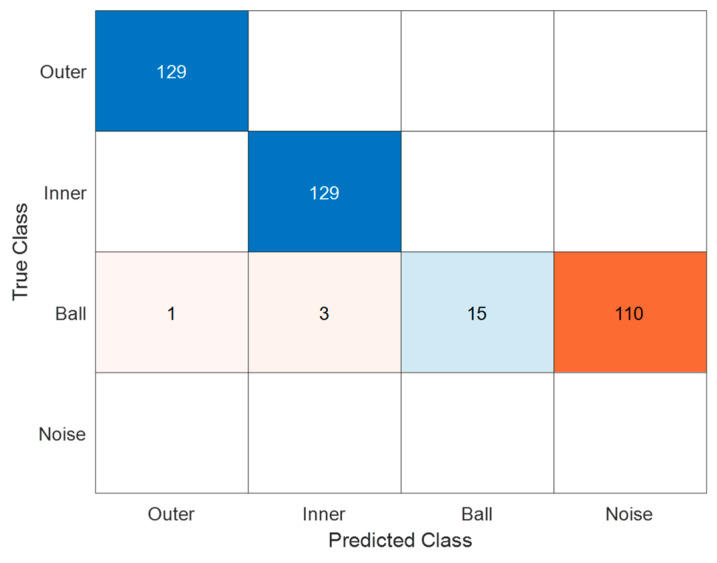
In this work, we present a diagnosis system for rolling bearings that leverages simultaneous measurements of vibrations and machine rotation speed. Our approach combines the robustness of simple time domain methods for fault detection with the potential of machine learning techniques for fault location. This research is based on a neural network classifier, which exploits a simple and novel preprocessing algorithm specifically designed for minimizing the dependency of the classifier performance on the machine working conditions, on the bearing model and on the acquisition system set-up. The overall diagnosis system is based on light algorithms with reduced complexity and hardware resource demand and is designed to be deployed in embedded electronics. The fault diagnosis system was trained using emulated data, exploiting an ad-hoc test bench thus avoiding the problem of generating enough data, achieving an overall classifier accuracy larger than 98%. Its noteworthy ability to generalize was proven by using data emulating different working conditions and acquisition set-ups and noise levels, obtaining in all the cases accuracies greater than 97%, thereby proving in this way that the proposed system can be applied in a wide spectrum of different applications. Finally, real data from an on-line database containing vibration signals obtained in a completely different scenario are used to demonstrate the distinctive capability of the proposed system to generalize.
Keywords: condition monitoring; embedded systems; fault bearing fault diagnosis; machine learning.
Conflict of interest statement
The authors declare no conflict of interest.
Figures
Similar articles
-
Application of Teager-Kaiser Energy Operator in the Early Fault Diagnosis of Rolling Bearings.Sensors (Basel). 2022 Sep 3;22(17):6673. doi: 10.3390/s22176673. Sensors (Basel). 2022. PMID: 36081131 Free PMC article.
-
A Novel Fault Diagnosis Method for Rolling Bearing Based on Hierarchical Refined Composite Multiscale Fluctuation-Based Dispersion Entropy and PSO-ELM.Entropy (Basel). 2022 Oct 24;24(11):1517. doi: 10.3390/e24111517. Entropy (Basel). 2022. PMID: 36359611 Free PMC article.
-
Fault Diagnosis of Rolling Bearings Based on a Residual Dilated Pyramid Network and Full Convolutional Denoising Autoencoder.Sensors (Basel). 2020 Oct 9;20(20):5734. doi: 10.3390/s20205734. Sensors (Basel). 2020. PMID: 33050210 Free PMC article.
-
Rolling Bearing Fault Detection System and Experiment Based on Deep Learning.Comput Intell Neurosci. 2022 Sep 27;2022:8913859. doi: 10.1155/2022/8913859. eCollection 2022. Comput Intell Neurosci. 2022. PMID: 36203721 Free PMC article.
-
A Review on Rolling Bearing Fault Signal Detection Methods Based on Different Sensors.Sensors (Basel). 2022 Oct 30;22(21):8330. doi: 10.3390/s22218330. Sensors (Basel). 2022. PMID: 36366032 Free PMC article. Review.
Cited by
-
Recent Trends in Non-Destructive Testing Approaches for Composite Materials: A Review of Successful Implementations.Materials (Basel). 2025 Jul 2;18(13):3146. doi: 10.3390/ma18133146. Materials (Basel). 2025. PMID: 40649634 Free PMC article. Review.
References
-
- Zhang S., Zhang S., Wang B., Habetler T.G. Deep learning algorithms for bearing fault diagnostics—A comprehensive review. IEEE Access. 2020;8:29857–29881. doi: 10.1109/ACCESS.2020.2972859. - DOI
-
- Bell R.N., McWilliams D.W., O’Donnell P., Singh C., Wells S.J. Report of large motor reliability survey of industrial and commercial installations, part I. IEEE Trans. Ind. Appl. 1985;IA-21:853–864.
-
- Bell R.N., Heising C.R., O’Donnell P., Wells S.J., Singh C. Report of large motor reliability survey of industrial and commercial installations, part II, IEEE Trans. Ind. Appl. 1985;IA-21:865–872.
-
- Kudelina K., Baraškova T., Shirokova V., Vaimann T., Rassõlkin A. Fault Detecting Accuracy of Mechanical Damages in Rolling Bearings. Machines. 2022;10:86. doi: 10.3390/machines10020086. - DOI
-
- Peng H., Zhang H., Fan Y., Shangguan L., Yang Y. A Review of Research on Wind Turbine Bearings’ Failure Analysis and Fault Diagnosis. Lubricants. 2023;11:14. doi: 10.3390/lubricants11010014. - DOI
LinkOut - more resources
Full Text Sources
