. 2023 Dec 1;44(17):5810-5827.
doi: 10.1002/hbm.26478. Epub 2023 Sep 9.

Both stronger and weaker cerebro-cerebellar functional connectivity patterns during processing of spoken sentences in autism spectrum disorder

Affiliations

Both stronger and weaker cerebro-cerebellar functional connectivity patterns during processing of spoken sentences in autism spectrum disorder

Jussi Alho et al. Hum Brain Mapp. .

Abstract

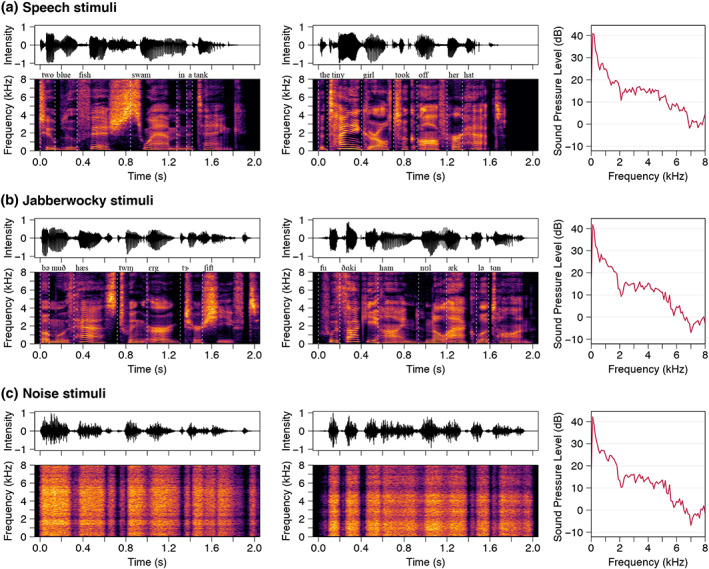
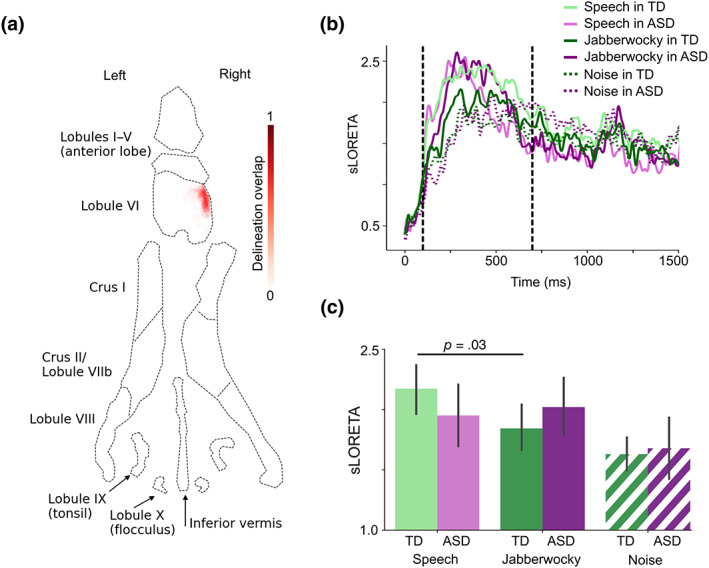
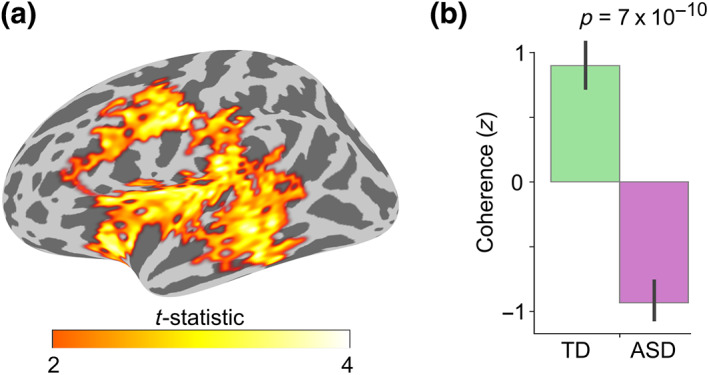
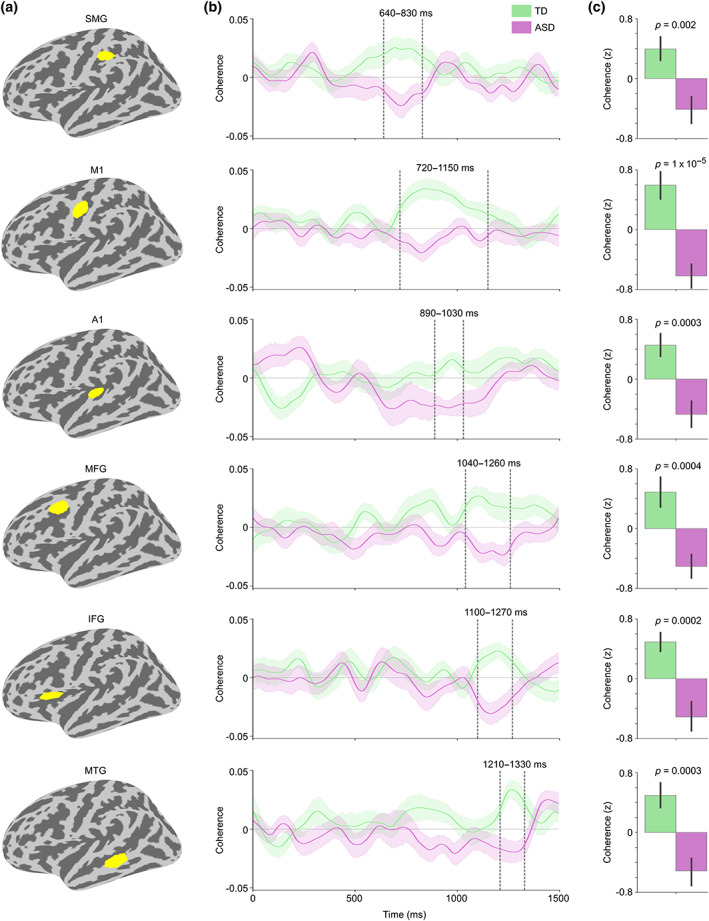
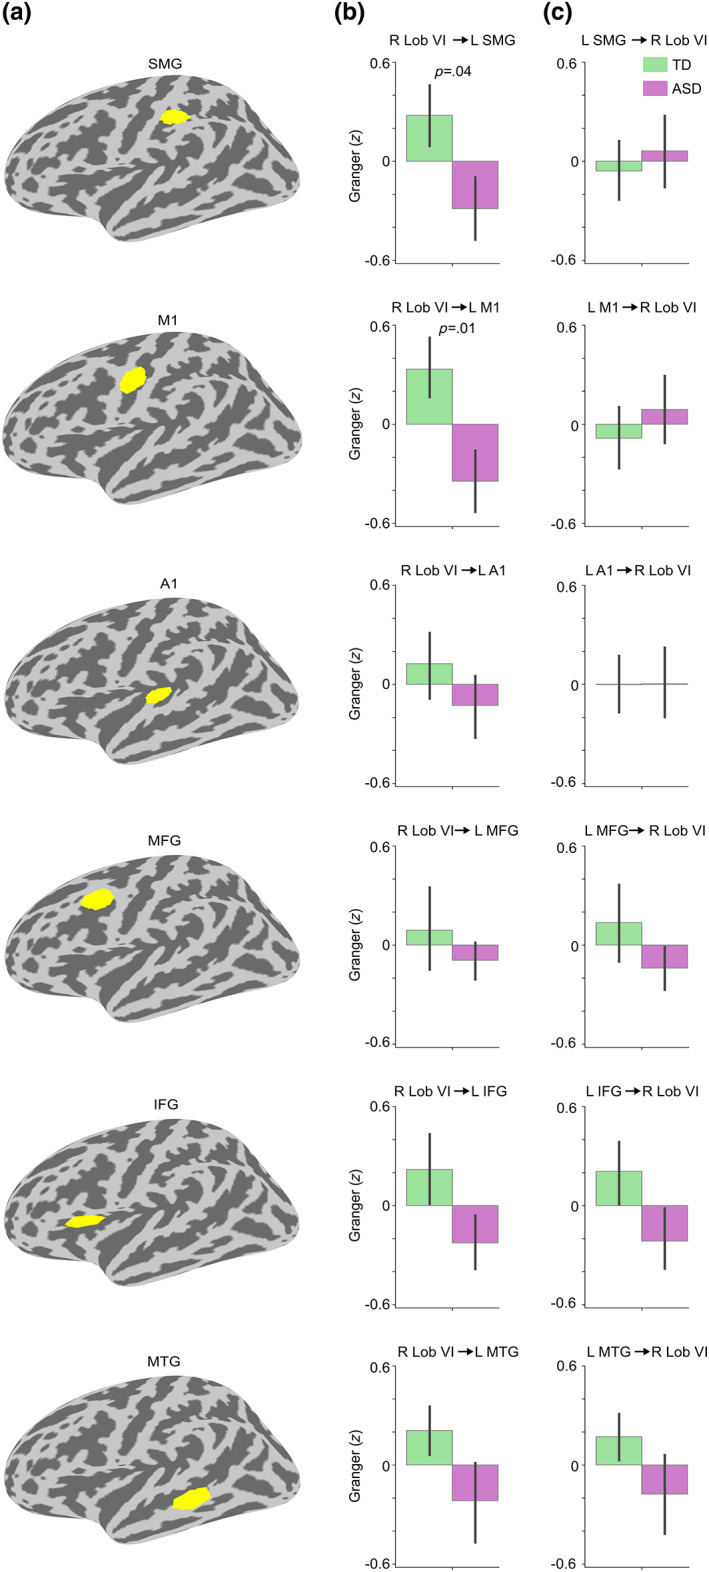
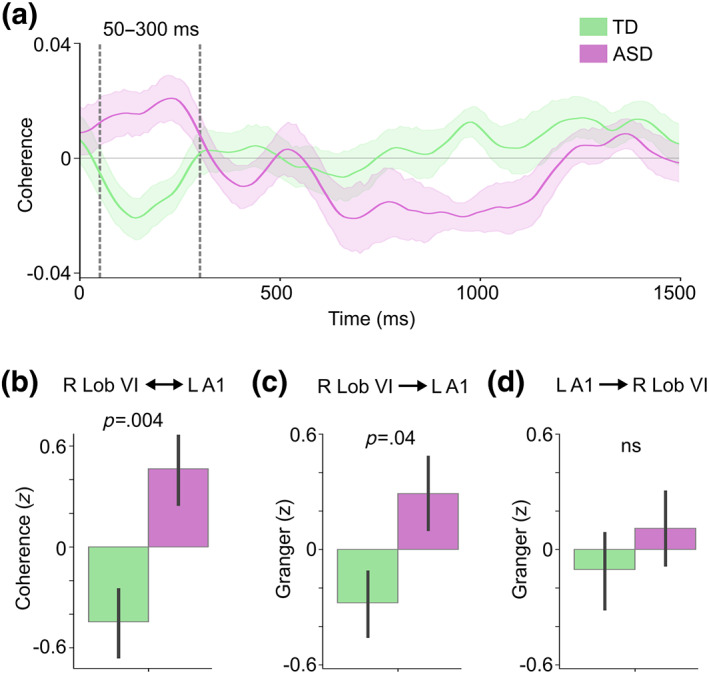
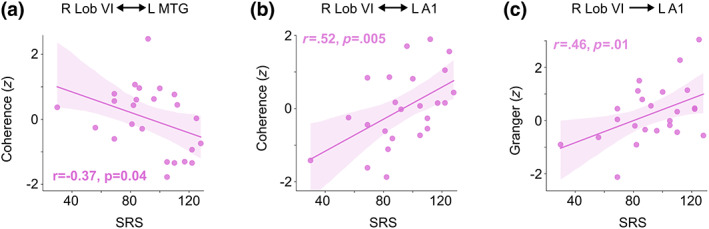
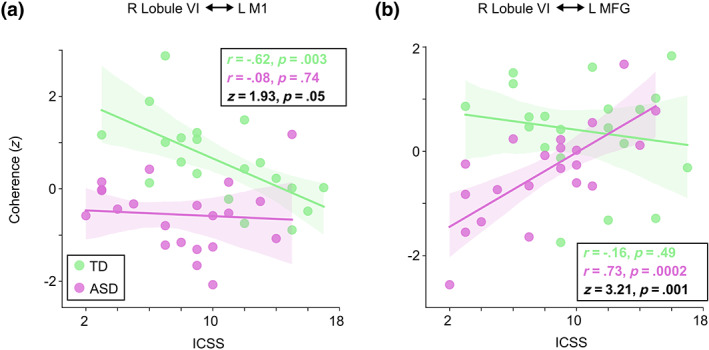
Cerebellar differences have long been documented in autism spectrum disorder (ASD), yet the extent to which such differences might impact language processing in ASD remains unknown. To investigate this, we recorded brain activity with magnetoencephalography (MEG) while ASD and age-matched typically developing (TD) children passively processed spoken meaningful English and meaningless Jabberwocky sentences. Using a novel source localization approach that allows higher resolution MEG source localization of cerebellar activity, we found that, unlike TD children, ASD children showed no difference between evoked responses to meaningful versus meaningless sentences in right cerebellar lobule VI. ASD children also had atypically weak functional connectivity in the meaningful versus meaningless speech condition between right cerebellar lobule VI and several left-hemisphere sensorimotor and language regions in later time windows. In contrast, ASD children had atypically strong functional connectivity for in the meaningful versus meaningless speech condition between right cerebellar lobule VI and primary auditory cortical areas in an earlier time window. The atypical functional connectivity patterns in ASD correlated with ASD severity and the ability to inhibit involuntary attention. These findings align with a model where cerebro-cerebellar speech processing mechanisms in ASD are impacted by aberrant stimulus-driven attention, which could result from atypical temporal information and predictions of auditory sensory events by right cerebellar lobule VI.

Keywords: MEG; autism; cerebellum; functional connectivity; speech.


Conflict of interest statement

The authors declare no conflicts of interest.

Figures

FIGURE 1
FIGURE 1
Stimulus acoustics. Stimulus waveforms (top), spectrograms (bottom), and their long‐term average spectra (right) are shown for the (a) Speech, (b) Jabberwocky, and (c) Noise conditions. Transcriptions of the sentences are written above the spectrograms. Noise stimuli were modulated with the spectra and amplitude envelopes of stimuli in the Jabberwocky condition. The participants watched a movie with the sound off while the sentences were presented in random order via earphones.
FIGURE 2
FIGURE 2
ERFs in right cerebellar lobule VI. (a) Flatmap representation of the cerebellum with probability map of the right lobule VI delineation overlap across participants (N = 51). (b) sLORETA time courses for each group and condition from the region depicted in a. Vertical dashed lines show the time window of interest (100–700 ms after stimulus onset). (c) Bar graph of group means averaged within the time window in B. The p‐value is from a paired‐samples t‐test (two‐tailed). Error bars represent standard error of the mean. See Figure S3 for the cortical ERFs.
FIGURE 3
FIGURE 3
Group difference in the Speech versus Jabberwocky functional connectivity with the right cerebellar lobule VI seed. (a) Spatial extent of the spatio‐temporal group difference cluster depicted on inflated left lateral cerebral hemisphere. The spatial cluster representation was derived by collapsing the temporal dimension by selecting the time point of the largest group difference for each vertex. (b) Bar graph of group means with p‐value from two‐sample t‐test (two‐tailed). Coherence values were averaged within the whole spatio‐temporal cluster, corrected for NVIQ, and the residuals were z‐scored. Error bars represent standard error of the mean.
FIGURE 4
FIGURE 4
Coherence between right cerebellar lobule VI and cortical ROIs for Speech versus Jabberwocky in TD and ASD groups. (a) ROIs from top to bottom: supramarginal gyrus (SMG), primary motor cortex (M1), primary auditory cortex (A1), middle frontal gyrus (MFG), inferior frontal gyrus (IFG), and middle temporal gyrus (MTG). (b) Right lobule VI seed coherence time courses from the ROIs in TD and ASD groups. Vertical dashed lines show time windows of significant group difference in the permutation test (also marked above the time windows). The ROI time courses are arranged from the earliest to the latest significant group difference. Shaded areas around the group mean time courses indicate standard error of the mean. (c) Bar graph of group means averaged within the time windows in b with p‐values from two‐sample t‐tests (two‐tailed). Coherence values were corrected for NVIQ and the residuals were z‐scored. Error bars represent standard error of the mean.
FIGURE 5
FIGURE 5
Directionality of the Speech versus Jabberwocky connectivity between right lobule VI and cortical ROIs. (a) The cortical ROIs depicted on left hemisphere inflated surface. The ROIs are arranged based on the latency of the group difference in the right lobule VI seed coherence (from the earliest to the latest; see Figure 4). (b) Bar graphs of group means for the directed connection from right lobule VI to the ROIs. (c) Bar graphs of group means for the directed connection from the ROIs to right lobule VI. In b and c, the direction of the connectivity is shown on top of the graphs. For significant group differences, the p‐value from the two‐sample t‐test (two‐tailed) is shown on top of the bar graph. The Granger causality was estimated using 8–12 Hz center frequencies and sliding window center points matching the ROI‐specific group difference time windows (see Figure 4) rounding the beginning down and the end up to the nearest 50 ms. For example, the Granger causality sliding window center points for SMG were 600–850 ms. Error bars around the mean represent standard error of the mean. Granger causality values were corrected for NVIQ and the residuals were z‐scored. L, left; R, right.
FIGURE 6
FIGURE 6
Group difference in the Speech versus Jabberwocky functional and effective connectivity between right lobule VI and left primary auditory cortex (A1). (a) Right lobule VI seed coherence time courses from the A1 ROI in TD and ASD groups. Vertical dashed lines show the 50–300 ms time window of interest. Shaded areas around the group mean time courses indicate standard error of the mean. (b) Bar graph of group means averaged within the time window of interest in A. (c) Bar graph of group means for the directed connectivity from right lobule VI to left A1 with p‐value from two‐sample t‐test (two‐tailed). (d) Bar graph of group means for the directed connectivity from left A1 to right lobule VI. In b–d, the direction of the connectivity is shown on top of the graphs. Granger causality in c and d was estimated using 8–12 Hz center frequencies and 125–300 ms sliding window center points relative to stimulus onset. Values in b–d were corrected for NVIQ and the residuals were z‐scored. The p‐values are from two‐sample t‐test (two‐tailed). Error bars around the mean represent standard error of the mean. L, left; ns, not significant; R, right.
FIGURE 7
FIGURE 7
Correlation between ASD severity and Speech versus Jabberwocky connectivity between right lobule VI and left cortical ROIs. (a) Scatter plot of SRS total scores against Speech versus Jabberwocky coherence between right lobule VI and left MTG within the 1210–1330 ms time window (see Figure 4). (b) Scatter plot of SRS total scores against Speech versus Jabberwocky coherence between right lobule VI and left A1 within the 50–300 ms time window (see Figure 6). (c) Scatter plot of SRS total scores against Speech versus Jabberwocky Granger causality scores. Granger causality was estimated using 8–12 Hz center frequencies and 125–300 ms sliding window center points relative to stimulus onset. The shaded areas around the regression line encompass the 95% confidence interval for the correlation. Correlation coefficient (r) and p‐value from Pearson correlation test (one‐tailed) are shown in each plot.
FIGURE 8
FIGURE 8
Correlation between attentional inhibition (ICSS) and Speech versus Jabberwocky functional connectivity between right lobule VI and left cortical ROIs. a) Scatter plot of ICSS against Speech versus Jabberwocky coherence between right lobule VI and left M1 within the 720–1150 ms group difference time window (see Figure 4). b) Scatter plot of ICSS against Speech versus Jabberwocky coherence between right lobule VI and left MFG within the 1040–1260 ms group difference time window. The coherence values were adjusted for NVIQ and the residuals were z‐scored. The shaded areas around the regression line encompass the 95% confidence interval for the correlation. Correlation coefficient (r) and p‐value from Pearson correlation test (two‐tailed) for the within‐group correlations as well as Fisher r‐to‐z transformed z‐scores and p‐values for the difference between the within‐group correlations are shown in each plot.

References

    1. Ahlfors, S. P. , Han, J. , Belliveau, J. W. , & Hämäläinen, M. S. (2010). Sensitivity of MEG and EEG to source orientation. Brain Topography, 23, 227–232. - PMC - PubMed
    1. Alaerts, K. , Nayar, K. , Kelly, C. , Raithel, J. , Milham, M. P. , & Di Martino, A. (2015). Age‐related changes in intrinsic function of the superior temporal sulcus in autism spectrum disorders. Social Cognitive and Affective Neuroscience, 10, 1413–1423. - PMC - PubMed
    1. Alho, J. , Bharadwaj, H. , Khan, S. , Mamashli, F. , Perrachione, T. K. , Losh, A. , McGuiggan, N. M. , Joseph, R. M. , Hämäläinen, M. S. , & Kenet, T. (2021). Altered maturation and atypical cortical processing of spoken sentences in autism spectrum disorder. Progress in Neurobiology, 203, 102077. - PMC - PubMed
    1. Alho, J. , Khan, S. , Mamashli, F. , Perrachione, T. K. , Losh, A. , McGuiggan, N. M. , Graham, S. , Nayal, Z. , Joseph, R. M. , Hämäläinen, M. S. , Bharadwaj, H. , & Kenet, T. (2023). Atypical cortical processing of bottom‐up speech binding cues in children with autism spectrum disorders. NeuroImage Clinical, 37, 103336. - PMC - PubMed
    1. Arnold Anteraper, S. , Guell, X. , D'Mello, A. , Joshi, N. , Whitfield‐Gabrieli, S. , & Joshi, G. (2019). Disrupted cerebrocerebellar intrinsic functional connectivity in young adults with high‐functioning autism spectrum disorder: A data‐driven, whole‐brain, high‐temporal resolution functional magnetic resonance imaging study. Brain Connectivity, 9, 48–59. - PubMed

Publication types