. 2023 Sep 8;15(17):8908-8929.
doi: 10.18632/aging.205005. Epub 2023 Sep 8.

TIMP1 shapes an immunosuppressive microenvironment by regulating anoikis to promote the progression of clear cell renal cell carcinoma

Affiliations

TIMP1 shapes an immunosuppressive microenvironment by regulating anoikis to promote the progression of clear cell renal cell carcinoma

Qiang Li et al. Aging (Albany NY). .

Abstract

Background: The association between ccRCC and Anoikis remains to be thoroughly investigated.

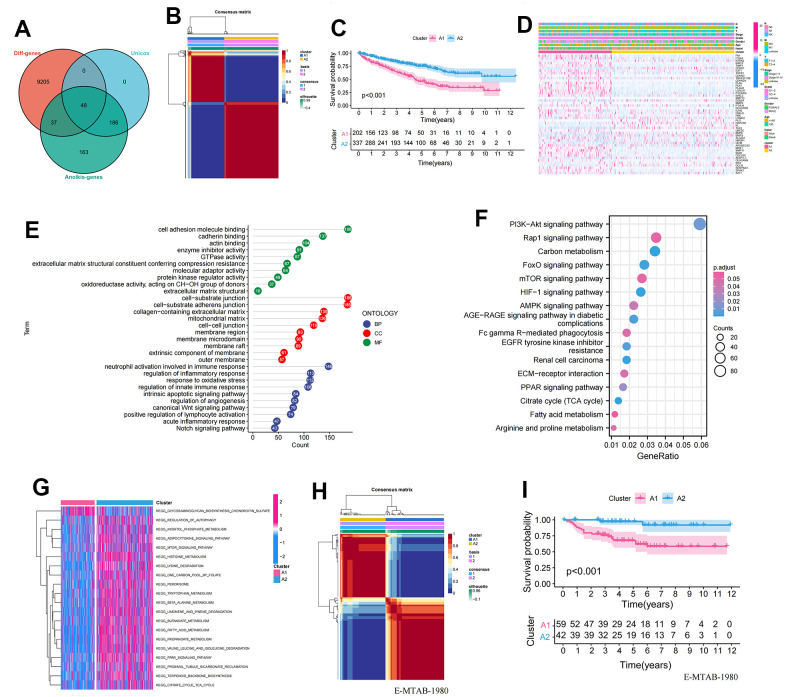
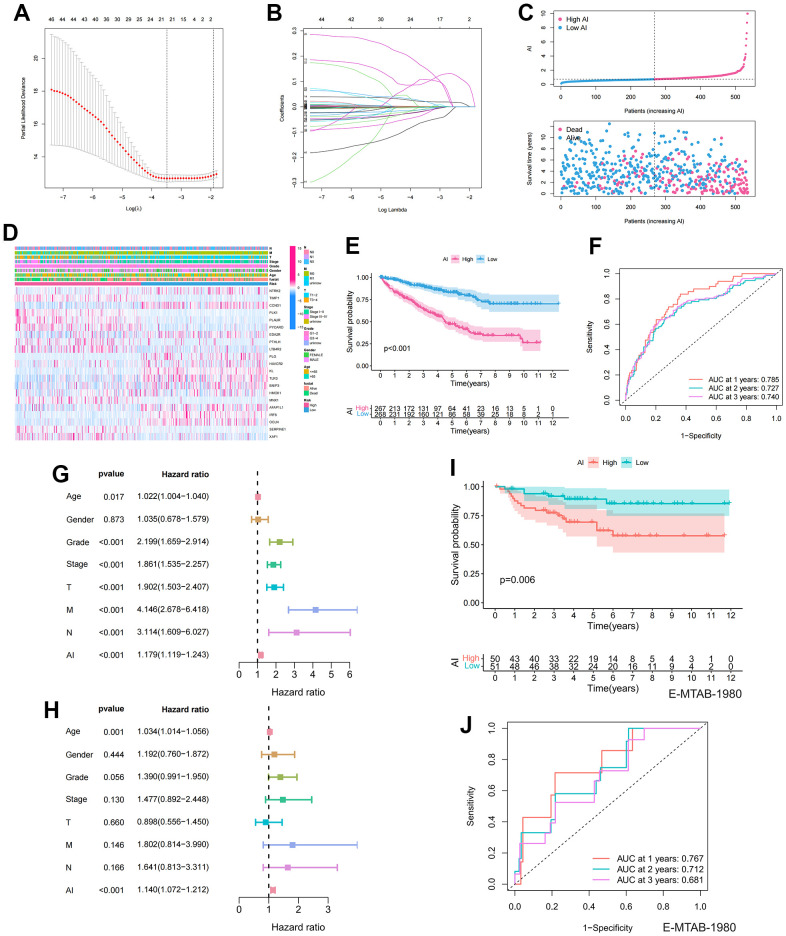
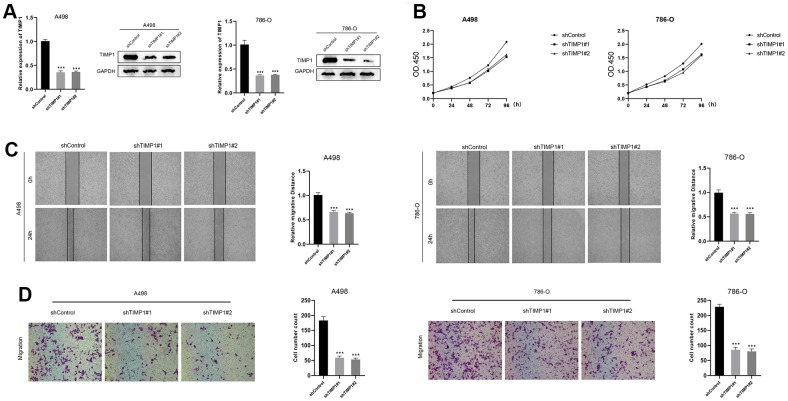
Methods: Anoikis-related clusters were identified using NMF. To identify prognostic anoikis-related genes (ARGs) and establish an optimal prognostic model, univariate Cox and LASSO regression were employed. The E-MTAB-1980 cohort was utilized for external validation. Multiple algorithms were used to evaluate the immune properties of the model. GO, KEGG and GSVA analyses were employed to analyze biological pathway functions. qRT-PCR was employed to measure RNA levels of specific genes. Cell Counting Kit-8, wound healing, and Transwell chamber assays were performed to determine changes in the proliferative and metastatic abilities of A498 and 786-O cells.

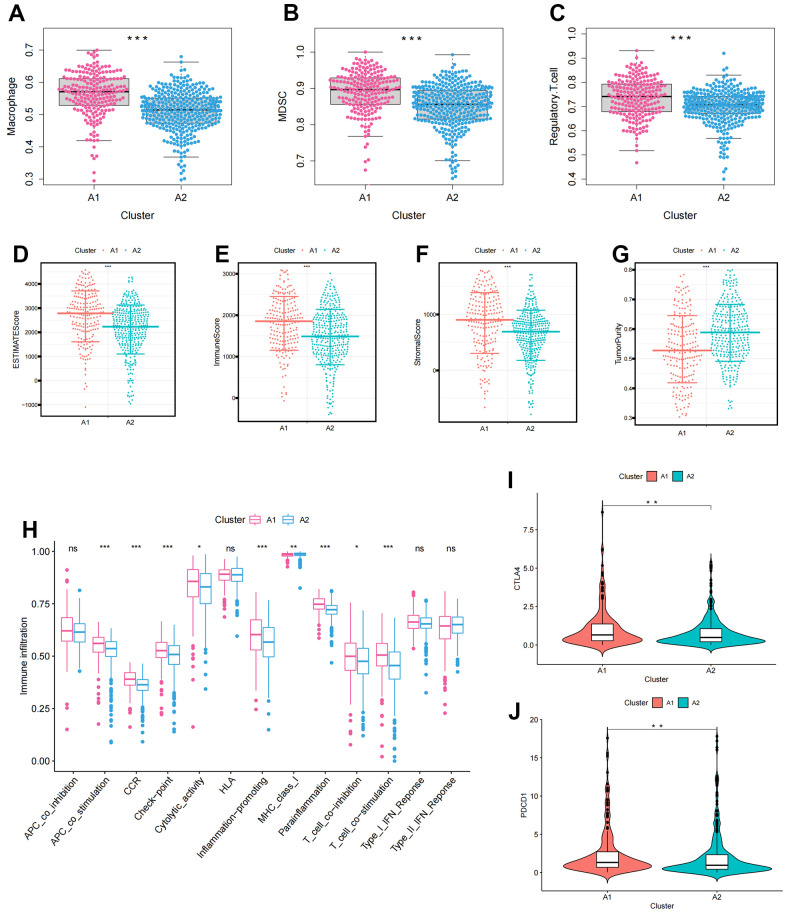
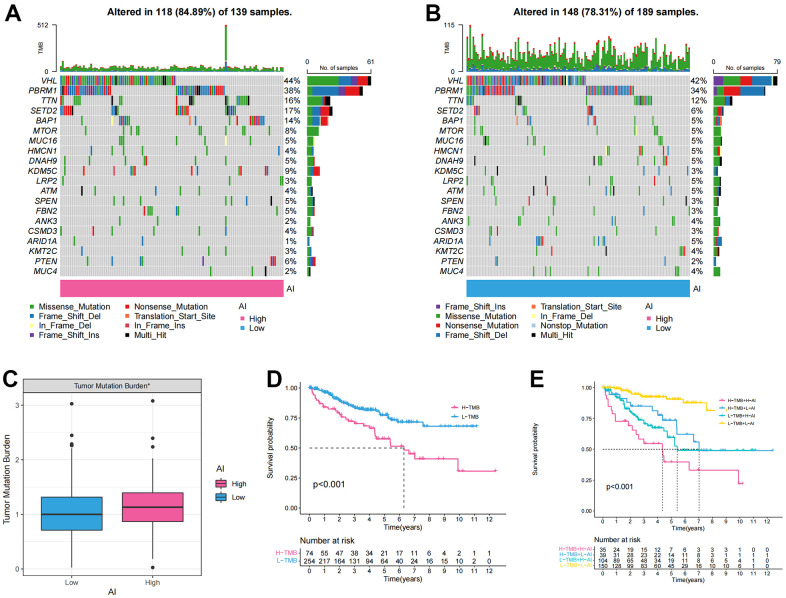
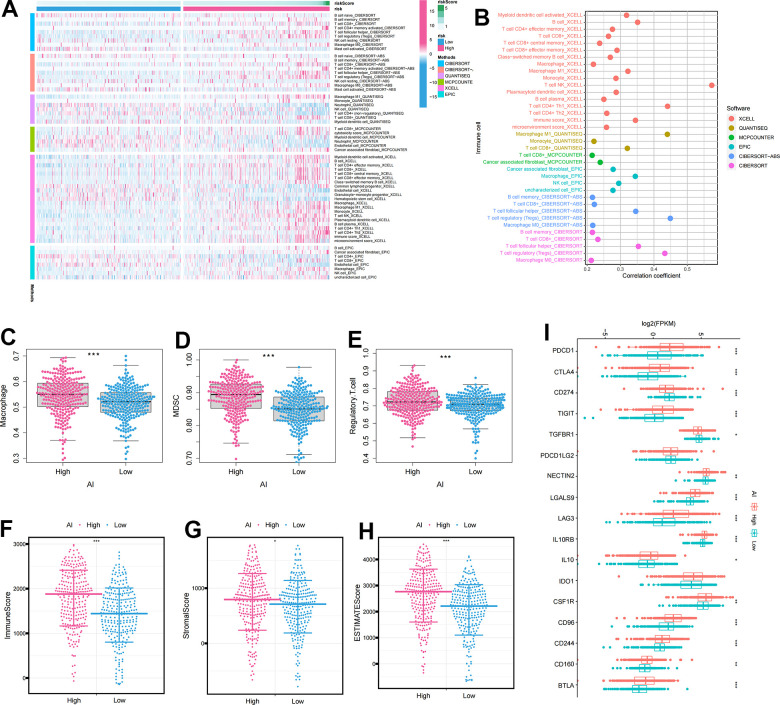
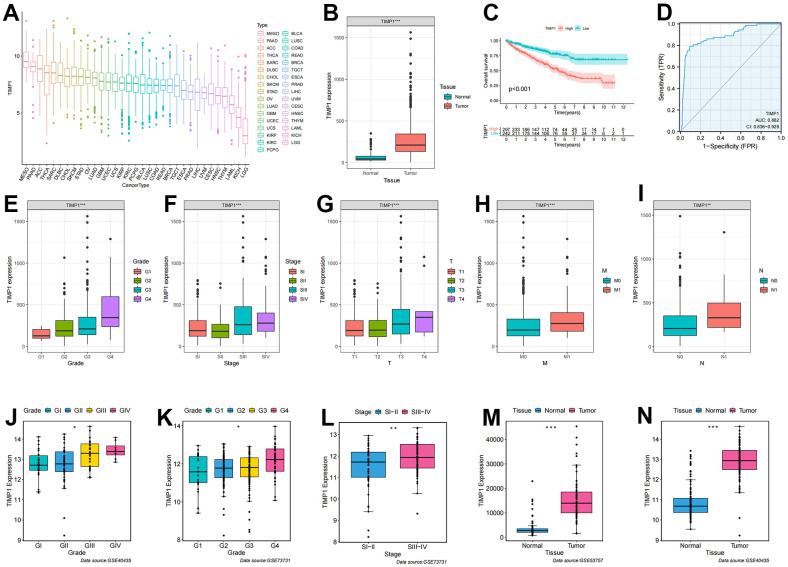
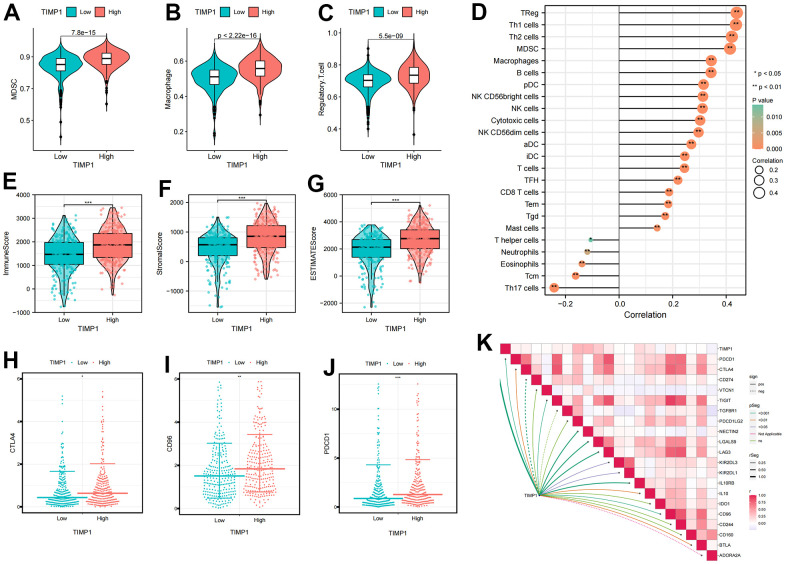
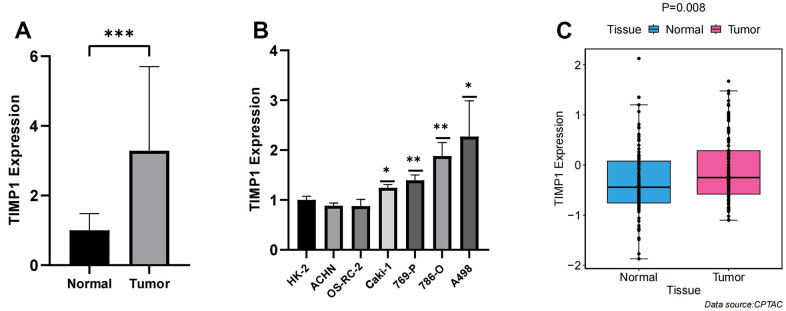
Results: Based on the expression of 21 prognostic ARGs, we constructed anoikis-related clusters with different prognostic and immune characteristics. The cluster A1 showed a worse prognosis, higher infiltration of immunosuppressive cells and enrichment of several oncogenic pathways. We also calculated the Anoikis Index (AI). Patients in high AI group had a worse prognosis, higher infiltration of immunosuppressive cells and higher expression of immunosuppressive checkpoints. TIMP1 exerted a tumor-promoting role in ccRCC and was significantly associated with immunosuppressive cells and checkpoints. The downregulation of TIMP1 negatively regulated ccRCC cell proliferation and metastasis.

Conclusions: ARGs played crucial roles in tumorigenesis and progression and were positively associated with a poor prognosis. AI had great accuracy in predicting the prognosis and immune characteristics of ccRCC patients. TIMP1 was significantly associated with clinicopathological variables and the immunosuppressive microenvironment, which could be exploited to design novel immunotherapies for ccRCC patients.

Keywords: TIMP1; anoikis; anoikis index; ccRCC; tumor microenvironment.


Conflict of interest statement

CONFLICTS OF INTEREST: The authors declare that they have no conflicts of interest.

Figures

Figure 1
Figure 1
Establishment and validation of anoikis-related clusters. (A) Screening of 48 ARGs associated with prognosis and differentially expressed; (B) Heatmap plot indicating the consensus matrix of NMF clustering results utilizing the gene expression profile in TCGA KIRC cohort, colored by two ccRCC clusters; (C) KM survival curves revealing the prognosis difference of the two clusters (A1, A2); (D) The distribution of anoikis-related genes expression profile and clinicopathological characteristics in A1 and A2 clusters; (E) The results of GO biological process enrichment of differentially expressed genes; (F) The results of KEGG pathways analysis of differentially expressed genes; (G) Results of GSVA enrichment analysis between clusters; (H) Heatmap plot indicating the consensus matrix of NMF clustering results utilizing the gene expression profile in the E-MTAB-1980 cohort, colored by two ccRCC clusters; (I) KM survival curves revealing the prognosis difference of the two clusters (A1, A2).
Figure 2
Figure 2
The immune infiltration characteristics in anoikis-related clusters. (AC) The differential expression of immunosuppressive cells between clusters (A) Macrophage; (B) MDSC; (C) Regulatory.T.cell; (DG) The differences in tumor microenvironment characteristics between clusters (D) ESTIMATEScore; (E) ImmuneScore; (F) StromalScore; (G) TumorPurity; (H) Boxplots showing the differences in immune function between clusters; (I, J) Differences in immune checkpoint expression between clusters (I) CTLA4; (J) PDCD1. The asterisks represented the statistical p-value (*p<0.05, **p<0.01, ***p<0.001).
Figure 3
Figure 3
Establishment and prognostic features of Anoikis index. (A, B) Lasso analysis of prognostic ARGs with minimum lambda value; (C) The risk curve of each sample reordered by AI and the scatter plot of the sample survival overview. The blue and pink dots represent survival and death, respectively; (D) The distribution of anoikis-related genes expression profile and clinicopathological characteristics in AI; (E) Overall survival curve showing the prognostic difference between high and low AI group; (F) ROC curves about AI in 1,2,3 years; (G, H) The univariate and multivariate Cox regression analysis of AI, age, gender, grade, stage, TMN stage; (I) Differences in survival between high and low AI groups in the E-MTAB-1980 cohort; (J) ROC curves about AI in 1,2,3 years in the E-MTAB-1980 cohort.
Figure 4
Figure 4
The tumor mutation burden characteristics of Anoikis index. (A, B) The waterfall chart showing the mutation frequency of the top 20 genes in the high and low AI groups; (C) Differences of the tumor mutation burden (TMB) between high and low AI groups; (D) KM survival curve showing the prognostic difference between high and low TMB groups; (E) KM survival curve showing OS of the combination of AI and TMB.
Figure 5
Figure 5
The immune infiltration characteristics of Anoikis index. (A) Distribution of immune cells in high and low AI groups under multiple algorithms; (B) The correlation between immune cells and AI under multiple algorithms; (CE) The differential expression of immunosuppressive cells between high and low AI groups (C) Macrophage; (D) MDSC; (E) Regulatory.T.cell; (FH) The differential expression of tumor microenvironment scores between high and low AI groups (F) ImmuneScore; (G) StromalScore; (H) ESTIMATEScore; (I) The differential expression of immune checkpoints between high and low AI groups. The asterisks represented the statistical p-value (*p<0.05, **p<0.01, ***p<0.001).
Figure 6
Figure 6
Correlation of TIMP1 expression profile with clinicopathological characteristics in ccRCC. (A) Expression profile of TIMP1 in 33 tumors; (B) Differential expression of TIMP1 in ccRCC and paracancerous tissues; (C) KM survival curves showing OS of TIMP1 in ccRCC; (D) ROC curves about TIMP1 in ccRCC; (EI) Differences in TIMP1 expression profile among clinicopathological variables (E) Grade; (F) Stage; (G) T stage; (H) M stage; (I) N stage; (JN) Differential expression of TIMP1 in different clinicopathological stages in the GEO validation datasets. (J, N) GSE40435; (K, L) GSE73731; (M) GSE53757.
Figure 7
Figure 7
Identification the immune infiltration characteristics of TIMP1 in ccRCC. (AC) The differential expression of immunosuppressive cells between high and low TIMP1 groups (A) MDSC; (B) Macrophage; (C) Regulatory.T.cell; (D) The correlation of TIMP1 expression profile with immune cells in ccRCC; (EG) The differential expression of tumor microenvironment scores between high and low TIMP1 groups (E) ImmuneScore; (F) StromalScore; (G) ESTIMATEScore; (HJ) The differential expression of immune checkpoints between high and low TIMP1 groups (H) CTLA4; (I) CD96); (J) PDCD1; (K) The correlation of TIMP1 expression profile with immunosuppressive checkpoints in ccRCC.
Figure 8
Figure 8
Verification of TIMP1 expression differences between carcinoma and adjacent tissue. (A) Bar plot for the relative expression of TIMP1 in ccRCC tissues and normal tissues; (B) Bar plot for the relative expression of TIMP1 in ccRCC and normal cell lines; (C) Difference of TIMP1 protein expression between ccRCC and adjacent tissues.
Figure 9
Figure 9
Down-regulation of TIMP1 suppressed the progression of ccRCC in vitro. (A) The expression of TIMP1 in A498 and 786-O cells was detected by RT-qPCR and Western blot; (B) TIMP1-knockdown suppressed ccRCC cell proliferation in A498 and 786-O cells; (C) Wound-healing tests demonstrated changes in ccRCC cell migration; (D) TIMP1-knockdown suppressed ccRCC cell metastasis in A498 and 786-O cells.

Similar articles

Cited by

References

    1. Ljungberg B, Bensalah K, Canfield S, Dabestani S, Hofmann F, Hora M, Kuczyk MA, Lam T, Marconi L, Merseburger AS, Mulders P, Powles T, Staehler M, et al.. EAU guidelines on renal cell carcinoma: 2014 update. Eur Urol. 2015; 67:913–24. 10.1016/j.eururo.2015.01.005 - DOI - PubMed
    1. Li Y, Lih TM, Dhanasekaran SM, Mannan R, Chen L, Cieslik M, Wu Y, Lu RJ, Clark DJ, Kołodziejczak I, Hong R, Chen S, Zhao Y, et al., and Clinical Proteomic Tumor Analysis Consortium. Histopathologic and proteogenomic heterogeneity reveals features of clear cell renal cell carcinoma aggressiveness. Cancer Cell. 2023; 41:139–63.e17. 10.1016/j.ccell.2022.12.001 - DOI - PMC - PubMed
    1. Barata PC, Rini BI. Treatment of renal cell carcinoma: Current status and future directions. CA Cancer J Clin. 2017; 67:507–24. 10.3322/caac.21411 - DOI - PubMed
    1. Bray F, Ferlay J, Soerjomataram I, Siegel RL, Torre LA, Jemal A. Global cancer statistics 2018: GLOBOCAN estimates of incidence and mortality worldwide for 36 cancers in 185 countries. CA Cancer J Clin. 2018; 68:394–424. 10.3322/caac.21492 - DOI - PubMed
    1. Yu Z, Lv Y, Su C, Lu W, Zhang R, Li J, Guo B, Yan H, Liu D, Yang Z, Mi H, Mo L, Guo Y, et al.. Integrative Single-Cell Analysis Reveals Transcriptional and Epigenetic Regulatory Features of Clear Cell Renal Cell Carcinoma. Cancer Res. 2023; 83:700–19. 10.1158/0008-5472.CAN-22-2224 - DOI - PMC - PubMed

Publication types

Substances