. 2023 Nov:67:102867.
doi: 10.1016/j.redox.2023.102867. Epub 2023 Sep 4.

Lactate-upregulated NADPH-dependent NOX4 expression via HCAR1/PI3K pathway contributes to ROS-induced osteoarthritis chondrocyte damage

Affiliations

Lactate-upregulated NADPH-dependent NOX4 expression via HCAR1/PI3K pathway contributes to ROS-induced osteoarthritis chondrocyte damage

Yi-Fan Huang et al. Redox Biol. 2023 Nov.

Abstract

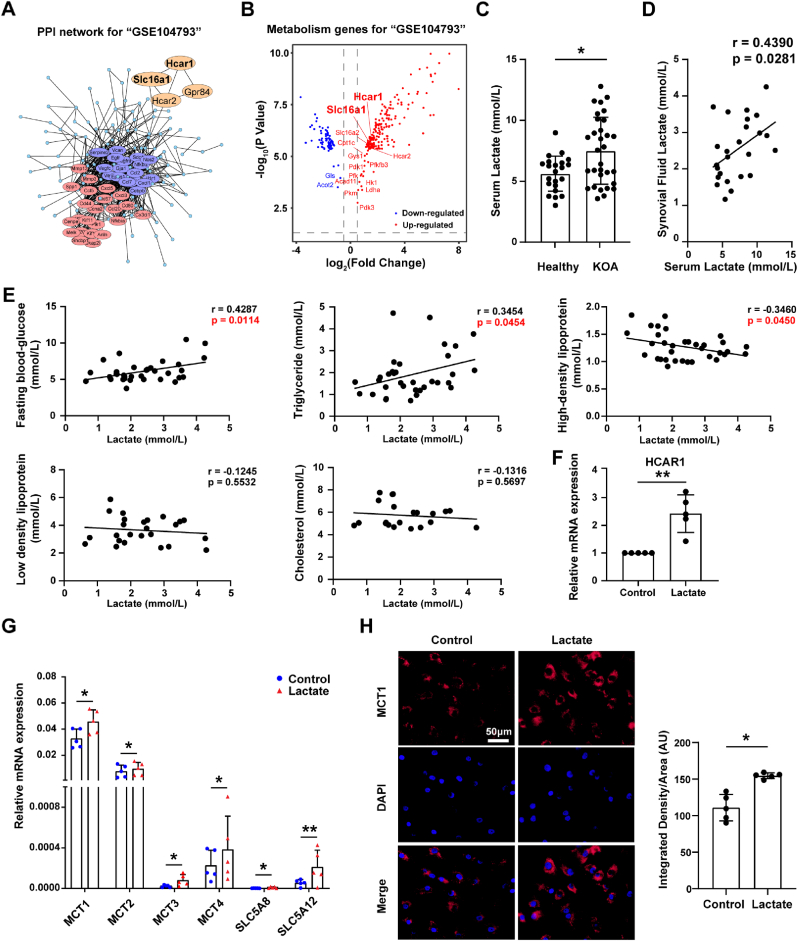
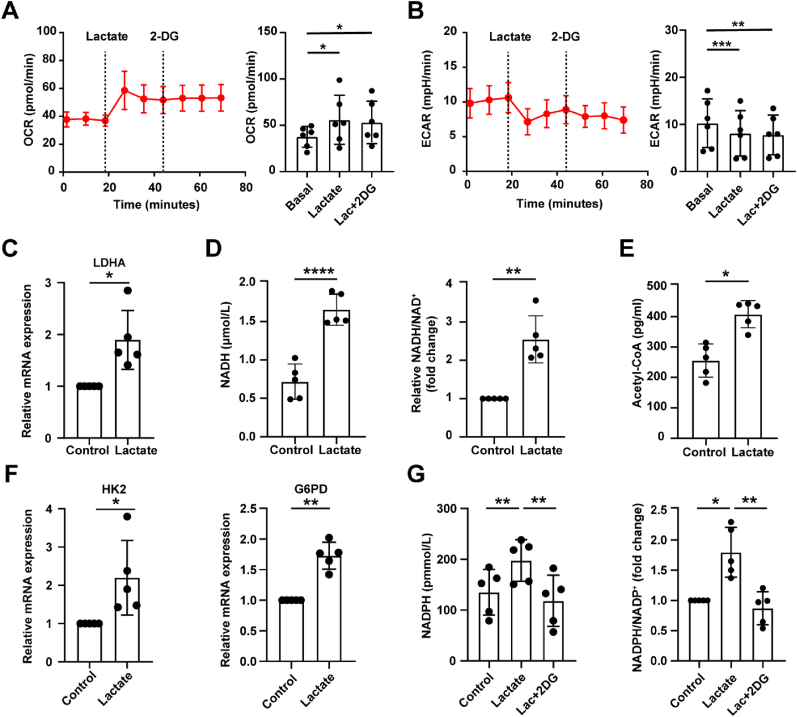
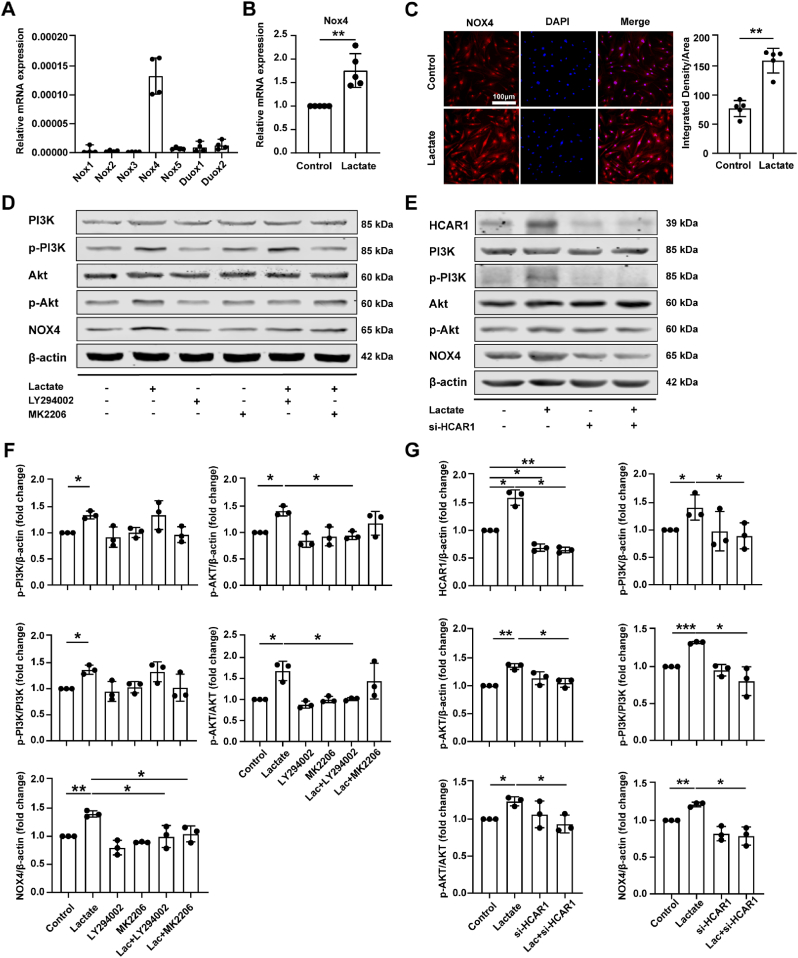
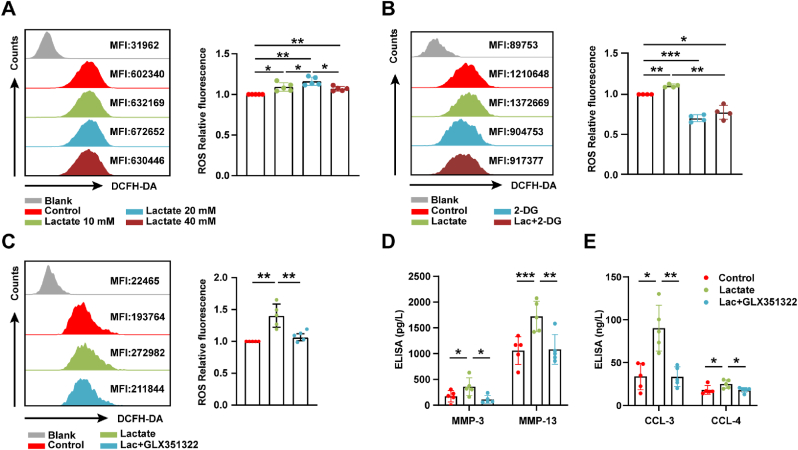
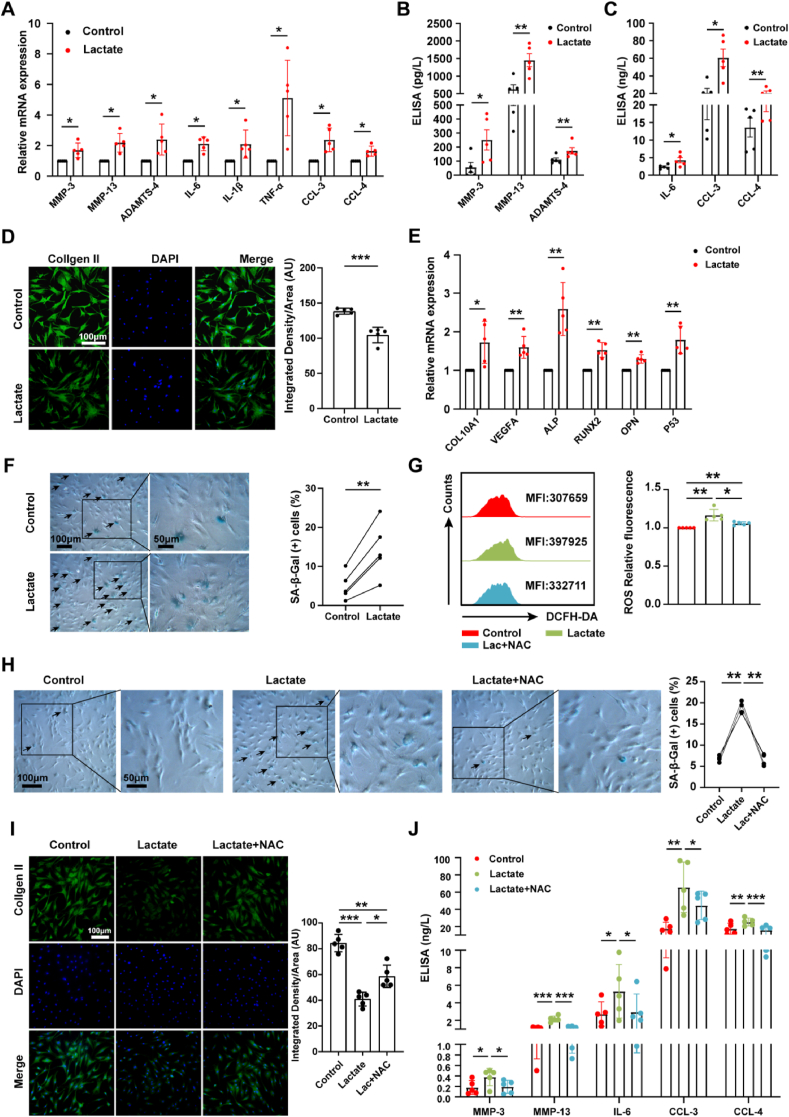
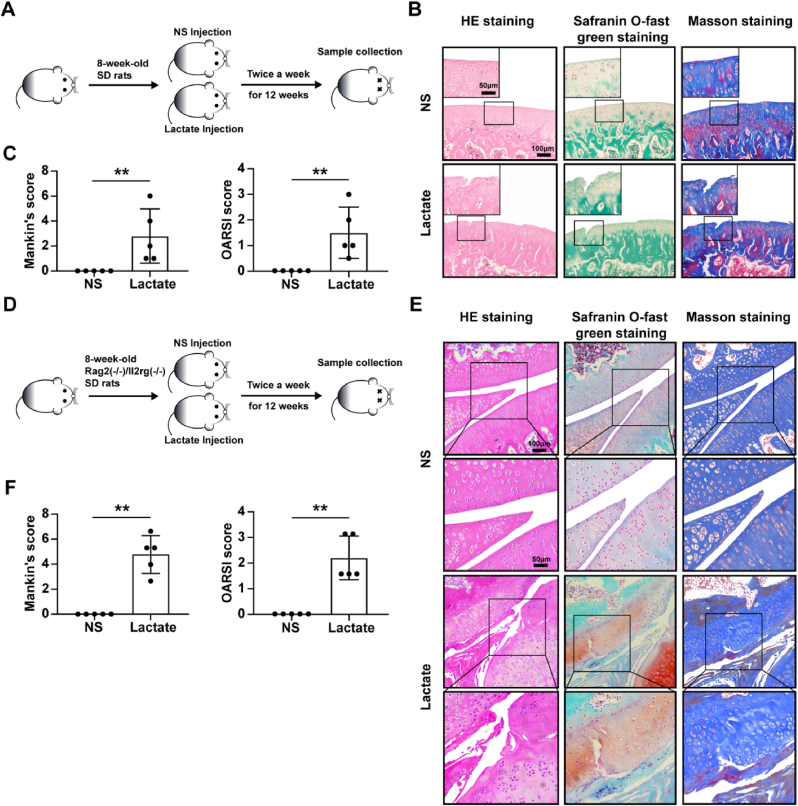
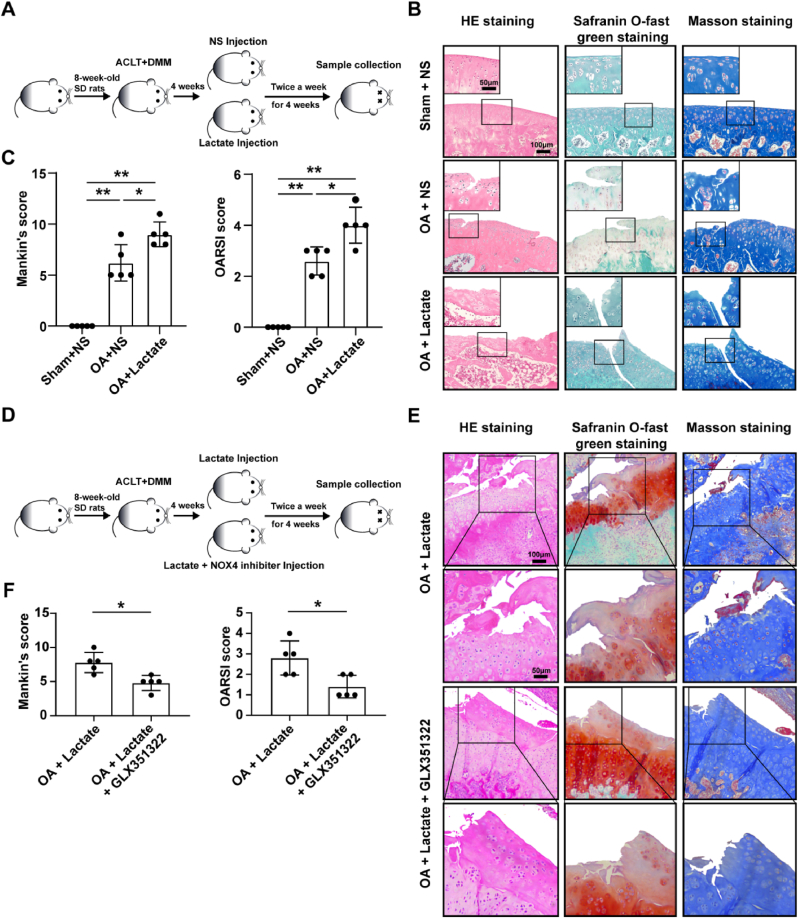
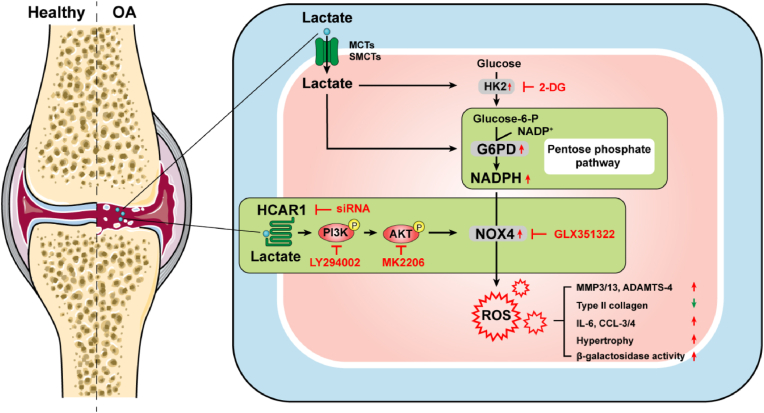
Increasing evidence shows that metabolic factors are involved in the pathological process of osteoarthritis (OA). Lactate has been shown to contribute to the onset and progression of diseases. While whether lactate is involved in the pathogenesis of OA through impaired chondrocyte function and its mechanism remains unclear. This study confirmed that serum lactate levels were elevated in OA patients compared to healthy controls and were positively correlated with synovial fluid lactate levels, which were also correlated with fasting blood glucose, high-density lipoprotein, triglyceride. Lactate treatment could up-regulate expressions of the lactate receptor hydroxy-carboxylic acid receptor 1 (HCAR1) and lactate transporters in human chondrocytes. We demonstrated the dual role of lactate, which as a metabolite increased NADPH levels by shunting glucose metabolism to the pentose phosphate pathway, and as a signaling molecule up-regulated NADPH oxidase 4 (NOX4) via activating PI3K/Akt signaling pathway through receptor HCAR1. Particularly, lactate could promote reactive oxygen species (ROS) generation and chondrocyte damage, which was attenuated by pre-treatment with the NOX4 inhibitor GLX351322. We also confirmed that lactate could increase expression of catabolic enzymes (MMP-3/13, ADAMTS-4), reduce the synthesis of type II collagen, promote expression of inflammatory cytokines (IL-6, CCL-3/4), and induce cellular hypertrophy and aging in chondrocytes. Subsequently, we showed that chondrocyte damage mediated by lactate could be reversed by pre-treatment with N-Acetyl-l-cysteine (NAC, ROS scavenger). Finally, we further verified in vivo that intra-articular injection of lactate in Sprague Dawley (SD) rat models could damage cartilage and exacerbate the progression of OA models that could be countered by the NOX4 inhibitor GLX351322. Our study highlights the involvement of lactate as a metabolic factor in the OA process, providing a theoretical basis for potential metabolic therapies of OA in the future.

Keywords: Chondrocytes; Lactate; NADPH oxidase 4; Osteoarthritis.


Conflict of interest statement

Declaration of competing interest The authors declare that they have no known competing financial interests or personal relationships that could have appeared to influence the work reported in this paper

Figures

Fig. 1
Fig. 1
Elevated lactate levels in osteoarthritis (OA) patients. The gene set GSE104793 that contains mouse chondrocytes treated (n = 3) or untreated (n = 3) with IL-1β (OA chondrocyte model) was screened through the GEO database. (A) Protein-protein interaction analysis of differentially expressed genes (DGEs) was performed by STRING (https://string-db.org), and cluster analysis was performed using Cytoscape software. (B) Volcano plots for metabolic DGEs of chondrocytes treated with IL-1β versus normal chondrocytes. Red represents up-regulation genes and blue represents down-regulation genes in chondrocytes treated with IL-1β. (C) Serum lactate levels in OA patients (n = 40) and healthy controls (n = 22). (D) Correlation analysis between serum lactate levels and synovial fluid lactate levels in OA patients (n = 25). (E) Correlation analysis between synovial fluid lactate levels and serum fasting blood glucose, triglycerides, high density lipoprotein, low density lipoprotein, and cholesterol in OA patients. Relative mRNA expression levels of (F) HCAR1, (G) MCT1, MCT2, MCT3, MCT4, SLC5A8, and SLC5A12 in chondrocytes treated with 20 mmol/L lactate for 6 h and controls were detected by quantitative real-time PCR (qRT-PCR) (n = 5 per group). The gene data was expressed as 2-△ct. (H) Immunofluorescence staining of MCT1 in chondrocytes treated with lactate for 24 h and controls (n = 5 per group). 50 μm scale bar. Quantification of MCT1 expression in chondrocytes via Image J. The data are mean ± SD, *p < 0.05, **p < 0.01. (For interpretation of the references to colour in this figure legend, the reader is referred to the Web version of this article.)
Fig. 2
Fig. 2
Lactate promotes NADPH production via shunting glucose metabolism to pentose phosphate pathway in chondrocytes. (A) Oxygen consumption rate (OCR) and (B) extracellular acidification rate (ECAR) measurements of chondrocytes treated with 20 mmol/L lactate and 10 mmol/L 2-deoxy-d-glucose (2-DG) (Basal line: no treatment, lactate injection, 2-DG injection) were measured via Seahorse assay, n = 6. Measurements were performed every 8 min, with 3 cycles for each injection. (C) Relative mRNA expression levels of LDHA in chondrocytes treated with lactate for 6 h and controls were detected by qRT-PCR, n = 5. OA chondrocytes were treated or untreated with lactate for 24 h, and then the level of intracellular (D) NADH, NADH/NAD+ ratio, and (E) Acetyl-CoA level were measured by using kits (n = 5). (F) Relative mRNA expression levels of HK2 and G6PD in chondrocytes treated with lactate for 6 h and controls were detected by qRT-PCR, n = 5. (G) The NADPH levels and the relative NADPH/NADP+ ratio in chondrocytes treated with lactate for 24 h with or without 2-DG were measured by kit (n = 5). The data are mean ± SD, *p < 0.05, **p < 0.01, ***p < 0.001, ****p < 0.0001.
Fig. 3
Fig. 3
Lactate induces NADPH-dependent NOX4 expression via binding HCAR1 to activate the PI3K/Akt signaling pathway. (A) Relative mRNA expression levels of 7 isoforms of NADPH oxidase (NOX) in chondrocytes were detected by qRT-PCR (n = 4). Gene data was expressed as 2-△ct. (B) Relative mRNA level of NADPH oxidase 4 (NOX4) in chondrocytes treated with lactate for 6 h was measured by qRT-PCR (n = 5). The data was expressed as 2−△△ct. (C) Protein levels of NOX4 in chondrocytes treated with lactate for 24 h were measured by immunofluorescence staining (n = 5). Scale bar 100 μm. Quantification of NOX4 expression in chondrocytes via Image J. (D) Western blot analysis of PI3K, p-PI3K, Akt, p-Akt, and NOX4 protein levels in chondrocytes treated with lactate in the presence or absence of PI3K inhibitor LY294002 or Akt inhibitor MK2206 (n = 3). Chondrocytes were pretreated with 25 μmol/L LY294002 or 5 μmol/L MK2206 for 2 h prior to 20 mmol/L lactate incubation for 24 h. (E) Chondrocytes were transfected with small interfering RNA targeting hydroxy-carboxylic acid receptor 1 (si-HCAR1) mediated by Lipo2000 for 48 h and then treated with 20 mmol/L lactate for 24 h. Western blot analysis of PI3K, p-PI3K, Akt, p-Akt, and NOX4 protein levels in chondrocytes treated with lactate in the presence or absence of si-HCAR1 (n = 3). (F, G) The protein gray values were measured by AlphaEaseFC, and the expression was calculated relative to the β-actin level. Data are mean ± SD, *p < 0.05, **p < 0.01, ***p < 0.001.
Fig. 4
Fig. 4
Lactate promote ROS generation and chondrocyte damage by up-regulating NOX4 expression. (A) Flow cytometry plots of intracellular reactive oxygen species (ROS) in chondrocytes incubated with lactate in a concentration gradient (0, 10, 20, 40 mmol/L) for 6 h (n = 5), (B) in chondrocytes pretreated with 10 mmol/L 2-DG for 2 h before 20 mmol/L lactate incubation for 6 h, (n = 4), and (C) in chondrocytes pretreated with 10 mmol/L GLX351322 for 1 h before 20 mmol/L lactate incubation for 6 h (n = 5). (D) Protein levels of MMP-3, MMP-13, (E) CCL-3, and CCL-4 in the culture supernatant of chondrocytes pretreated with GLX351322 for 1 h prior to lactate incubation for 24 h were measured by enzyme-linked immunosorbent assay (ELISA) (n = 5). Blank represents unstained control. Data are mean ± SD, *p < 0.05, **p < 0.01, ***p < 0.001.
Fig. 5
Fig. 5
Lactate mediates chondrocyte damage by increasing ROS production. (A) Relative mRNA expression levels of MMP-3, MMP-13, ADAMTS-4, IL-6, IL-1β, TNF-α, CCL-3, and CCL-4 in chondrocytes treated with 20 mmol/L lactate for 6 h and controls were detected by qRT-PCR (n = 5). The data was expressed as 2-△△ct. Protein levels of (B) MMP-3, MMP-13, ADAMTS-4, (C) IL-6, CCL-3, and CCL-4 in the culture supernatant of chondrocytes treated with lactate for 24 h were measured by ELISA (n = 5). (D) Immunofluorescence staining of type II collagen in chondrocytes treated with lactate for 24 h and controls (n = 5). Scale bar 100 μm. Quantification of type II collagen expression in chondrocytes via Image J. (E) Relative mRNA expression levels of COL10A1, ALP, RUNX2, VEGFA, and OPN were detected by qRT-PCR (n = 5). (F) Senescence-associated β-galactosidase (SA-β-Gal) staining of chondrocytes treated or untreated with lactate for 24 h. Scale bar 50 μm or 100 μm. The arrows represent β-Galactosidase positive cells. Quantification of β-galactosidase positive chondrocytes was calculated via Image J. (G) Flow cytometry plots of ROS in chondrocytes treated for 2 h with 5 mmol/L N-Acetyl-l-cysteine (NAC) prior to lactate incubation (n = 5). (H) SA-β-Gal staining (n = 4) and (I) immunofluorescence staining of type II collagen (n = 5) in chondrocytes pretreated with NAC for 2 h prior to lactate incubation for 24 h. Scale bar 50 μm or 100 μm. The arrows represent β-Galactosidase positive cells. Quantification of β-Galactosidase positive cells and type II collagen expression in chondrocytes were calculated via Image J. (J) Detection of MMP3, MMP13, IL-6, CCL3, CCL4 levels in the culture supernatant of chondrocytes with lactate treatment for 24 h with or without NAC treatment by ELISA (n = 5). The data are mean ± SD, *p < 0.05, **p < 0.01, ***p < 0.001.
Fig. 6
Fig. 6
A high concentration of lactate induces cartilage damage in animal models. 50 μl lactate (200 mmol/L) or normal saline (NS) was injected in (A) SD rats and (D) Rag2(−/−)/Il2rg(−/−) immunodeficient SD rats twice a week for 12 consecutive weeks. (B and E) The representative images of HE staining, safranin O-fast green staining, and masson staining for joints from rats injected with lactate or NS (n = 5, per group). Scale bar, 50 μm, 100 μm. (C and F) The Mankin’s score of cartilage was evaluated according to HE staining and the Osteoarthritis Research Society International (OARSI) score of cartilage was evaluated according to safranin O-fast green staining. Data are presented as mean ± SD, *p < 0.05, **p < 0.01. (For interpretation of the references to colour in this figure legend, the reader is referred to the Web version of this article.)
Fig. 7
Fig. 7
NOX4 inhibitor attenuates cartilage damage of OA rat model caused by lactate. (A) Lactate or NS injection was conducted twice a week for 4 weeks, and one week after anterior cruciate ligment transection (ACLT) combined with destabilization of the medial meniscus (DMM) surgery. The sham operation with the control rats was performed with a similar incision at the joint without the meniscus and ligaments section. (B) The representative images of HE staining, safranin O-fast green, and masson staining for joints from OA models injected with lactate or NS, and rats with sham and NS injection (n = 5, per group). Scale bar, 50 μm, 100 μm. (D) Lactate or lactate plus GLX351322 injection was conducted twice a week for 4 weeks, one week after OA surgery. (E) The representative images of HE staining, safranin O-fast green, and masson staining for joints from OA models injected with lactate or lactate and GLX351322 (n = 5, per group). Scale bar, 50 μm, 100 μm. (C and F) The Mankin’s score of cartilage was evaluated according to HE staining and the OARSI score of cartilage was evaluated according to safranin O-fast green staining. Data are presented as mean ± SD, *p < 0.05, **p < 0.01. (For interpretation of the references to colour in this figure legend, the reader is referred to the Web version of this article.)
Fig. 8
Fig. 8
Schematic representation of lactate-induced oxidative stress. Lactate induces the expression of MCTs and SMCTs in chondrocytes, and enters chondrocytes through them. Lactate increased NADPH levels by promoting shunting of glucose to the pentose phosphate pathway and up-regulates NOX4 expression via binding receptor HCAR1 to activate the PI3K/Akt signaling pathway, leading to elevated ROS and further induced impaired chondrocytes characterized by promoting expression of catabolic enzymes, reducing the synthesis of type II collagen, secreting inflammatory cytokines and chemokines, and causing hypertrophy and aging. OA, osteoarthritis; MCT, monocarboxylate transporter; SMCT, sodium-coupled monocarboxylate transporter; HCAR1, hydroxy-carboxylic acid receptor 1; NADP, nicotinamide adenine dinucleotide phosphate; NOX, NADPH oxidase; HK, hexokinase; Glucose-6-P, glucose-6-phosphate; G6PD, glucose-6-phosphate dehydrogenase; 2-DG, 2-deoxy-d-glucose; ROS, reactive oxygen species.

References

    1. Hunter D.J., March L., Chew M. Osteoarthritis in 2020 and beyond: a Lancet commission. Lancet. 2020;396:1711–1712. doi: 10.1016/S0140-6736(20)32230-3. - DOI - PubMed
    1. Hunter D.J., Bierma-Zeinstra S. Osteoarthritis. Lancet. 2019;393:1745–1759. doi: 10.1016/S0140-6736(19)30417-9. - DOI - PubMed
    1. Cao Y., Tang S., Ding C. Inflammatory phenotype of osteoarthritis and its potential therapies. Rheumatol. Autoimmun. 2021;1:92–100. doi: 10.1002/rai2.12018. - DOI
    1. Zheng L., Zhang Z., Sheng P., Mobasheri A. The role of metabolism in chondrocyte dysfunction and the progression of osteoarthritis. Ageing Res. Rev. 2021;66 doi: 10.1016/j.arr.2020.101249. - DOI - PubMed
    1. Mobasheri A., Rayman M.P., Gualillo O., Sellam J., van der Kraan P., Fearon U. The role of metabolism in the pathogenesis of osteoarthritis. Nat. Rev. Rheumatol. 2017;13:302–311. doi: 10.1038/nrrheum.2017.50. - DOI - PubMed

Publication types