. 2023 Nov 15;111(22):3619-3633.e8.
doi: 10.1016/j.neuron.2023.08.012. Epub 2023 Sep 8.

Irisin reduces amyloid-β by inducing the release of neprilysin from astrocytes following downregulation of ERK-STAT3 signaling

Affiliations

Irisin reduces amyloid-β by inducing the release of neprilysin from astrocytes following downregulation of ERK-STAT3 signaling

Eunhee Kim et al. Neuron. .

Abstract

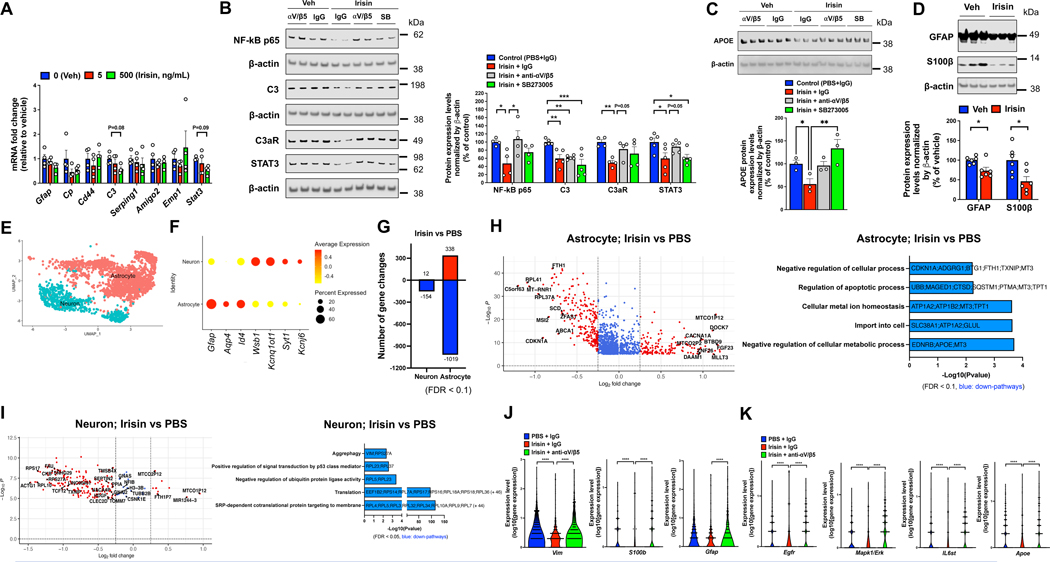
A pathological hallmark of Alzheimer's disease (AD) is the deposition of amyloid-β (Aβ) protein in the brain. Physical exercise has been shown to reduce Aβ burden in various AD mouse models, but the underlying mechanisms have not been elucidated. Irisin, an exercise-induced hormone, is the secreted form of fibronectin type-III-domain-containing 5 (FNDC5). Here, using a three-dimensional (3D) cell culture model of AD, we show that irisin significantly reduces Aβ pathology by increasing astrocytic release of the Aβ-degrading enzyme neprilysin (NEP). This is mediated by downregulation of ERK-STAT3 signaling. Finally, we show that integrin αV/β5 acts as the irisin receptor on astrocytes required for irisin-induced release of astrocytic NEP, leading to clearance of Aβ. Our findings reveal for the first time a cellular and molecular mechanism by which exercise-induced irisin attenuates Aβ pathology, suggesting a new target pathway for therapies aimed at the prevention and treatment of AD.

Keywords: Alzheimer's disease; Aβ; ERK; STAT3; amyloid-β; astrocytes; integrin αV/β5; irisin; neprilysin.


Conflict of interest statement

Declaration of interests The authors declare the following competing interests: B.M.S. and C.D.W. hold a patent related to irisin (WO2015051007A1). B.M.S. and C.D.W. are academic co-founders and consultants for Aevum Therapeutics. C.D.W. has a financial interest in Aevum Therapeutics, a company developing drugs that harness the protective molecular mechanisms of exercise to treat neurodegenerative and neuromuscular disorders. C.D.W.’s interests were reviewed and are managed by MGH and Mass General Brigham in accordance with their conflict-of-interest policies.

Figures

Figure 1.
Figure 1.. Irisin reduces Aβ, dystrophic neurites, and hyperexcitability.
(A) Diagrams of lentiviral internal ribosome entry sites (IRES) constructs. CMV, cytomegalovirus. (B) Schematic of irisin treatment schedule. (C) Aβ levels in the media and in the 3D gels of 5-week 3D-AD cultures treated with irisin or PBS (0, vehicle, veh). (D) Representative image of dystrophic neurites (arrows) in 5-week ReN-mGAP cultures. Scale bar: 50 μm. (E) Quantification of dystrophic neurite area and dystrophic neurite number, normalized by total neurite area, in the 5-week 3D-AD cultures treated with irisin or PBS. (F) Representative images from captured video of 5-week ReN-GA (10X objective; scale bar: 100 μm) and ReN-mGAP cultures (20X objective; scale bar: 50 μm) incubated with Cal-520 AM fluorescent dyes and the corresponding activity maps. Spontaneous Ca2+ transients (ΔF/F0) recorded in cells A and B. mins: minutes. (G) Frequency distribution of Ca2+ transients of active cells (>0 transient per 4.5 minutes) in 3D-AD cultures treated with irisin or PBS. (H) Fraction of hyperactive cells out of total GFP+ cells (sum of two videos per well) and average frequency of active cells (average of two videos per well) in 3D-AD cultures treated with irisin or PBS. For (C), (E), and (H), *p < 0.05, **p < 0.01, ***p < 0.001, and ****p < 0.0001 between vehicle- and irisin-treated groups, one-way ANOVA with Dunnett’s test; #p < 0.05 and p < 0.01 between ReN-GA (veh) vs ReN-mGAP (veh) groups, unpaired t-test. Data are represented as mean ± SEM. See also Figure S1.
Figure 2
Figure 2. Irisin increases secNEP levels from astrocytes.
(A-B) secNEP activity levels (A) and western blots of secNEP and secIDE (B) in the media of 5-week 3D-AD cultures treated with irisin or PBS. Graphs represent densitometric quantifications. (C) Nep mRNA levels, normalized by Gapdh, in 5-week ReN-GA cultures treated with irisin or PBS. (D) Aβ levels in the 3D gels of 5-week 3D-AD cultures co-treated with irisin (500 ng/ml or PBS) and sacubitril (40 μM or DMSO). (E) secNEP activity levels in the media of hiPSC-Astro cultures treated with irisin or PBS. For (A-E), *p < 0.05, **p < 0.01, ***p < 0.001, ****p < 0.0001, ns=not significant, one-way ANOVA with Dunnett’s test (A-C, E) and Fisher’s LSD test (D). Data are represented as mean ± SEM. See also Figure S2.
Figure 3.
Figure 3.. Integrin αV/β5 receptor in astrocytes mediates irisin effects on reducing Aβ.
(A) Identified integrin subtypes expressed in 5-week ReN-mGAP cultures by mass spectrometry. Integrin αV and β5 highlighted in yellow. Paired t-test. Western blots of integrin αV and β5 in the 3D gels of 5-week ReN-GA cultures. (B) Western blots of integrin β5 and S100β in the 3D gels of 5-week ReN-mGAP cultures treated with irisin and/or L-AAA. (C-D) Western blots of p-FAK, total FAK, p-CREB, and total CREB in the 3D gels of ReN-mGAP cultures and in protein lysates of hiPSC-Astro cultures (D), treated with irisin (500 ng/ml) at indicated time points. min: minutes. Graphs represent densitometric quantifications. (E) Aβ42 levels in the 3D gels of 5-week ReN-mGAP cultures co-treated with irisin (500 ng/ml) and either an integrin αV/β5 antibody (0.9 μg/ml) or αV/β5 inhibitor (SB273005, 10 μM). Co-treatment of PBS and IgG (0.9 μg/ml) used as control. (F) secNEP activity in the media of ReN-mGAP cultures co-treated with irisin (or PBS) and SB273005 (or DMSO). (G) Representative confocal images and western blots of integrin β5 from 5-week ITGB5 KD-ReN-GA cultures treated with doxycycline (Dox, 2 μM). Green, GFP-APPSwe/Lon; Red, RFP-tagged inducible lentiviral ITGB5 shRNA. Scale bar, 100 μm. (H) Aβ levels in the media and 3D gels of 5-week ITGB5 KD-ReN-GA cultures treated with irisin (500 ng/ml). For (D-F) and (H), *p < 0.05, **p < 0.01, ***p < 0.001, ns=not significant, one-way ANOVA with Dunnett’s test (D) and Fisher’s LSD test (E-F), and Unpaired t-test (H). Data are represented as mean ± SEM. See also Figure S3A–C.
Figure 4.
Figure 4.. Irisin inhibits STAT3 signaling and attenuates reactive astrocyte gene and protein expression via integrin αV/β5.
(A) mRNA levels of astrocyte reactivity genes (normalized by Gapdh) in 5-week ReN-GA cultures treated with irisin or PBS. (B-C) Western blots of NF-kB p65, C3, C3aR, and STAT3 in the 3D gels of 5-week ReN-GA cultures (B) and APOE in ReN-mGAP cultures (C), co-treated with irisin and either an integrin αV/β5 antibody (0.9 μg/ml) or integrin inhibitor SB273005 (SB, 10 μM). Co-treatment of PBS and IgG (0.9 μg/ml) used as control. Graphs represent densitometric quantification. (D) Western blots of GFAP and S100β in the 3D gels of 5-week ReN-mGAP cultures treated with irisin (500 ng/ml) and densitometric quantification. (E) Transcriptional profile of neuron and astrocyte clusters in 5-week ReN-mGAP cultures. (F) Identification of cell types based on the gene expression of cell-specific markers. (G) Number of gene changes in neurons and astrocytes from 5-week ReN-mGAP cultures treated with irisin (500 ng/ml). Red, upregulated genes; blue, downregulated genes. (H-I) Volcano plots for differential gene expression (DEG) and gene ontology analysis. Additional 44 and 46 genes are not shown (I). (J-K) Violin plots of gene expression levels of Vim, S100b, and Gfap (J) as well as Egfr, Mapk1/Erk, IL6st, and Apoe (K) in astrocytes from 5-week ReN-mGAP cultures co-treated with irisin and integrin αV/β5 antibody (0.9 μg/ml). Co-treatment of PBS and IgG (0.9 μg/ml) used as control. For (A-D), (J), and (K), *p < 0.05, **p < 0.01, ***p < 0.001, ****p < 0.0001, one-way ANOVA with Dunnett’s test (A) and Fisher’s LSD test (B-C), unpaired t-test (D), and Wilcoxon rank sum test (J-K). Data are represented as mean ± SEM. See also Figures S3D–K and S4.
Figure 5.
Figure 5.. Blocking STAT3 signaling increases secNEP levels.
(A) Representative images and western blots of STAT3 from 5-week STAT3 KD-ReN-GA cultures treated with Dox (2 μM). Green, GFP-APPSwe/Lon; Red, RFP-tagged inducible lentiviral STAT3 shRNA. Scale bar: 100 μm. (B-C) secNEP activity (B) and western blots of secNEP and secIDE (C) in the media of 5-week STAT3 KD-ReN-GA cultures with or without Dox (2 μM) treatment. Graphs represent densitometric quantification. Unpaired t-test. (D) Aβ levels in the media and 3D gels of 5-week STAT3 KD-ReN-GA cultures treated with irisin (500 ng/ml or PBS). One-way ANOVA with Fisher’s LSD test. For (B-D), *p < 0.05, **p < 0.01, ***p < 0.001, ****p < 0.0001, ns=not significant. Data are represented as mean ± SEM.
Figure 6.
Figure 6.. Irisin inhibits IL-6/ERK signaling to reduce STAT3 signaling for increasing secNEP levels.
(A) IL-6 levels in the media of 5-week 3D-AD cultures treated with irisin or PBS. N.D.=not detected. (B) Western blots of p-ERK and total ERK in the 3D gels of 5-week ReN-mGAP cultures treated with irisin (500 ng/ml) at indicated time points. Graphs represent densitometric quantification. hrs: hours. (C-D) Western blots of p-ERK, total ERK, p-STAT3, and total STAT3 in the 3D gels (C) as well as secNEP and secIDE in the media and NEP in the 3D gels (D) in 5-week ReN-GA cultures treated with U0126 (25 μM) or DMSO (veh). Graphs represent densitometric quantification. (E) Aβ levels in the media and 3D gels of 5-week ReN-GA cultures co-treated with sacubitril (40 μM) and U0126 (25 μM). For (A-E), *p < 0.05, **p < 0.01, ***p < 0.001, ****p < 0.0001, ns=not significant, one-way ANOVA with Dunnett’s test (A-B) and Fisher’s LSD test (E), and unpaired t-test (C-D). Data are represented as mean ± SEM. See also Figure S5.
Figure 7.
Figure 7.. Schematic diagram of the mechanism of action of irisin.
Depiction of IL-6/ERK pathway leading to STAT3 activation. Irisin inhibits IL-6/ERK-STAT3 pathway, promoting secNEP-mediated Aβ clearance via integrin αV/β5 receptor. SRE, STAT response element; RGD, Arg-Gly-Asp; ECM, extracellular matrix proteins.

Similar articles

Cited by

References

    1. Tanzi RE, and Bertram L. (2005). Twenty years of the Alzheimer’s disease amyloid hypothesis: a genetic perspective. Cell 120, 545–555. 10.1016/j.cell.2005.02.008. - DOI - PubMed
    1. Lazarov O, Robinson J, Tang YP, Hairston IS, Korade-Mirnics Z, Lee VM, Hersh LB, Sapolsky RM, Mirnics K, and Sisodia SS (2005). Environmental enrichment reduces Abeta levels and amyloid deposition in transgenic mice. Cell 120, 701–713. 10.1016/j.cell.2005.01.015. - DOI - PubMed
    1. Adlard PA, Perreau VM, Pop V, and Cotman CW (2005). Voluntary exercise decreases amyloid load in a transgenic model of Alzheimer’s disease. J Neurosci 25, 4217–4221. 10.1523/JNEUROSCI.0496-05.2005. - DOI - PMC - PubMed
    1. Li Z, Chen Q, Liu J, and Du Y. (2020). Physical Exercise Ameliorates the Cognitive Function and Attenuates the Neuroinflammation of Alzheimer’s Disease via miR-129–5p. Dement Geriatr Cogn Disord, 1–7. 10.1159/000507285. - DOI - PubMed
    1. Nichol KE, Poon WW, Parachikova AI, Cribbs DH, Glabe CG, and Cotman CW (2008). Exercise alters the immune profile in Tg2576 Alzheimer mice toward a response coincident with improved cognitive performance and decreased amyloid. J Neuroinflammation 5, 13. 10.1186/1742-2094-5-13. - DOI - PMC - PubMed

Publication types