. 2023 Sep 21;30(9):1156-1168.e7.
doi: 10.1016/j.chembiol.2023.08.007. Epub 2023 Sep 8.

Screening in serum-derived medium reveals differential response to compounds targeting metabolism

Affiliations

Screening in serum-derived medium reveals differential response to compounds targeting metabolism

Keene L Abbott et al. Cell Chem Biol. .

Abstract

A challenge for screening new anticancer drugs is that efficacy in cell culture models is not always predictive of efficacy in patients. One limitation of standard cell culture is a reliance on non-physiological nutrient levels, which can influence cell metabolism and drug sensitivity. A general assessment of how physiological nutrients affect cancer cell response to small molecule therapies is lacking. To address this, we developed a serum-derived culture medium that supports the proliferation of diverse cancer cell lines and is amenable to high-throughput screening. We screened several small molecule libraries and found that compounds targeting metabolic enzymes were differentially effective in standard compared to serum-derived medium. We exploited the differences in nutrient levels between each medium to understand why medium conditions affected the response of cells to some compounds, illustrating how this approach can be used to screen potential therapeutics and understand how their efficacy is modified by available nutrients.

Keywords: Cancer cell metabolism; Culture media; Drug sensitivity; High-throughput screening; Nutrient environment; Phenotypic drug screening; Physiologic media.


Conflict of interest statement

Declaration of interests M.G.V.H. discloses that he is a scientific advisor for Agios Pharmaceuticals, iTeos Therapeutics, Sage Therapeutics, Pretzel Therapeutics, Lime Therapeutics, Faeth Therapeutics, Droia Ventures, and Auron Therapeutics. D.C., S.R., A.F., L.M.G., and D.S.A. are (or were at the time of their involvement with this study) employees of Novartis. P.P.H. has consulted for Auron Therapeutics. I.M.T.G. is a current employee of AstraZeneca. All remaining authors declare no competing interests.

Figures

Figure 1.
Figure 1.. Characterization of a serum-derived culture medium optimized for high-throughput screening
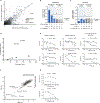
(A) Heatmap depicting relative concentrations of the indicated components present in RPMI, measured in basal flow-through adult bovine serum (ftABSB), measured in human plasma, or reported in the Human Metabolome Database (HMDB). Data presented within each column were z-score normalized. ND: not determined or not detected in the samples, or values not reported on HMDB. Absent: not present in RPMI. See Table S1 for heatmap values and metabolite concentrations. (B) Log2 fold change in relative cell number for 482 barcoded cancer cell lines grouped by tissue of origin when cultured in ftABS compared to RPMI for 5 days. The median (box center line), interquartile range (IQR) (box) and 1.5xIQR (whiskers) are plotted; the dashed line represents the population median. See Table S2 for PRISM barcode counts. (C) Proliferation rate of A549 cells in cultured in RPMI or ftABS and treated with or without CB-839 for 72 hr. Data shown are mean ± SD from three technical replicates. Statistical test was performed using multiple unpaired t test (ns, not significant; ****p < 0.0001).
Figure 2.
Figure 2.. Compounds targeting metabolic enzymes show differential efficacy in standard versus serum-derived medium
(A) Plot of activity area under the curve (AUC) for A549 cells cultured in RPMI or ftABS and treated with the Novartis Institute of BioMedical Research Mechanism of Action Box (MoA Box) compound library. Cells were treated for 72 hr with 8 doses of each drug up to a maximum dose of 10.7 μM, and dose response used to calculate AUC. Drugs in red are NAMPT inhibitors, drugs in magenta are DHODH inhibitors, and drugs in blue are inhibitors of other metabolic enzymes. See Table S4 for screen data. (B-C) Analysis of whether compounds targeting metabolic enzymes (B) or signaling proteins (C) were differentially active in the two media used in the screen shown in Figure 2A. Each compound included in the MoA Box compound library was classified based on whether or not it targeted a metabolic enzyme or signaling protein and then binned according to z-score based on the difference in AUC between ftABS and RPMI. Statistical tests were performed using Fisher’s exact test (ns, not significant; **p < 0.01). (D) Drug enrichment analysis of compounds from the MoA Box screen shown in Figure 2A. The enrichment factor is a score that represents the fraction of compounds targeting each gene that are differentially active between RPMI or ftABS. The intensity of each point reflects the number of genes with the same score (white, 1 gene; grey, 2–4 genes; black, 5 or more genes). p-values were calculated via hypergeometric test and adjusted for multiple hypothesis correction. See Table S4 for enrichment factor and p values. (E) Dose-response curves of A549 cells treated with the indicated compounds targeting NAMPT, DHODH, or other enzymes involved in nucleotide synthesis from the screen shown in Figure 2A. Data shown are mean ± SD from two technical replicates. (F) Plot of AUC for A549 cells cultured in RPMI or ftABS and treated with the SCREEN-WELL® FDA v. 2.0 Approved Drug Library. Cells were treated for 72 hr with 5 doses of each drug up to a maximum dose of 10 μM, and dose response used to calculate AUC. Drugs in purple are nucleotide synthesis inhibitors. See Table S4 for screen data. (G) Dose-response curves of A549 cells treated with the indicated compounds targeting nucleotide synthesis from the screen shown in 2F. Data shown are mean ± SD from two technical replicates.
Figure 3.
Figure 3.. Hits for drugs with differential efficacy in standard versus serum-derived medium are enriched when a metabolism-oriented library is screened
(A) Breakdown of the Ludwig Metabolic Library 2 based on the molecular pathway associated with the annotated target of the compounds included in the library. (B) Plot of area under the curve (AUC) for A549 cells cultured in RPMI or ftABS and treated with the Ludwig Metabolic Library 2. Cells were treated for 72 hr with 10 doses of each drug up to a maximum dose of 20 μM, and dose response used to calculate AUC. Drugs in red target NAD+ metabolism proteins, drugs in purple target nucleotide metabolism proteins, drugs in yellow target glutamine metabolism, and drugs in blue target other redox metabolism proteins. See Table S4 for screen data. (C-F) EC50 values for the indicated compounds targeting nucleotide metabolism (C), NAD+ metabolism (D), glutamine metabolism (E), or other redox metabolism proteins (F) as determined from the screen shown in 3B. Data shown are mean ± SD from two technical replicates (†: not determined qABSEC50 > 20 μM; ‡: not determined qABSEC50 < 1 nM). Statistical test was performed using multiple unpaired t test with Benjamini and Hochberg FDR correction (ns, not significant; **q < 0.01; *q < 0.05).
Figure 4.
Figure 4.. Physiologic metabolite levels can drive resistance to NAMPT and DHODH inhibitors
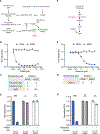
(A) Schematic illustrating the synthesis of nicotinamide adenine dinucleotide (NAD+) through the de novo Preiss-Handler or salvage pathways. NAMPT: nicotinamide phosphoribosyl transferase. FK866 is an inhibitor of NAMPT. (B) Effect of the NAMPT inhibitor FK866 on the number of A549 cells cultured in RPMI or ftABS for 72 hr as determined by CellTiter-Glo. Data shown are normalized to the vehicle-treated control and are the mean ± SD from two technical replicates. Data are from the screen in Figure 3B. (C) Concentrations of nicotinamide, nicotinic acid (NA) and nicotinamide mononucleotide (NMN) present in RPMI or ftABS. ND: measured but not detected. (D) Relative viability of A549 cells treated with vehicle or FK866 in ftABS or in RPMI, with or without addition of 1 μM NA for 72 hr as determined by CellTiter-Glo. Data are normalized to the vehicle-treated control and are the mean ± SD from three technical replicates. Statistical test was performed using multiple unpaired t test (ns, not significant; ****p < 0.0001; *p < 0.05). (E) Schematic illustrating the de novo synthesis and salvage pathways to generate the pyrimidine nucleotide uridine monophosphate (UMP). DHODH: dihydroorotate dehydrogenase. Brequinar is an inhibitor of DHODH. (F) Effect of the DHODH inhibitor brequinar on the number of A549 cells cultured in RPMI or ftABS for 72 hr as determined by CellTiter-Glo. Data shown are normalized to the vehicle-treated control and are the mean ± SD from two technical replicates. Data are from the screen in Figure 3B. (G) Concentration of uridine present in RPMI or ftABS. (H) Relative viability of A549 cells treated with vehicle or brequinar in ftABS or in RPMI, with or without addition of 6 μM uridine for 72 hr as determined by CellTiter-Glo. Data are normalized to vehicle-treated control and are the mean ± SD from three technical replicates. Statistical test was performed using multiple unpaired t test (ns, not significant; ****p < 0.0001; **p < 0.01).
Figure 5.
Figure 5.. Supraphysiological metabolite levels in standard culture medium alters sensitivity to some compounds
(A) Schematic illustrating the synthesis pathways for glutathione (GSH) and for detoxification of lipid peroxides by glutathione peroxidase 4 (GPX4). xCT: cystine/glutamate antiporter, GLS: glutaminase, GSSG: glutathione disulfide, PUFA-OOH: peroxidated polyunsaturated fatty acid, PUFA-OH: polyunsaturated fatty acid. Erastin is an inhibitor of xCT. CB-839 is an inhibitor of GLS. RSL3/ML210 are inhibitors of GPX4. (B) Effect of CB-839 or RSL3 on the number of A549 cells cultured in RPMI or ftABS for 72 hr as determined by CellTiter-Glo. Data shown are normalized to vehicle-treated control and are the mean ± SD from two technical replicates. Data are from the screen in Figure 3B. (C) Concentration of cystine in RPMI and ftABS. (D) Relative viability of A549 cells treated with vehicle, CB-839, or RSL3 in RPMI or in ftABS, with or without addition of 208 μM cystine (RPMI levels) for 72 hr as determined by CellTiter-Glo. Data are normalized to vehicle-treated control and are the mean ± SD from three technical replicates. Statistical tests were performed using multiple unpaired t test (ns, not significant; ****p < 0.0001; **p < 0.01). (E) Chemical structures of glutamine and the glutamine analogs azaserine and acivicin. (F) Effect of azaserine or acivicin on the number of A549 cells cultured in RPMI or ftABS for 72 hr as determined by CellTiter-Glo. Data shown are normalized to vehicle-treated control and are the mean ± SD from two technical replicates. Data are from the screen in Figure 3B. (G) Concentration of glutamine in RPMI and ftABS. (H) Relative viability of A549 cells treated with vehicle, azaserine, or acivicin in RPMI or in ftABS, with or without addition of 2 mM glutamine (RPMI levels) for 72 hr as determined by CellTiter-Glo. Data are normalized to vehicle-treated control and are the mean ± SD from three technical replicates. Statistical tests were performed using multiple unpaired t test (ns, not significant; ****p < 0.0001; **p < 0.01; *p < 0.05).

Update of

References

    1. Palm W, Park Y, Wright K, Pavlova NN, Tuveson DA, and Thompson CB (2015). The Utilization of Extracellular Proteins as Nutrients Is Suppressed by mTORC1. Cell 162, 259–270. 10.1016/j.cell.2015.06.017. - DOI - PMC - PubMed
    1. Davidson SM, Papagiannakopoulos T, Olenchock BA, Heyman JE, Keibler MA, Luengo A, Bauer MR, Jha AK, O’Brien JP, Pierce KA, et al. (2016). Environment Impacts the Metabolic Dependencies of Ras-Driven Non-Small Cell Lung Cancer. Cell Metab. 23, 517–528. 10.1016/j.cmet.2016.01.007. - DOI - PMC - PubMed
    1. Gui DY, Sullivan LB, Luengo A, Hosios AM, Bush LN, Gitego N, Davidson SM, Freinkman E, Thomas CJ, and Vander Heiden MG (2016). Environment Dictates Dependence on Mitochondrial Complex I for NAD+ and Aspartate Production and Determines Cancer Cell Sensitivity to Metformin. Cell Metab. 24, 716–727. 10.1016/j.cmet.2016.09.006. - DOI - PMC - PubMed
    1. Muir A, Danai LV, Gui DY, Waingarten CY, Lewis CA, and Vander Heiden MG (2017). Environmental cystine drives glutamine anaplerosis and sensitizes cancer cells to glutaminase inhibition. eLife 6. 10.7554/eLife.27713. - DOI - PMC - PubMed
    1. Cantor JR, Abu-Remaileh M, Kanarek N, Freinkman E, Gao X, Louissaint A, Lewis CA, and Sabatini DM (2017). Physiologic Medium Rewires Cellular Metabolism and Reveals Uric Acid as an Endogenous Inhibitor of UMP Synthase. Cell 169, 258–272.e17. 10.1016/j.cell.2017.03.023. - DOI - PMC - PubMed

Publication types

Substances

LinkOut - more resources