. 2023 Oct 1:186:106286.
doi: 10.1016/j.nbd.2023.106286. Epub 2023 Sep 7.

Unbiased classification of the elderly human brain proteome resolves distinct clinical and pathophysiological subtypes of cognitive impairment

Affiliations

Unbiased classification of the elderly human brain proteome resolves distinct clinical and pathophysiological subtypes of cognitive impairment

Lenora Higginbotham et al. Neurobiol Dis. .

Abstract

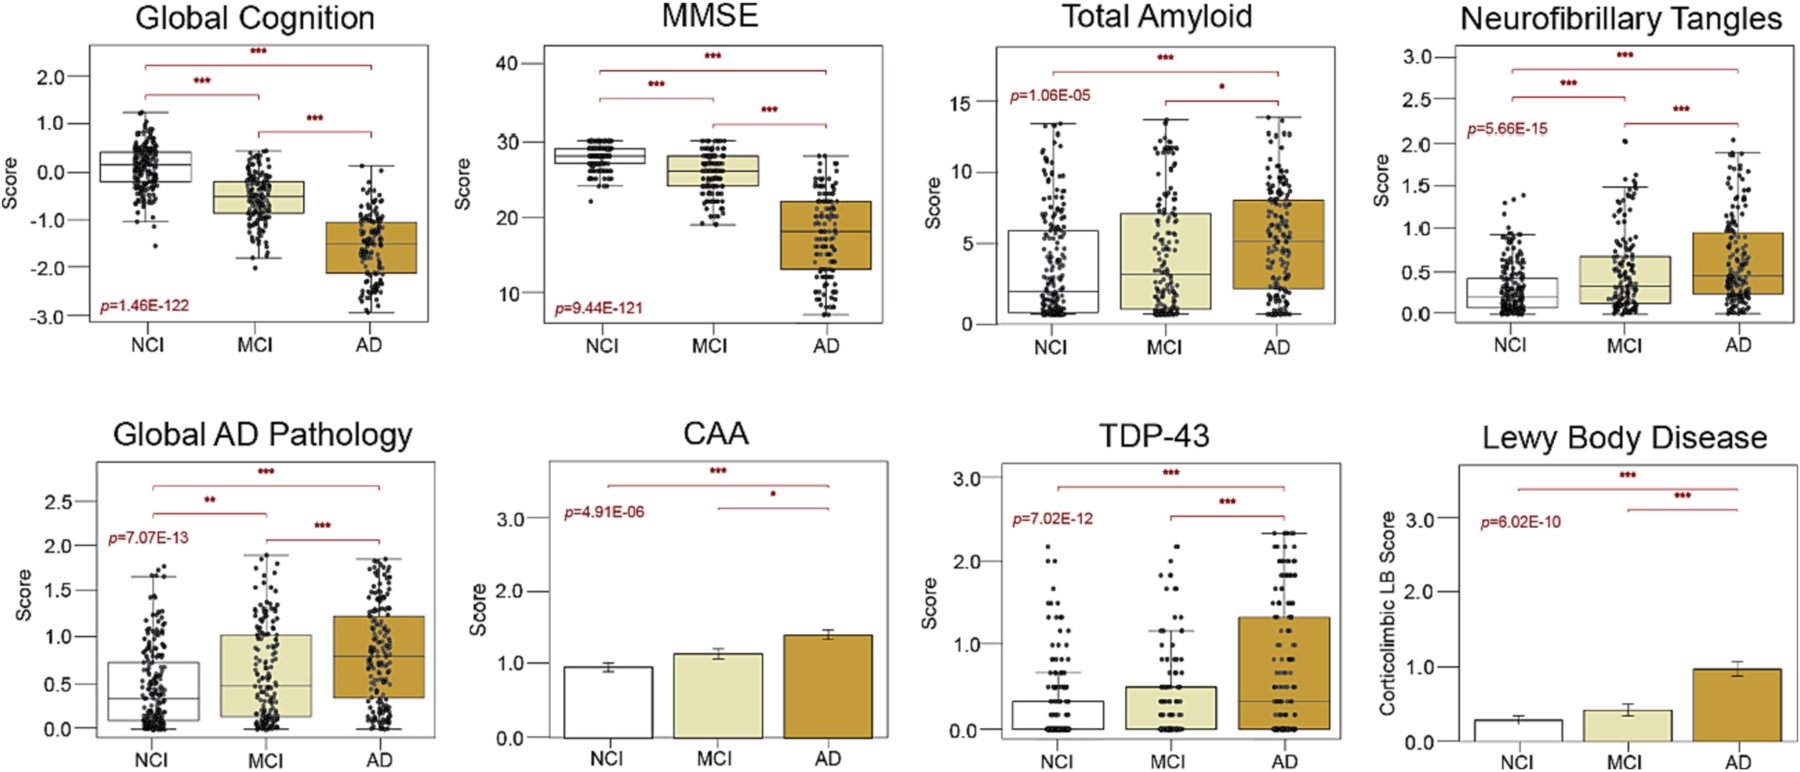
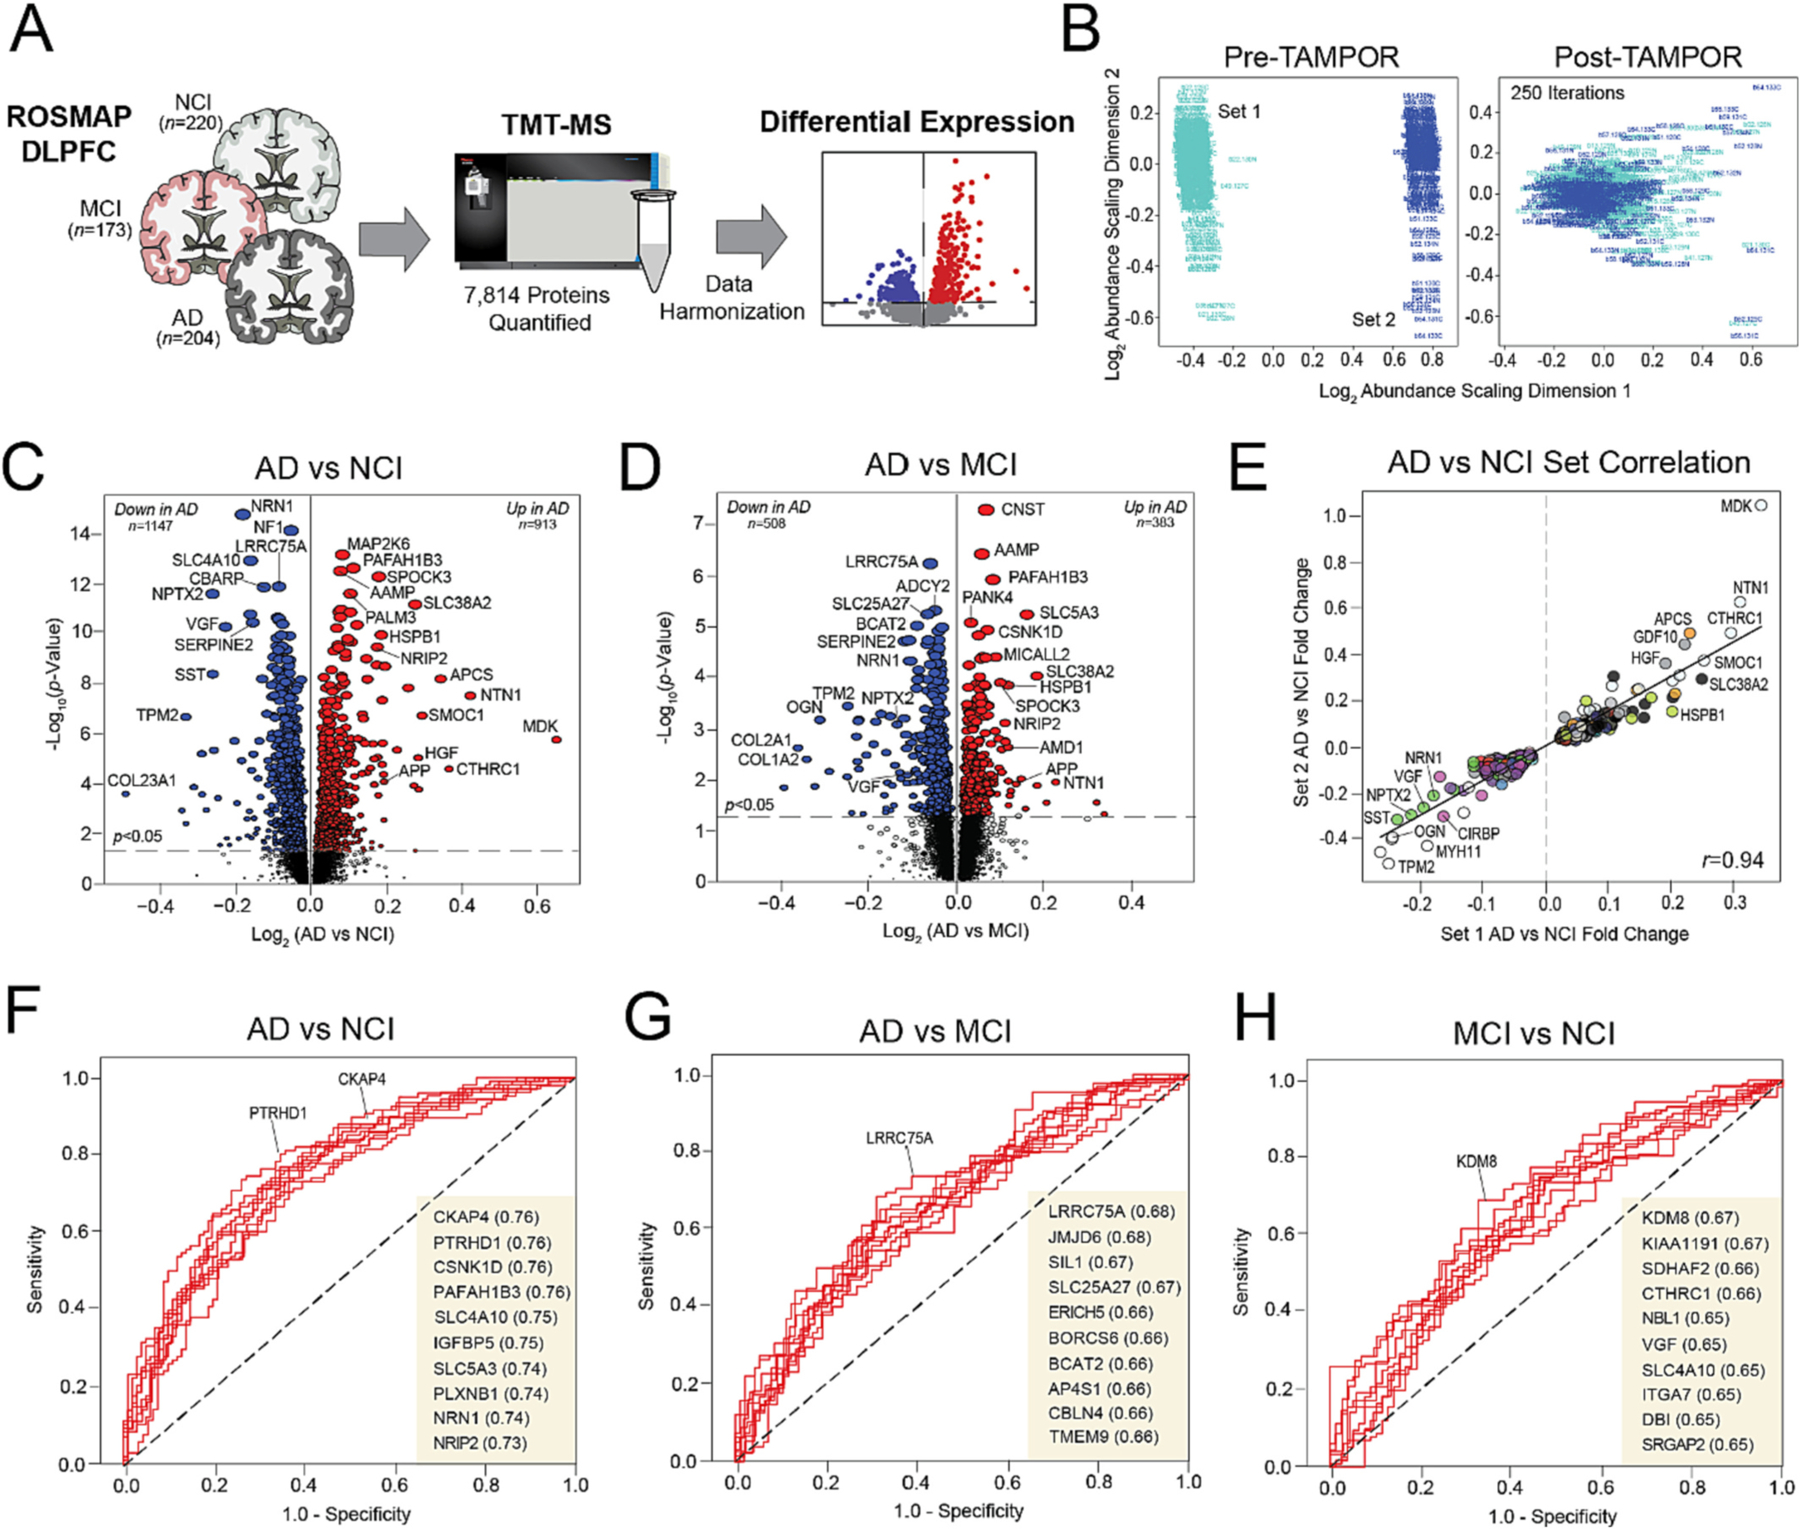
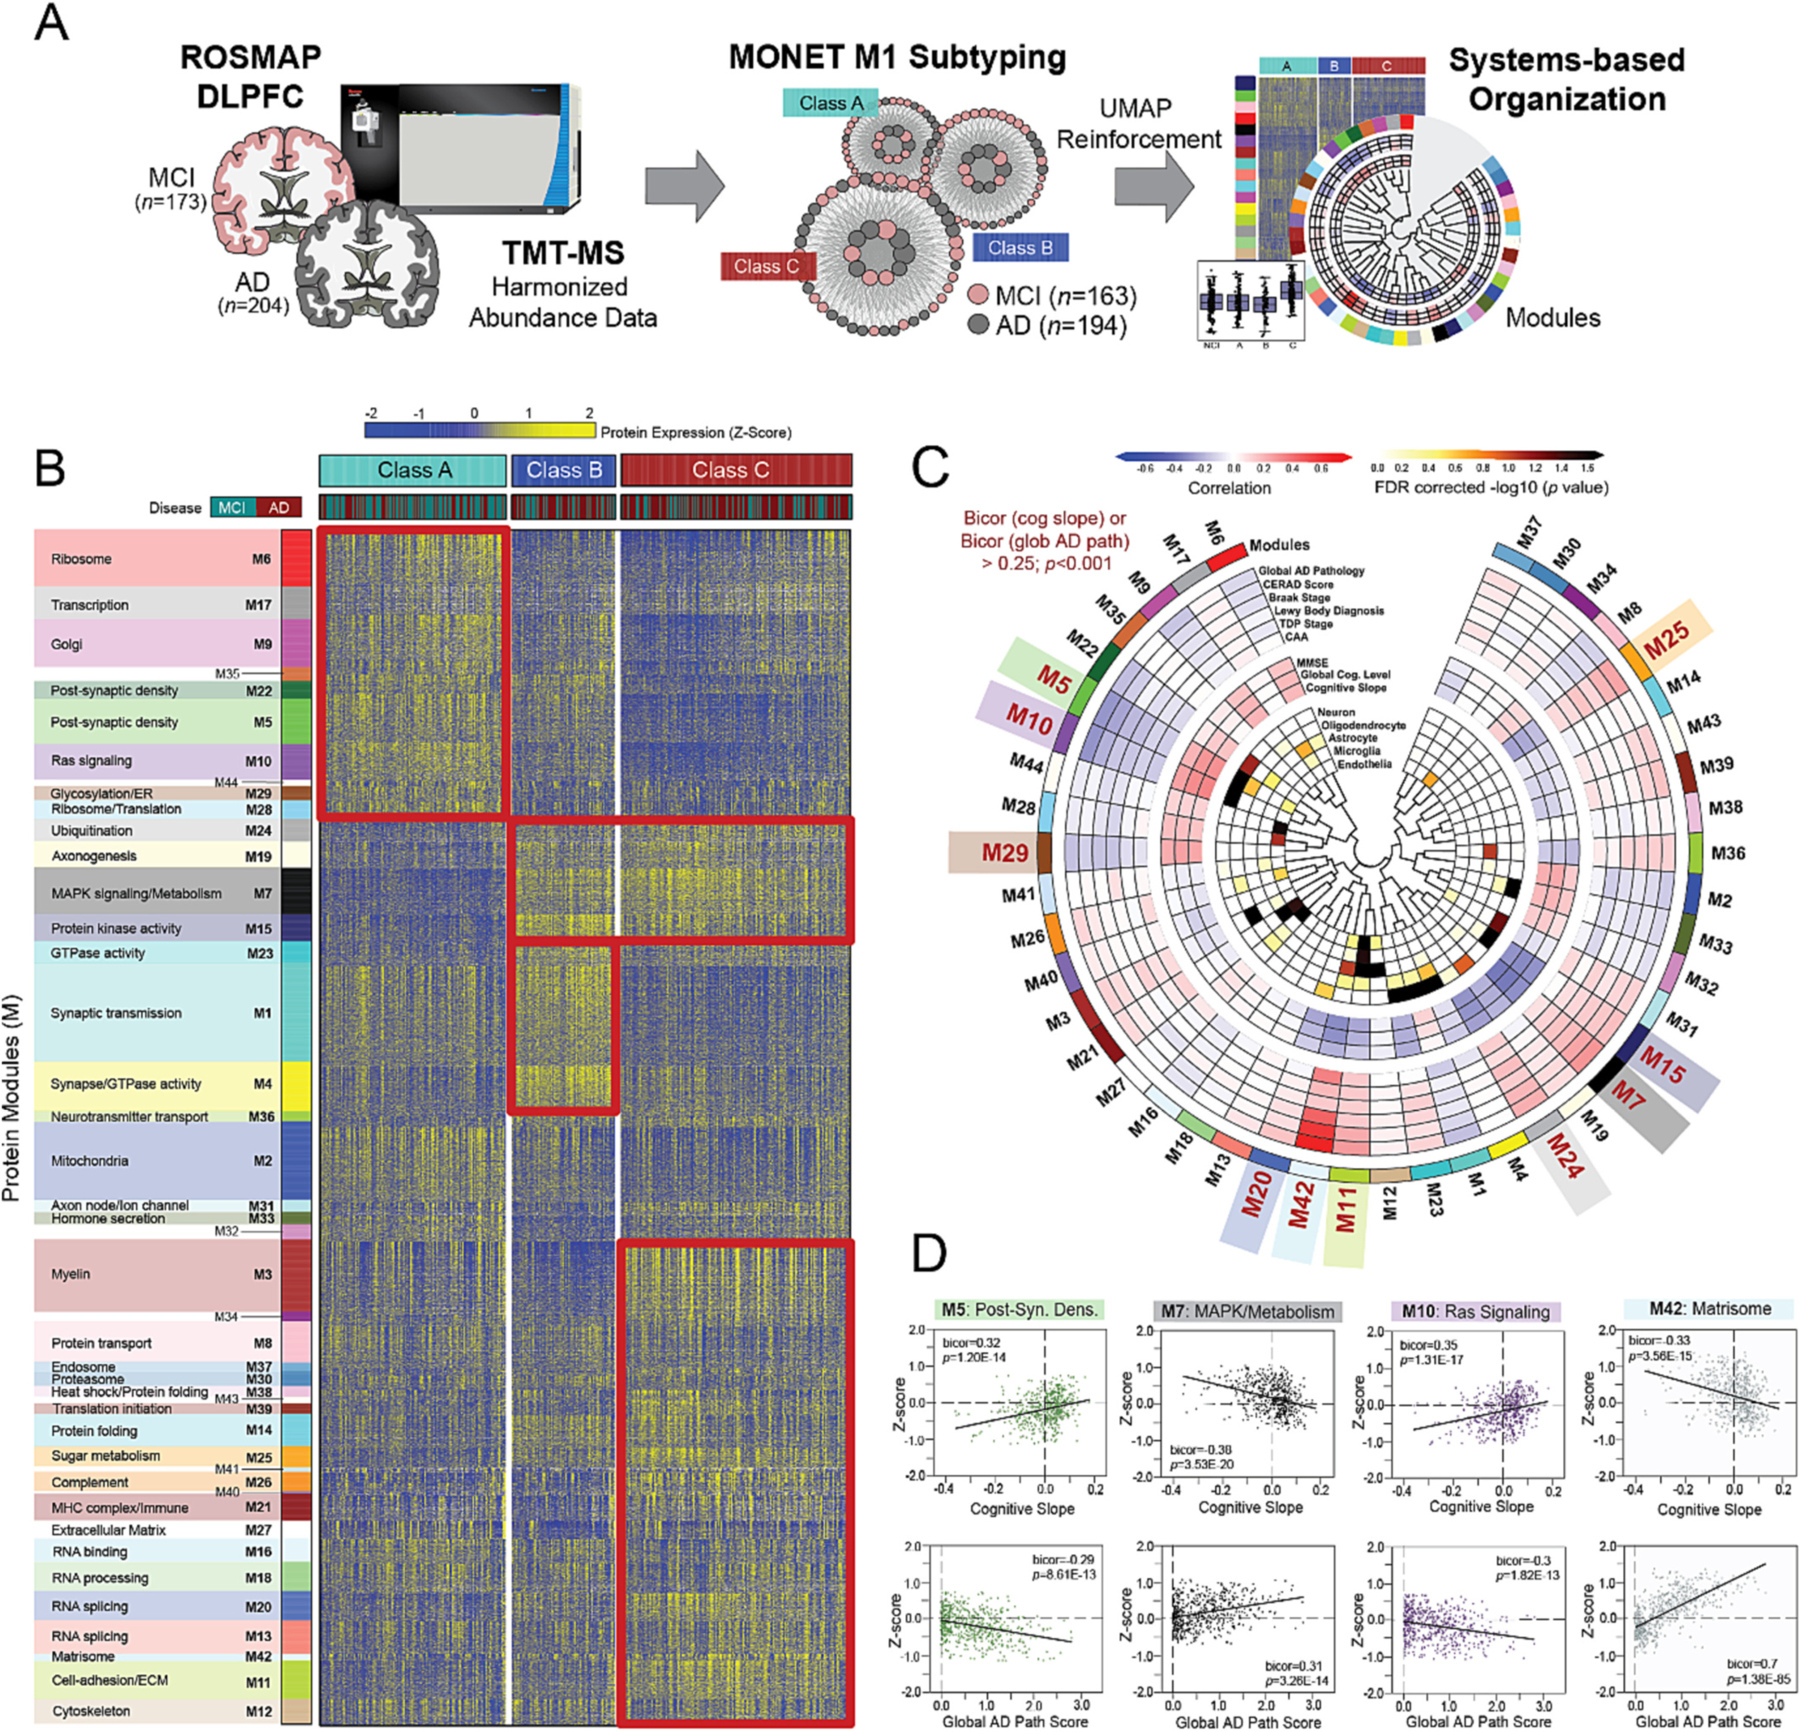
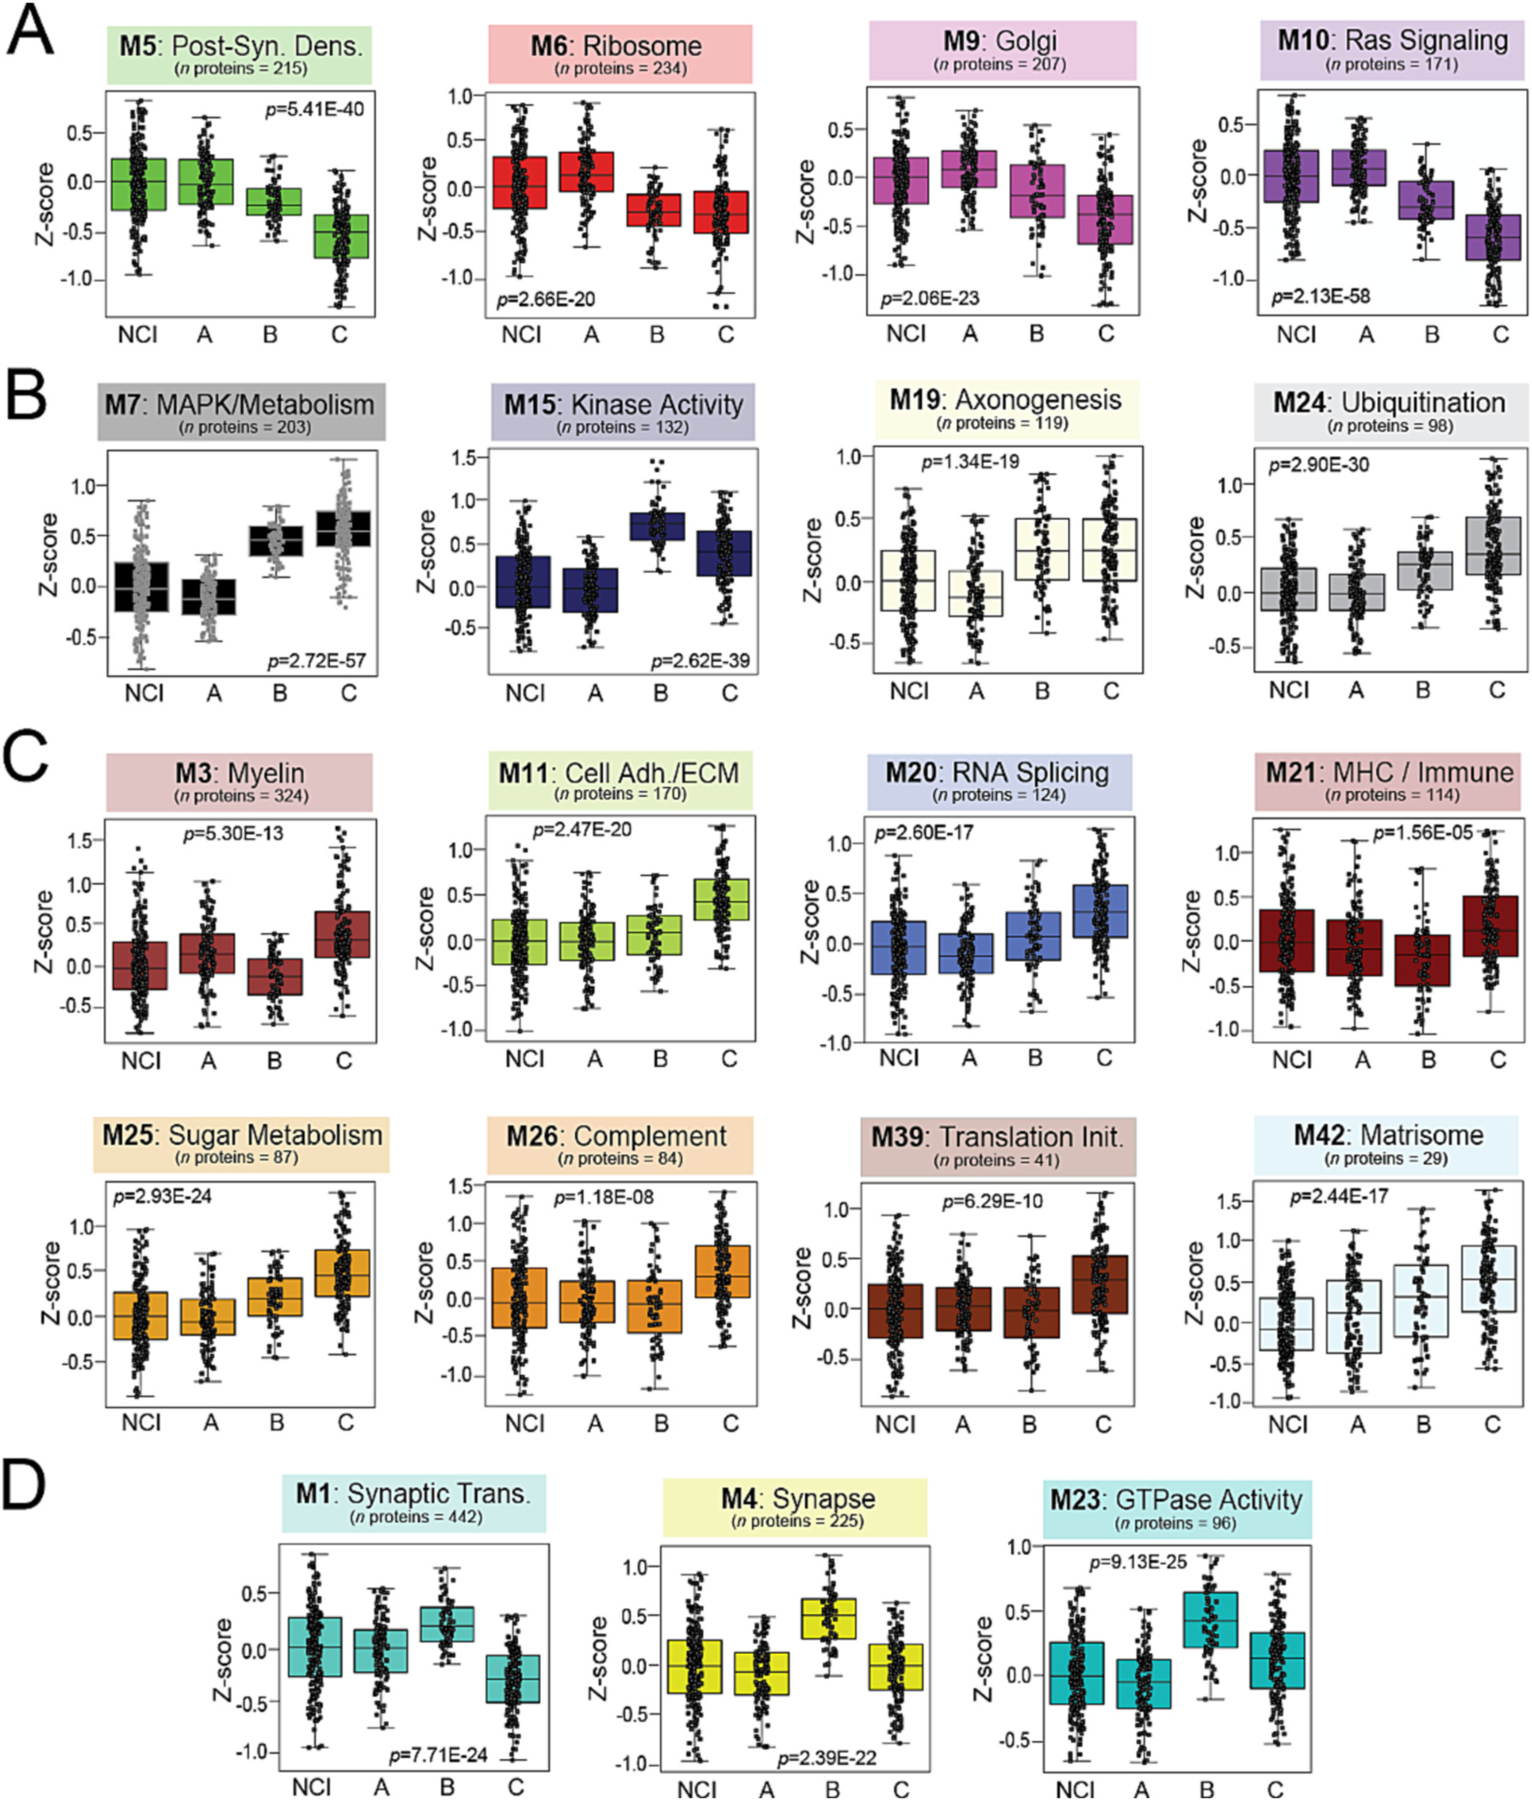
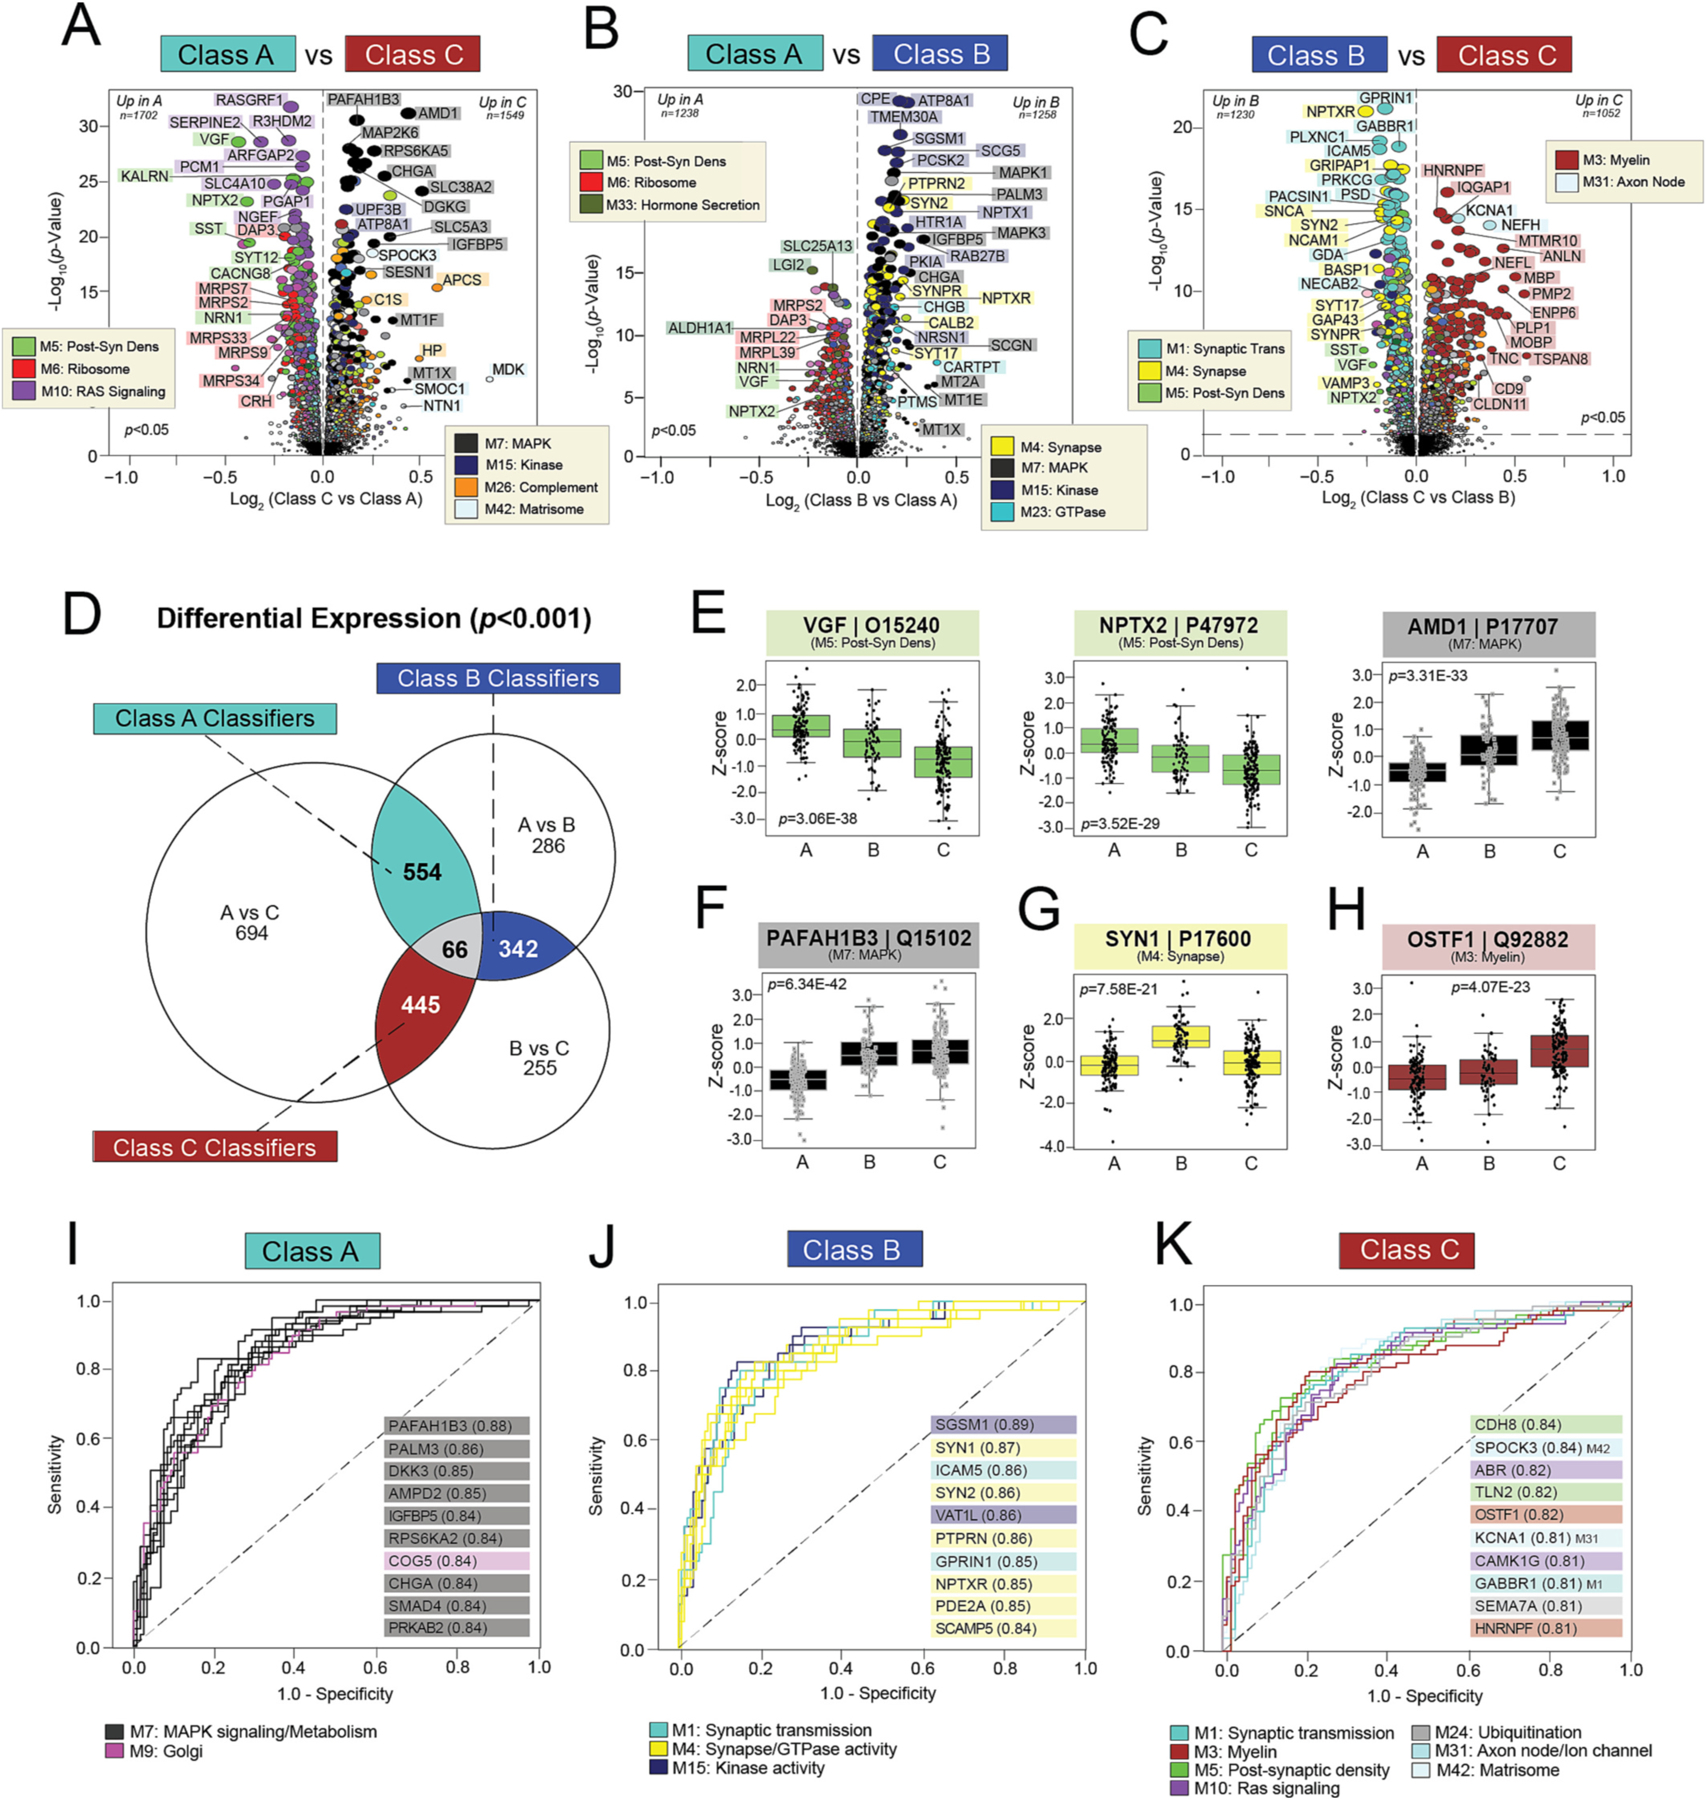
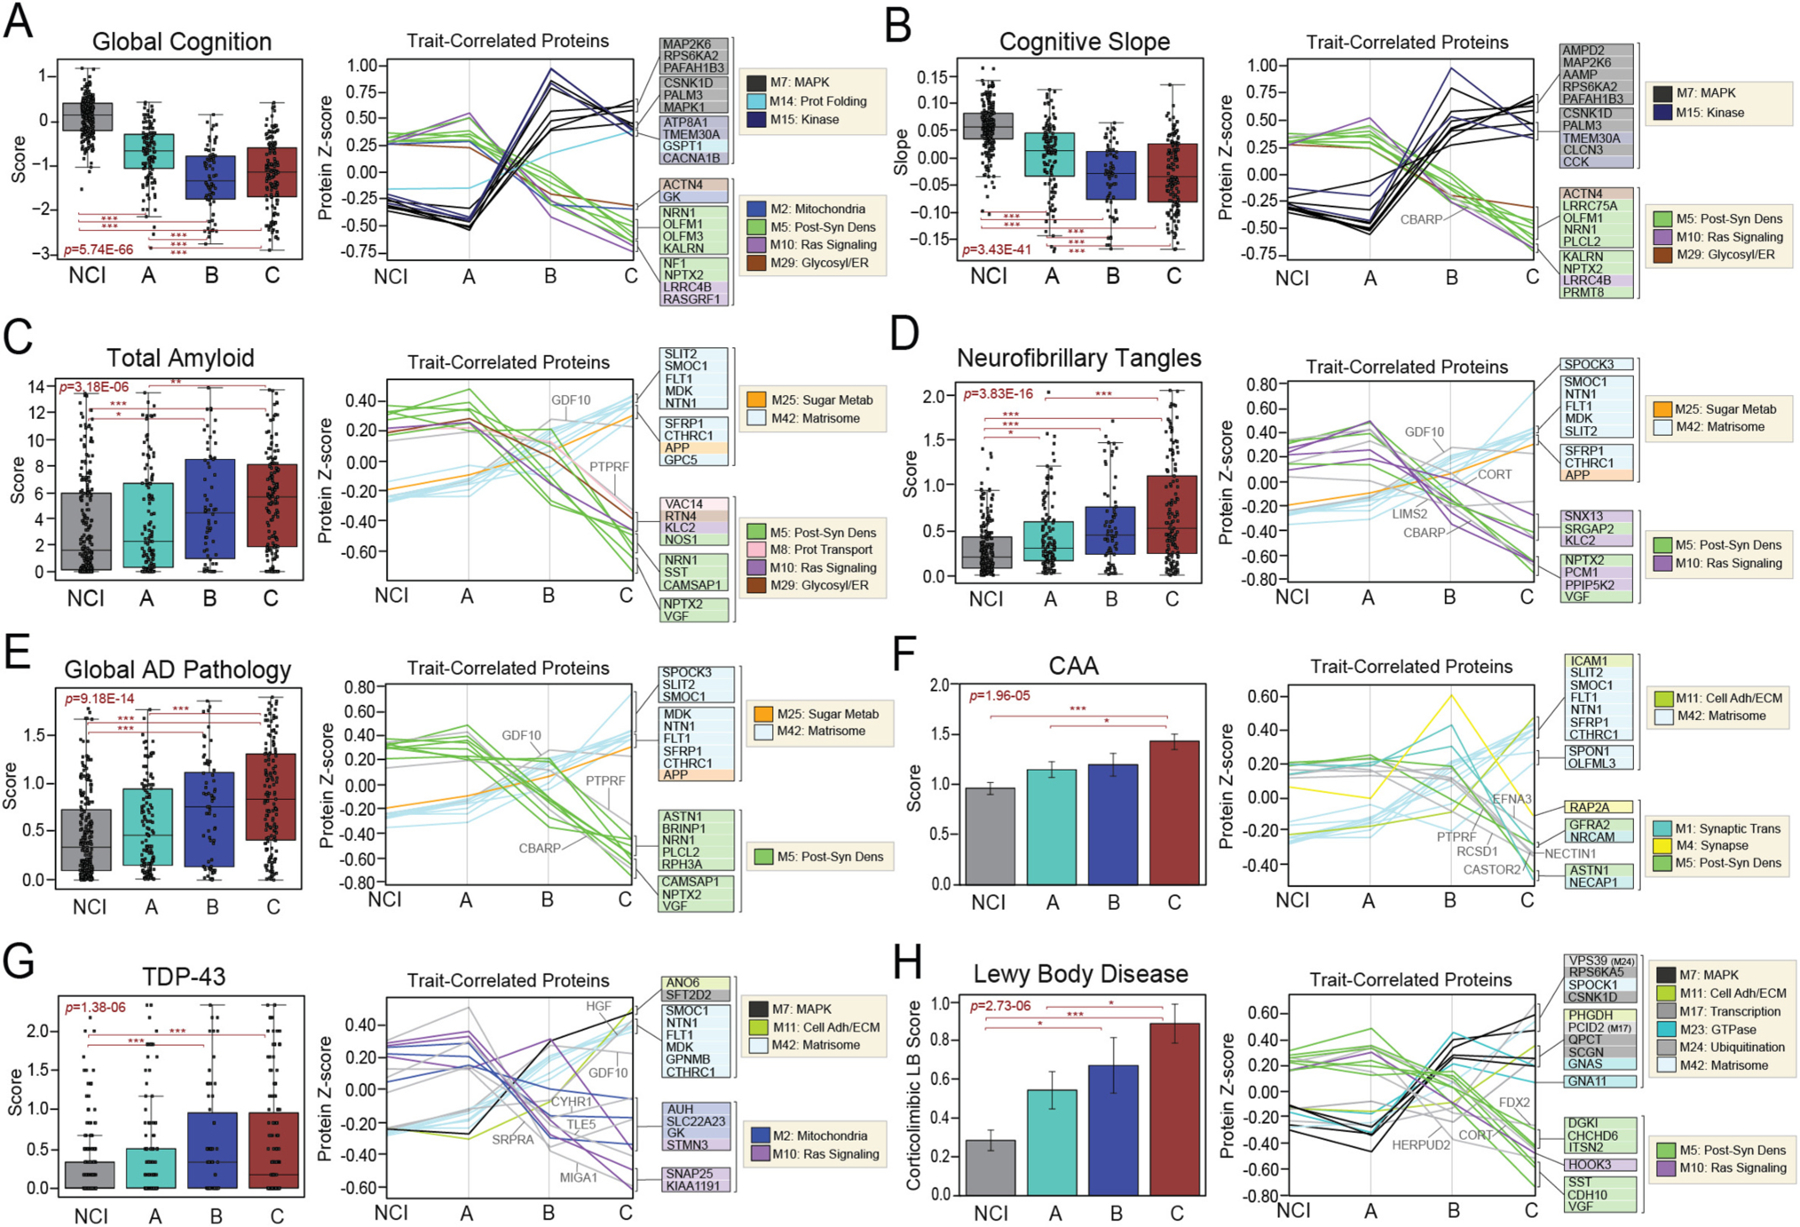
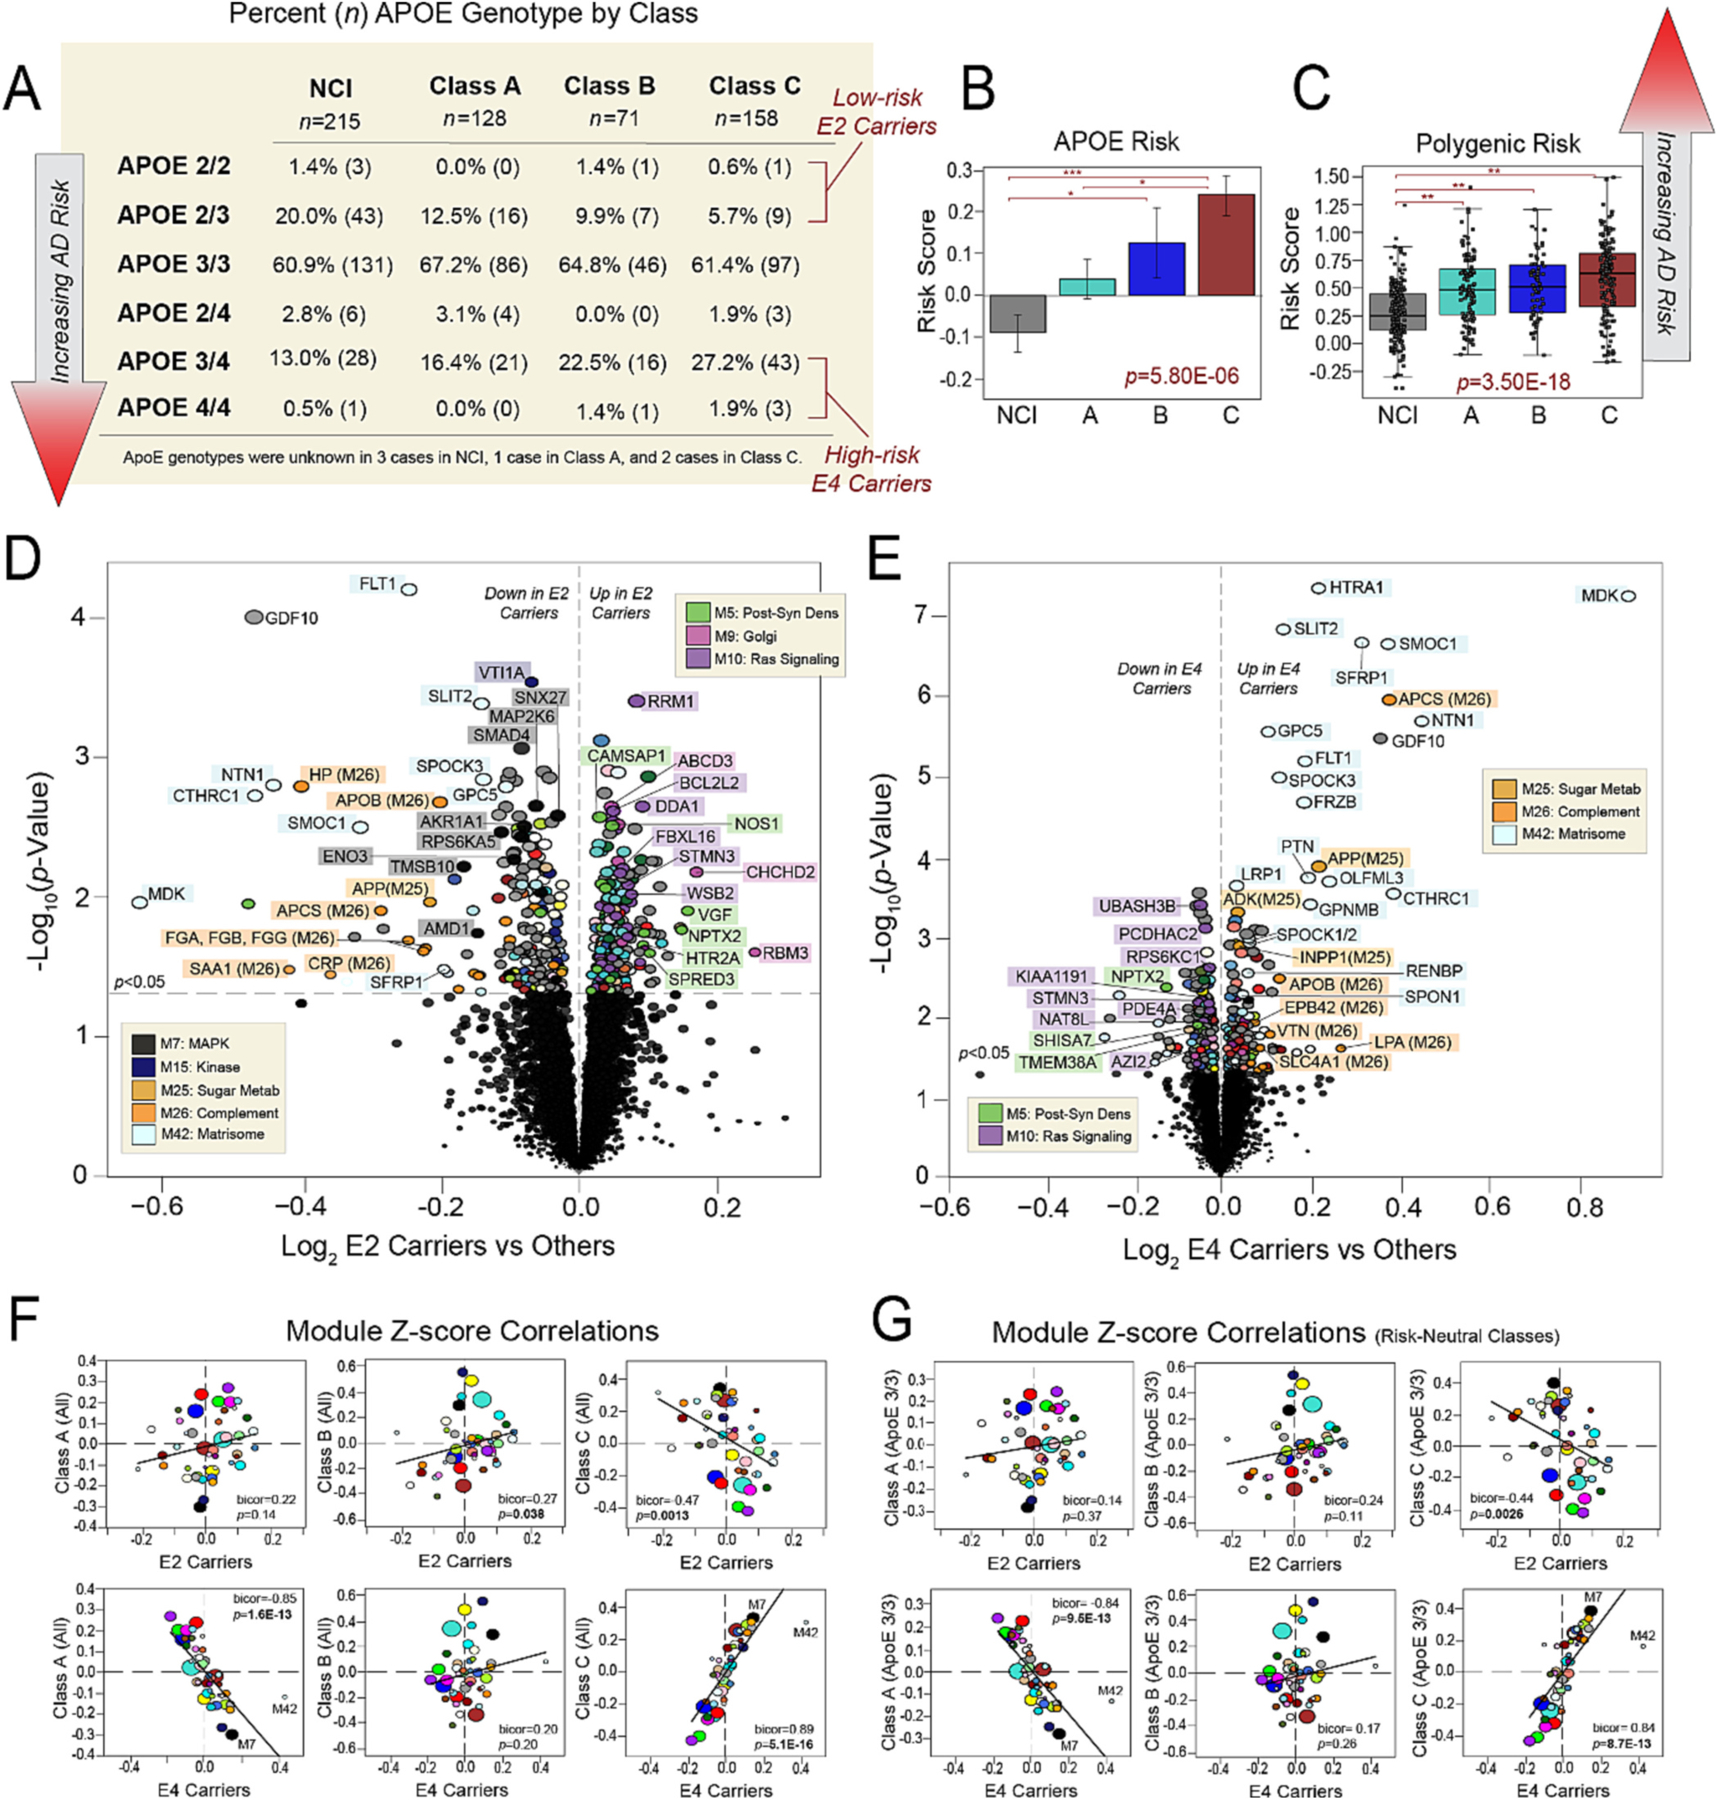
Cognitive impairment in the elderly features complex molecular pathophysiology extending beyond the hallmark pathologies of traditional disease classification. Molecular subtyping using large-scale -omic strategies can help resolve this biological heterogeneity. Using quantitative mass spectrometry, we measured ∼8000 proteins across >600 dorsolateral prefrontal cortex tissues with clinical diagnoses of no cognitive impairment (NCI), mild cognitive impairment (MCI), and Alzheimer's disease (AD) dementia. Unbiased classification of MCI and AD cases based on individual proteomic profiles resolved three classes with expression differences across numerous cell types and biological ontologies. Two classes displayed molecular signatures atypical of AD neurodegeneration, such as elevated synaptic and decreased inflammatory markers. In one class, these atypical proteomic features were associated with clinical and pathological hallmarks of cognitive resilience. We were able to replicate these classes and their clinicopathological phenotypes across two additional tissue cohorts. These results promise to better define the molecular heterogeneity of cognitive impairment and meaningfully impact its diagnostic and therapeutic precision.

Keywords: Alzheimer's disease; Biomarkers; Dementia; Proteomics; Systems biology.


Conflict of interest statement

Declaration of Competing Interest A.I.L, N.T.S., and D.M.D. are co-founders of Emtherapro Inc. The authors declare no conflicts of interest.

Figures

Fig. 1.
Fig. 1.. Clinicopathological characteristics of clinical diagnostic groups.
Boxplots of the cognitive and neuropathological characteristics of each clinical diagnostic group. Of the 610 ROSMAP samples analyzed by TMT-MS, we included 597 samples in our secondary analyses with clinical diagnoses of NCI (n = 220), MCI (n = 173), and AD (n = 204). MCI and AD cases featured significantly lower cognitive scores and higher levels of AD and non-AD neuropathology compared to those with NCI. Yet, there was notable pathological heterogeneity among these clinical diagnostic groups. Box plots represent the median and 25th and 75th percentiles, while data points up to 1.5 times the interquartile range from the box hinge define the extent of error bar whiskers. The ANOVA p value is provided for each boxplot with asterisks indicating statistically significant Tukey post hoc pairwise comparisons (*, p < 0.05; **, p < 0.01; ***, p < 0.001). Abbreviations: NCI, No Cognitive Impairment; MCI, Mild Cognitive Impairment; AD, Alzheimer’s Disease; MMSE, Mini-Mental State Examination; CAA, Cerebral Amyloid Angiopathy; TDP-43, TAR DNA-Binding Protein 43.
Fig. 2.
Fig. 2.. Proteomic signatures of clinical diagnostic groups.
(A) Study approach for the differential expression analysis of the ROSMAP clinical diagnostic groups. (B) Multidimensional scaling plots displaying case distribution based on inter-sample variance pre- and post-TAMPOR normalization between sets. (CD) Volcano plots displaying the log2 fold change (x-axis) against the -log10 statistical p value (y-axis) for proteins differentially expressed between pairwise comparisons of the clinical diagnostic groups. All p values across pairwise comparisons were derived by ANOVA with Tukey post-hoc correction. (E) Correlation analysis of Set 1 (x-axis) and Set 2 (y-axis) log-transformed fold changes of proteins differentially expressed (p < 0.05) between NCI and AD cases. The Pearson correlation coefficient is provided. (FH) ROC curves of the 10 most sensitive and specific proteins for each pairwise comparison by AUC values, which are included in parentheses. Abbreviations: NCI, No Cognitive Impairment; MCI, Mild Cognitive Impairment; AD, Alzheimer’s Disease; TMT-MS, Tandem Mass Tag Mass Spectrometry; TAMPOR, Tunable Median Polish of Ratio.
Fig. 3.
Fig. 3.. MONET M1 yields three disease-relevant proteomic classes of cognitive impairment.
(A) Study approach for the unbiased subtyping analysis of ROSMAP MCI and AD cases. (B) Heat map of protein expression across the three proteomic classes generated by MONET M1 analysis. Classes were termed A (n = 128), B (n = 71), and C (n = 158) and each featured a mixture of MCI and AD cases. To provide biological context to the proteomic differences across classes, proteins were organized by modules (M) of co-expression informed by prior AD network analyses. Red boxes highlight modules with relatively elevated levels (yellow shading) in select classes. (C) Diagram depicting the associations of each module to cell type and ROSMAP clinicopathological traits. Modules bolded in red (M5, M10, M29, M20, M42, M11, M24, M7, M15, M25) demonstrated exceptionally strong correlations to cognitive slope and/or global AD pathology (bicor>0.25; p < 0.001). (D) Correlation plots of module abundance (z-score) to cognitive slope or global AD pathology across all analyzed cases (n = 610) for select modules with remarkably strong clinicopathological correlations. M5 and M10 demonstrated highly significant positive correlations to cognitive slope and negative correlations to global AD pathology. In contrast, M7 and M42 were negatively correlated to cognitive slope and positively correlated to global AD pathology. Bicor correlation coefficients with associated p values are shown for each correlation plot. Abbreviations: DLPFC, Dorsolateral Prefrontal Cortex; MCI, Mild Cognitive Impairment; AD, Alzheimer’s Disease; TMT-MS, Tandem Mass Tag Mass Spectrometry; FDR, False Discovery Rate; Post-Syn Dens, Post-Synaptic Density. (For interpretation of the references to color in this figure legend, the reader is referred to the web version of this article.)
Fig. 4.
Fig. 4.. Module abundances highlight class differences across a diverse range of biological ontologies.
Abundance levels (z-score) of select modules across NCI cases and the three proteomic classes. ANOVA p values are provided for each abundance plot. All modules depicted were significantly altered (p < 0.001) across the four groups. Box plots represent the median and 25th and 75th percentiles, while data points up to 1.5 times the interquartile range from the box hinge define the extent of error bar whiskers. Modules relatively increased in NCI and Class A included M5, M6, M9, and M10, corresponding to post-synaptic density, ribosome, Golgi, and Ras signaling proteins, respectively (A). Kinase-associated M7 and M15 were among modules significantly decreased in NCI and Class A compared to the other two classes (B). Numerous modules were uniquely increased in Class C, most notably several linked to glial-mediated processes (M3, M11, M21, M26, M42) (C). Several synaptic modules (M1, M4, M23) were increased in Class B relative to all other cases (D). Abbreviations: NCI, No Cognitive Impairment; MCI, Mild Cognitive Impairment; AD, Alzheimer’s Disease; Cell Adh / ECM, Cell Adhesion / Extracellular Matrix; Translation Init, Translation Initiation; MHC, Major Histocompatibility Complex; Synaptic Trans, Synaptic Transmission.
Fig. 5.
Fig. 5.. Differential expression of individual proteins reveals highly sensitive and specific classifiers.
A-C) Volcano plots displaying the log2 fold change (x-axis) against the -log10 statistical p value (y-axis) for proteins differentially expressed between pairwise class comparisons. All p values across pairwise comparisons were derived by ANOVA with Bonferroni post-hoc correction. Proteins are shaded according to color of module membership. (D) Venn diagram of significantly altered proteins (p < 0.001) across pairwise class comparisons. There were 66 proteins with significant changes across all three pairwise comparisons, while hundreds of proteins were significantly altered across two of the three pairwise comparisons. The latter were deemed “classifiers”, as each was uniquely altered in one class relative to the other two. There were 554 Class A classifiers, 342 Class B classifiers, and 445 Class C classifiers. (E-H) Abundance levels (z-score) of select proteins across NCI cases and the three classes. ANOVA p values are provided for each abundance plot. Box plots represent the median and 25th and 75th percentiles, while box hinges depict the interquartile range of the two middle quartiles within a group. Data points up to 1.5 times the interquartile range from the box hinge define the extent of error bar whiskers. The 66 proteins altered across all pairwise class comparisons included neuroprotective markers with well-described links to AD (VGF, NPTX2) and those without known associations to disease (AMD1) (E). Classifiers altered in two of the three pairwise class comparisons included PAFAH1B3 for Class A, SYN1 for Class B, and OSTF1 for Class C (F-H). (I-K) ROC curves of the 10 most sensitive and specific proteins for each class by AUC values, which are included in parentheses. Proteins are shaded according to color of module membership. Abbreviations: Post-Syn Dens, Post-Synaptic Density.
Fig. 6.
Fig. 6.. Classes demonstrate different cognitive and pathological features.
Cognitive (A-B) and neuropathological (C-H) characteristics were compared across NCI cases and the three proteomic classes. For each trait, two plots are provided. The first depicts the average scores of each trait across the four groups. The ANOVA p value across groups is provided with asterisks indicating statistically significant Tukey post hoc pairwise comparisons (*, p < 0.05; **, p < 0.01; ***, p < 0.001). Box plots represent the median and 25th and 75th percentiles, while data points up to 1.5 times the interquartile range from the box hinge define the extent of error bar whiskers. The second plot in each panel showcases the abundance levels (z-scores) across groups of individual proteins highly correlated to that particular trait. The z-scores of the top 10 positively trait-correlated and top 10 negatively trait-correlated proteins are shown. Proteins are shaded according to color of module membership. Proteins without a module assignment are not shaded. Abbreviations: CAA, Cerebral Amyloid Angiopathy; TDP-43, TAR DNA-Binding Protein 43; Prot Folding, Protein Folding; Post-Syn Dens, Post-synaptic Density; Glycosyl, Glycosylation; ER, Endoplasmic Reticulum; Prot Transport, Protein Transport; Adh, Adhesion; ECM, Extracellular Matrix; Metab, Metabolism.
Fig. 7.
Fig. 7.. Class C protein expression strongly mirrors that of ApoE4 carriers.
(A) Table showcasing the percentages of different APOE genotypes within NCI and each class. The corresponding number of cases with each genotype is also provided in parentheses. Cases considered low-risk E2 carriers or high-risk E4 carriers are indicated. Class C comprised twice as many high-risk E4 carriers compared to Classes A and B. (B) Comparison of average APOE risk scores across NCI and the three proteomic classes. Individual risk scores for each case were calculated by assigning −1 points to each E2 allele, 0 points to each E3 allele, and +1 points to each E4 allele. The ANOVA p value across groups is provided with asterisks indicating statistically significant Tukey post hoc pairwise comparisons (*, p < 0.05; **, p < 0.01; ***, p < 0.001). (C) Comparison of polygenic risk scores across NCI and the three proteomic classes. The ANOVA p value across groups is provided with asterisks indicating statistically significant Tukey post hoc pairwise comparisons (*, p < 0.05; **, p < 0.01; ***, p < 0.001). (D-E) Volcano plots displaying the log2 fold change (x-axis) against the t-test-derived -log10 statistical p value (y-axis) for proteins differentially expressed in E2 carriers or E4 carriers when compared to all other cases, excepting those with E2/4 genotypes which were excluded from these analyses. Thus, (D) is a comparison of protein expression in the 34 cases with E2/2 and E2/3 genotypes to the 313 cases with E3/3, E3/4, and E4/4 genotypes, while (E) is a comparison of protein expression in the 84 cases with E3/4 and E4/4 genotypes to the 263 cases with E2/2, E2/3, and E3/3 genotypes. Proteins are shaded according to color of module membership. (F-G) Correlation plots of module abundance levels (z-scores) in E2 (E2/2, E2/3) or E4 (E3/4, E4/4) carriers to those of each proteomic class. Class-specific z-scores in (F) reflect all members of each class, while those in (G) reflect only individuals with E3/3 genotypes in each class. Bicor correlation coefficients with associated p values are shown for each correlation plot. Abbreviations: Post-Syn Dens, Post-Synaptic Density; Metab, Metabolism.

References

    1. Andrews SJ, Fulton-Howard B, Goate A, 2020. Interpretation of risk loci from genome-wide association studies of Alzheimer’s disease. Lancet. Neurol 19 (4), 326–335. - PMC - PubMed
    1. Arenas A, Fernandez A, Gómez S, 2008. Analysis of the structure of complex networks at different resolution levels. New J. Phys 10 (5), 053039.
    1. Association, A.s, 2018. Alzheimer’s disease facts and figures. Alzheimer’s & Dementia 14 (3), 367–429, 2018.
    1. Bai B, et al. 2020. Deep multilayer brain proteomics identifies molecular networks in Alzheimer’s disease progression. Neuron 105 (6), 975–991 e7. - PMC - PubMed
    1. Bakkour A, Morris JC, Dickerson BC, 2009. The cortical signature of prodromal AD: regional thinning predicts mild AD dementia. Neurology 72 (12), 1048–1055. - PMC - PubMed

Publication types