

Plasmodium falciparum population structure inferred by msp1 amplicon sequencing of parasites collected from febrile patients in Kenya
- PMID: 37689681
- PMCID: PMC10492417
- DOI: 10.1186/s12936-023-04700-5
Plasmodium falciparum population structure inferred by msp1 amplicon sequencing of parasites collected from febrile patients in Kenya
Abstract
Background: Multiplicity of infection (MOI) is an important measure of Plasmodium falciparum diversity, usually derived from the highly polymorphic genes, such as msp1, msp2 and glurp as well as microsatellites. Conventional methods of deriving MOI lack fine resolution needed to discriminate minor clones. This study used amplicon sequencing (AmpliSeq) of P. falciparum msp1 (Pfmsp1) to measure spatial and temporal genetic diversity of P. falciparum.
Methods: 264 P. falciparum positive blood samples collected from areas of differing malaria endemicities between 2010 and 2019 were used. Pfmsp1 gene was amplified and amplicon libraries sequenced on Illumina MiSeq. Sequences were aligned against a reference sequence (NC_004330.2) and clustered to detect fragment length polymorphism and amino acid variations.
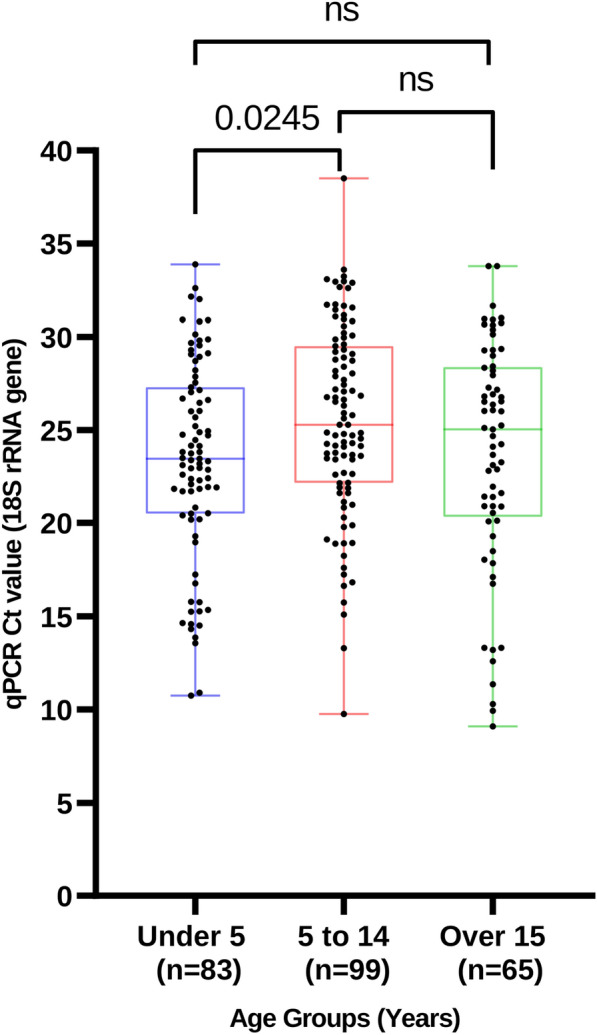
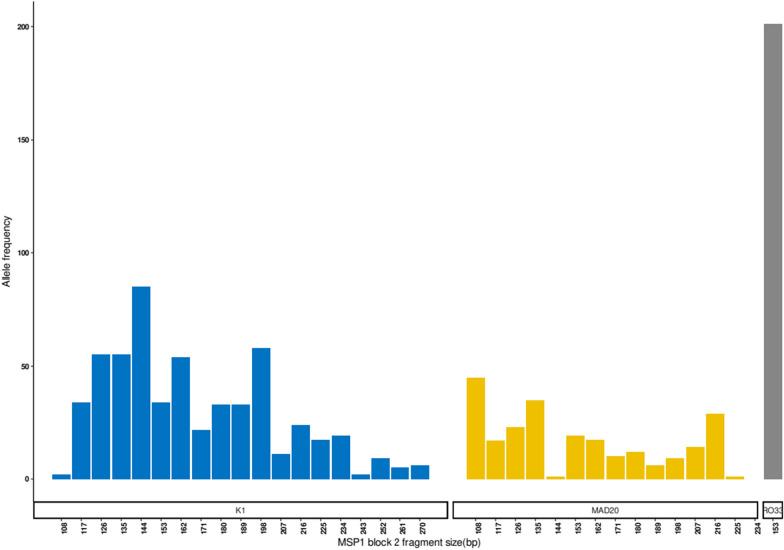
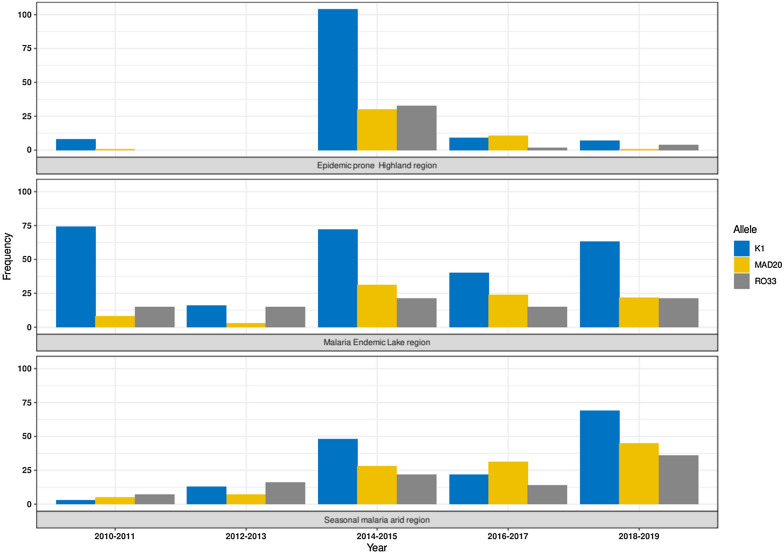
Results: Children < 5 years had higher parasitaemia (median = 23.5 ± 5 SD, p = 0.03) than the > 5-14 (= 25.3 ± 5 SD), and those > 15 (= 25.1 ± 6 SD). Of the alleles detected, 553 (54.5%) were K1, 250 (24.7%) MAD20 and 211 (20.8%) RO33 that grouped into 19 K1 allelic families (108-270 bp), 14 MAD20 (108-216 bp) and one RO33 (153 bp). AmpliSeq revealed nucleotide polymorphisms in alleles that had similar sizes, thus increasing the K1 to 104, 58 for MAD20 and 14 for RO33. By AmpliSeq, the mean MOI was 4.8 (± 0.78, 95% CI) for the malaria endemic Lake Victoria region, 4.4 (± 1.03, 95% CI) for the epidemic prone Kisii Highland and 3.4 (± 0.62, 95% CI) for the seasonal malaria Semi-Arid region. MOI decreased with age: 4.5 (± 0.76, 95% CI) for children < 5 years, compared to 3.9 (± 0.70, 95% CI) for ages 5 to 14 and 2.7 (± 0.90, 95% CI) for those > 15. Females' MOI (4.2 ± 0.66, 95% CI) was not different from males 4.0 (± 0.61, 95% CI). In all regions, the number of alleles were high in the 2014-2015 period, more so in the Lake Victoria and the seasonal transmission arid regions.
Conclusion: These findings highlight the added advantages of AmpliSeq in haplotype discrimination and the associated improvement in unravelling complexity of P. falciparum population structure.
Keywords: Deep sequencing; Genetic diversity; Malaria; Multiplicity of infection; P. falciparum; P. falciparum msp1.
© 2023. BioMed Central Ltd., part of Springer Nature.
Conflict of interest statement
The authors declare no competing interests.
Figures

References
-
- WHO . World malaria report 2021. Geneva: World Health Organization; 2021.
-
- Kenya Demographic and Health Survey. 2021 Kenya Malaria Indicator Survey. Nairobi, Kenya, 2021.
-
- Anderson TJC, Haubold B, Williams JT, Estrada-franco JG, Richardson L, Mollinedo R, et al. Microsatellite markers reveal a spectrum of population structures in the malaria parasite Plasmodium falciparum. Mol Biol Evol. 2018;17:1467–1482. - PubMed
MeSH terms
Substances
Supplementary concepts
Grants and funding
LinkOut - more resources
Full Text Sources
