. 2023 Sep 9;14(1):5552.
doi: 10.1038/s41467-023-41326-2.

Human blood vessel organoids reveal a critical role for CTGF in maintaining microvascular integrity

Affiliations

Human blood vessel organoids reveal a critical role for CTGF in maintaining microvascular integrity

Sara G Romeo et al. Nat Commun. .

Abstract

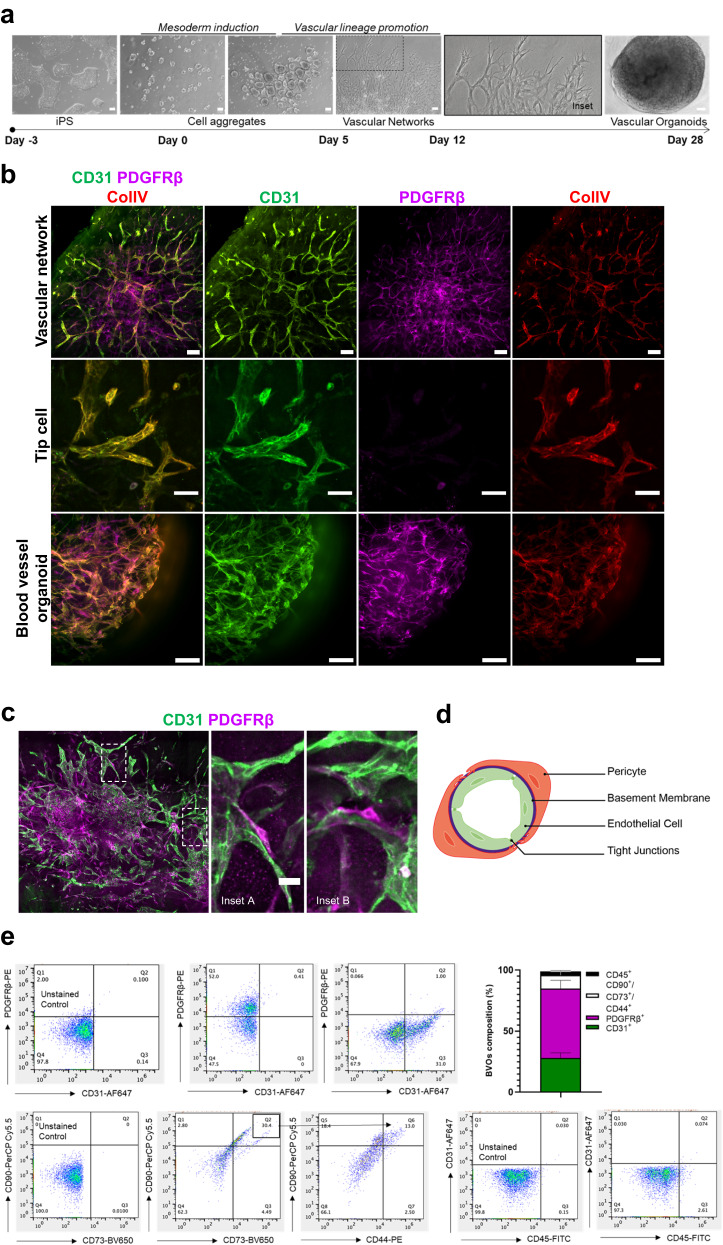
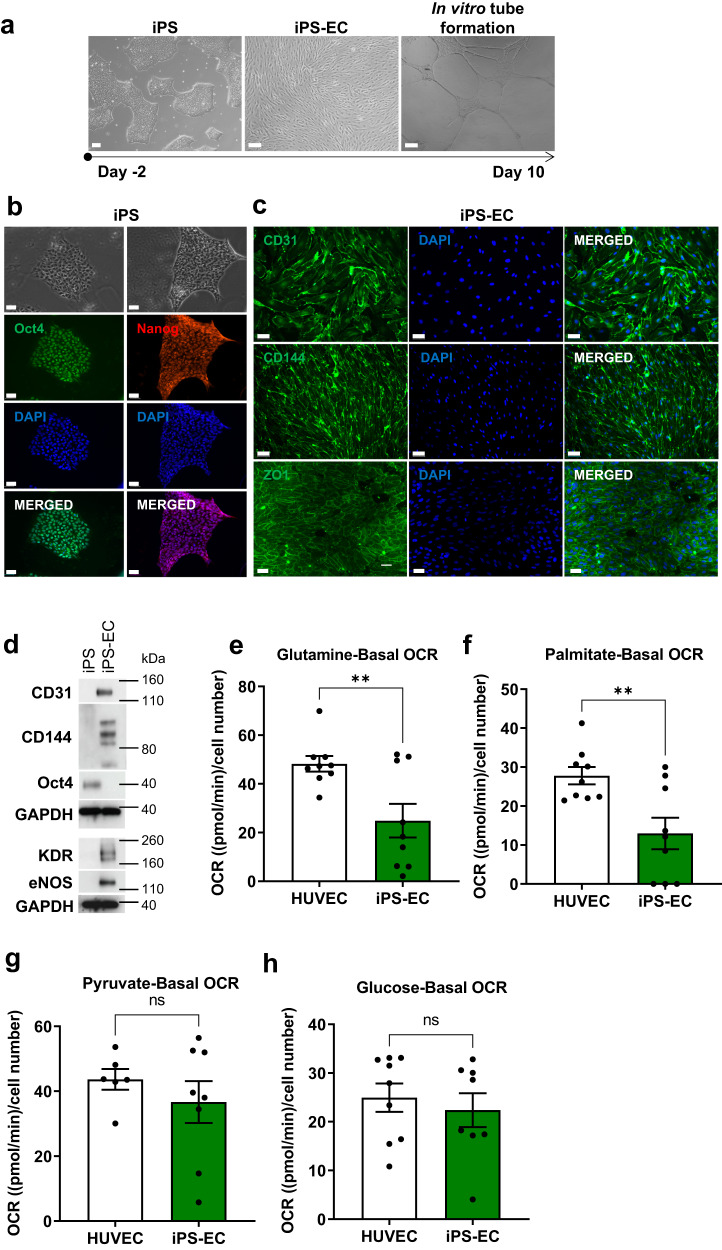
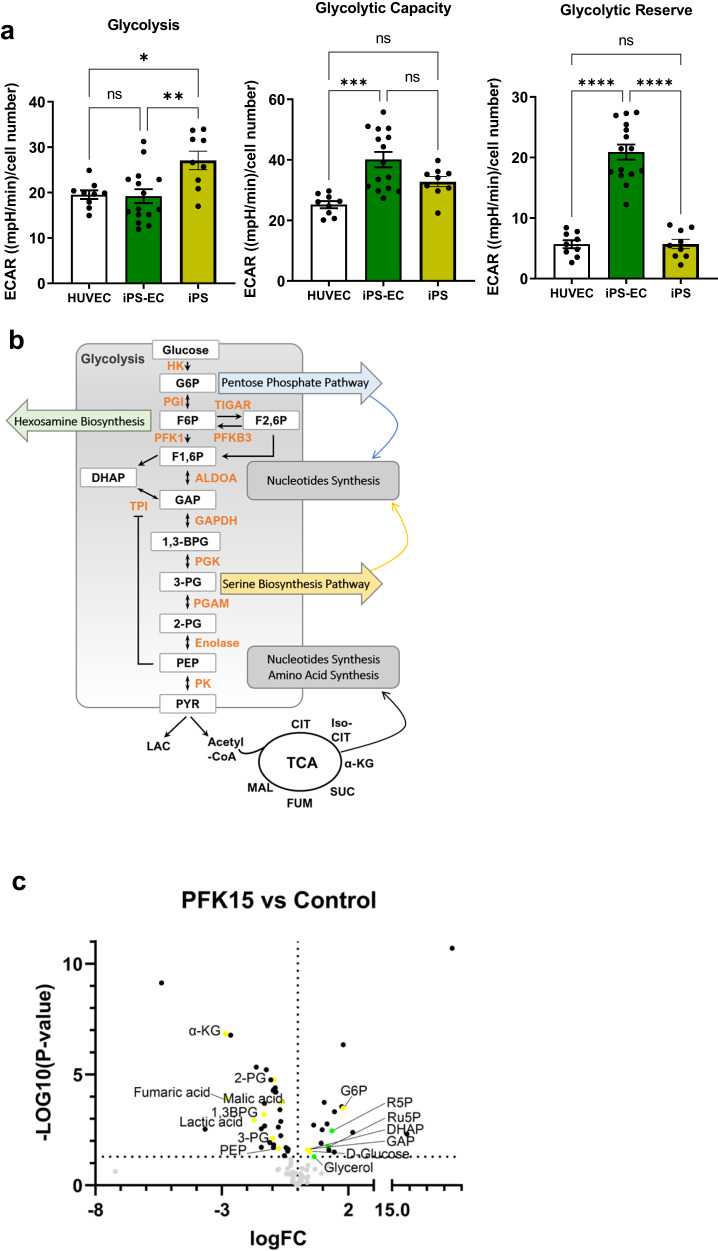
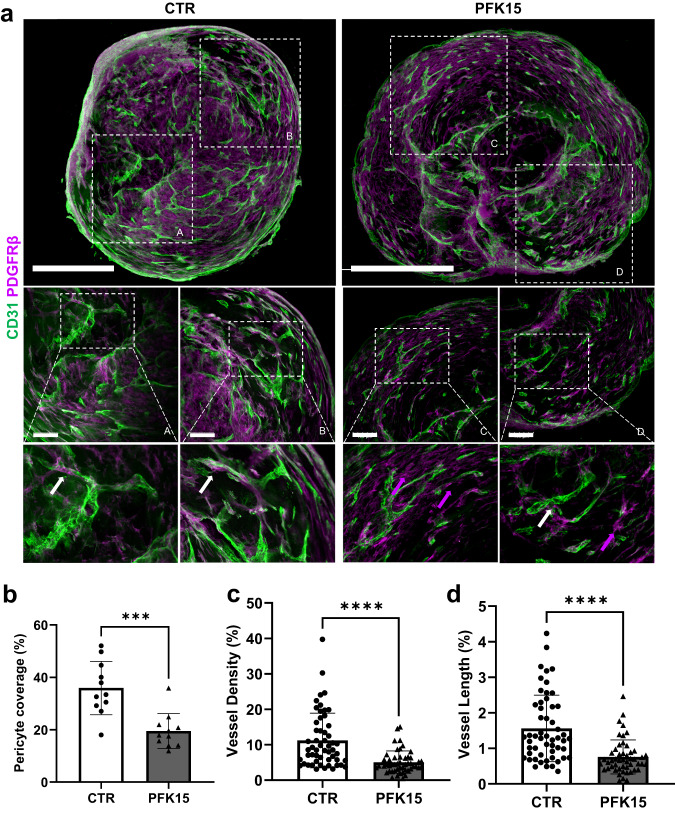
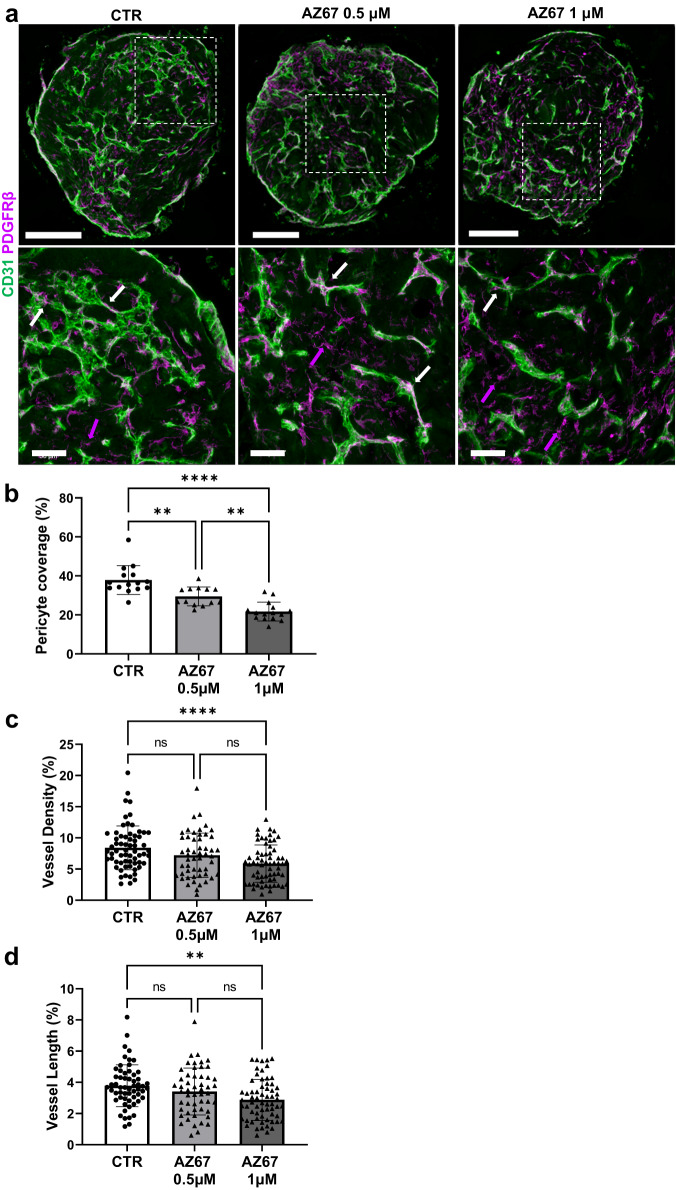
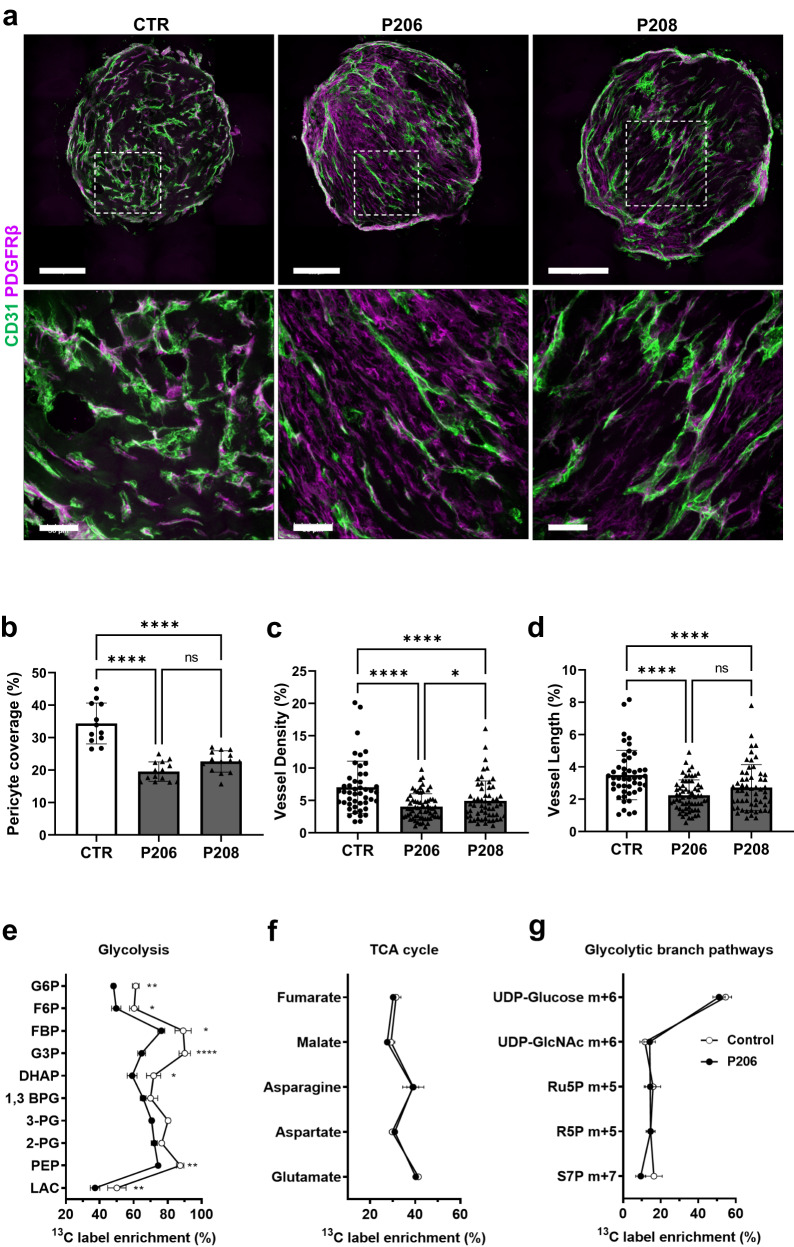
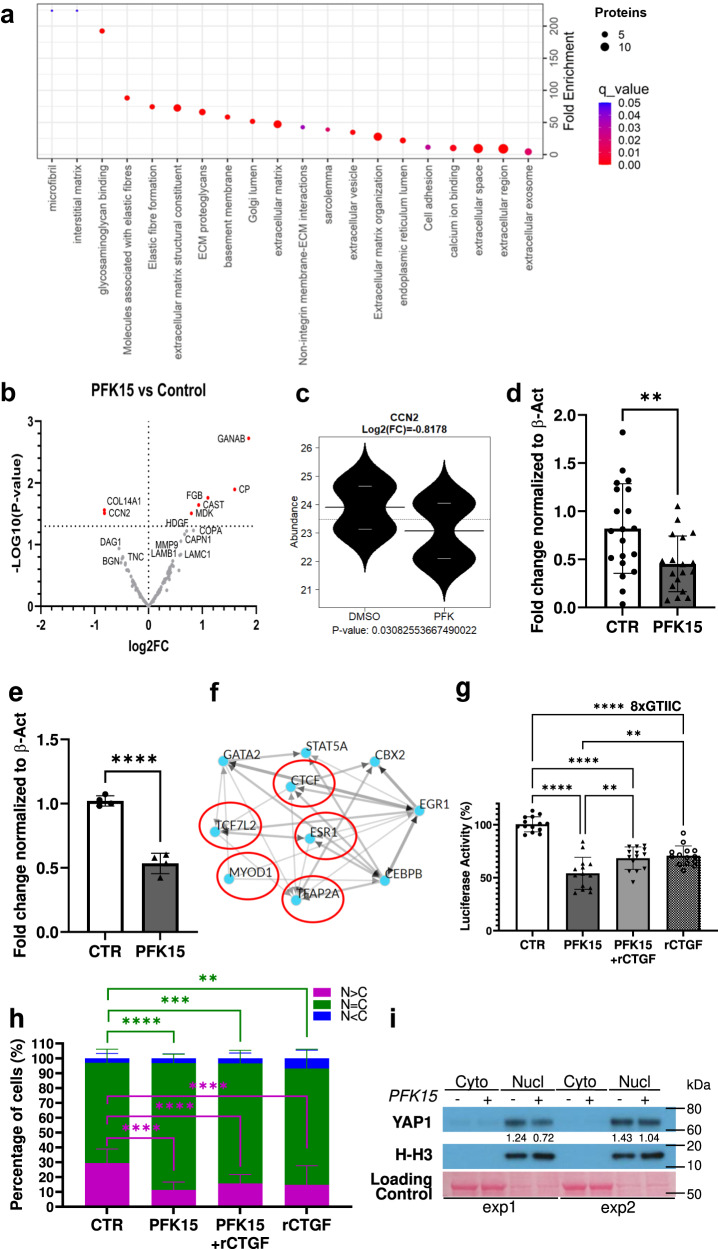
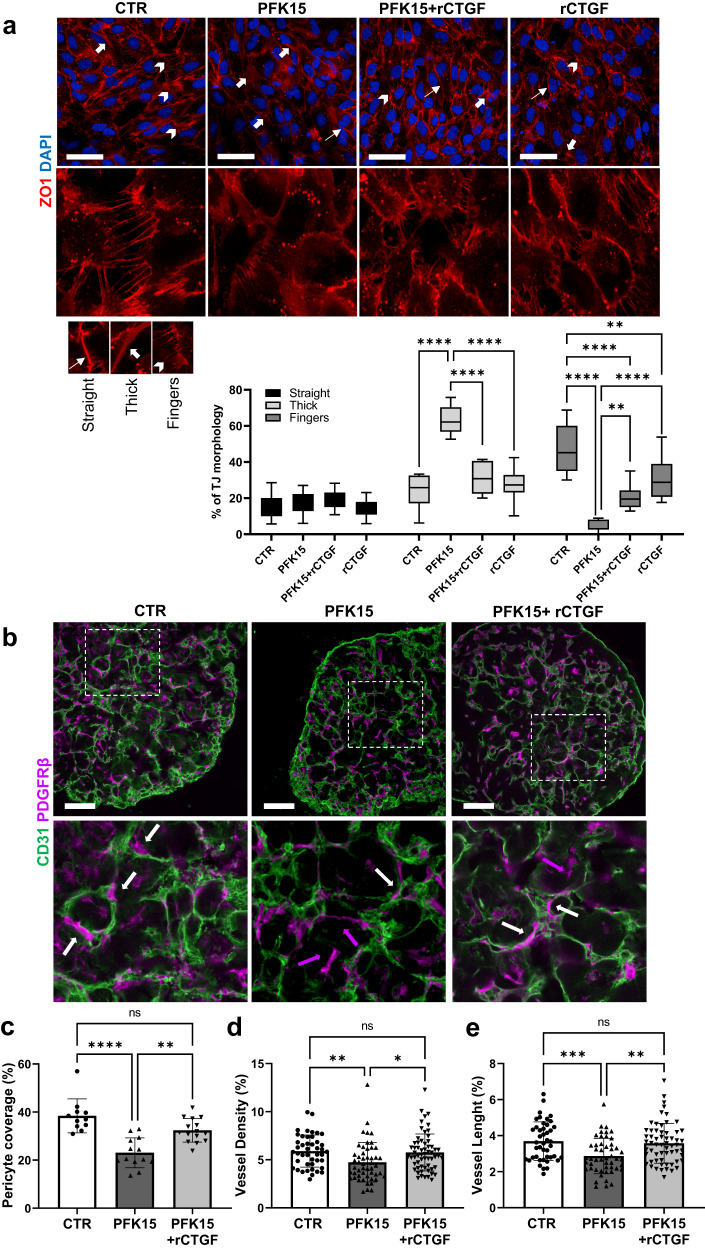
The microvasculature plays a key role in tissue perfusion and exchange of gases and metabolites. In this study we use human blood vessel organoids (BVOs) as a model of the microvasculature. BVOs fully recapitulate key features of the human microvasculature, including the reliance of mature endothelial cells on glycolytic metabolism, as concluded from metabolic flux assays and mass spectrometry-based metabolomics using stable tracing of 13C-glucose. Pharmacological targeting of PFKFB3, an activator of glycolysis, using two chemical inhibitors results in rapid BVO restructuring, vessel regression with reduced pericyte coverage. PFKFB3 mutant BVOs also display similar structural remodelling. Proteomic analysis of the BVO secretome reveal remodelling of the extracellular matrix and differential expression of paracrine mediators such as CTGF. Treatment with recombinant CTGF recovers microvessel structure. In this work we demonstrate that BVOs rapidly undergo restructuring in response to metabolic changes and identify CTGF as a critical paracrine regulator of microvascular integrity.


Conflict of interest statement

The authors declare no competing interests.

Figures

Fig. 1
Fig. 1. Generation of human blood vessel organoids (BVOs).
a Bright-field images of human iPS cell differentiation into vascular networks and BVOs. b Phenotypic characterisation of vascular networks and BVOs, showing CD31-expressing ECs (green) forming vascular networks covered by PDGFRβ+ pericytes (PCs, magenta) and a basement membrane (collagen type IV (Col IV), red). c Immunofluorescence confocal imaging of vascular networks showing pericyte coverage (PDGFRβ+, magenta) of CD31+ ECs (green). d Schematic depicting the microvascular structure. e FACS was used to determine the different cell populations in BVOs. ECs were defined as CD31+, PCs as PDGFRβ+, mesenchymal stem-like cells as CD90+CD73+CD44+ and haematopoietic cells as CD45+. Cells from a total of 7 BVOs were dissociated and pooled together for this analysis. Data are presented as mean ± SD of n = 2 independent experiments. Bar scales 200, 100 and 50 μm. Source data are provided as a Source Data file.
Fig. 2
Fig. 2. Human iPS cell differentiation toward ECs.
a Typical morphology of a human iPS colony, iPS derived ECs (iPS-ECs), and iPS-EC in vitro tube formation indicating their angiogenic potential are shown by bright field microscopy. Representative images of five independent experiments. b Immunofluorescence confocal image demonstrating the expression of pluripotency markers in human iPS cells and (c) EC-specific markers CD31, CD144 and ZO1 in iPS-ECs. Representative images of five independent experiments. d The expression of EC markers was confirmed by Western blot. N = 2 independent experiments were performed. Quantification of Basal Oxygen Consumption Rate (OCR) measured in iPS-ECs and HUVEC provided with either (e) glutamine, (f) palmitate, (g) pyruvate, or (h) glucose in the assay media. Three independent lines were assessed in n = 3 wells per assay per line. Values are presented as mean ± SEM; P values were calculated using a two-tailed Student’s t-test. (e: **p = 0.0072; f: **p = 0.0054). ns not significant. Source data are provided as a Source Data file.
Fig. 3
Fig. 3. Comparison of glycolytic rates in HUVEC, iPS-ECs and iPS.
a Glycolysis, glycolytic capacity and glycolytic reserve were measured in HUVEC, iPS-ECs and iPS by performing glycolysis stress tests on a Seahorse XFe24. Three independent lines were used for each cell type and n = 3 wells for HUVEC and iPS-ECs and n = 5 wells for iPS were assessed per line. ECAR (Extracellular Acidification Rate). Data are shown as mean ± SEM using one-way ANOVA followed by Tukey’s multiple comparisons tests. (Glycolysis: *p = 0.0139; **p = 0.0040; Glycolytic Capacity: ***p = 0.0001; Glycolytic Reserve: HUVEC vs. iPS-EC ****p = 0.000000000168; iPS-EC vs. iPS ****p = 0.000000000178). ns not significant. b Schematic representation of glycolysis with highlighted metabolic pathways that contribute to biomass production. c Volcano plot depicting differences in the metabolite abundance in iPS-ECs following PFK15 treatment for 7 h. Metabolites in glycolysis and the TCA cycle are depicted in yellow, metabolites in the PPP are shown in green. N = 3 independent experiments. Statistical comparisons were conducted using the Ebayes method of the limma package. Nominal p-values are presented in volcano plot while corrected for multiple testing p-values with the Benjamini–Hochberg method are provided in Supplementary Data 1. HK hexokinase, G6P glucose-6-phosphate, PGI phosphoglucose isomerase, F6P fructose-6-phosphate, TIGAR TP53-induced glycolysis and apoptosis regulator, PFKFB3 6-phosphofructo-2-kinase/Fructose-2,6-biphosphatase 3, F-2,6-BP fructose-2,6-bisphosphate, PFK1 phosphofructokinase-1, F1,6 BP fructose-1,6-bisphosphate, ALDOA aldolase A, GAP, G3P glyceraldehyde 3-phosphate, GAPDH glyceraldehyde-3-phosphate dehydrogenase, DHAP dihydroxyacetone phosphate, LAC lactic acid, TPI triosephosphate isomerase, 1,3-BPG 1,3-bisphosphoglycerate, PGK phosphoglycerate kinase, 3-PG 3-phosphoglycerate, PGAM phosphoglycerate mutase, 2-PG 2-phosphoglycerate, PEP phosphoenolpyruvate, PK pyruvate kinase, HBP hexosamine biosynthetic pathway, PPP pentose phosphate pathway, R5P ribose 5-phosphate, Ru5P ribulose 5-phosphate, S7P sedoheptulose 7-phosphate, UDP-GlcNAc uridine diphosphate N-acetylglucosamine, P-Serine phosphoserine, α -KG α-Ketoglutaric acid, 2-HG 2-Hydroxyglutarate. Source data are provided as a Source Data file.
Fig. 4
Fig. 4. The effect of PFK15 on BVO structure.
a Immunofluorescence confocal imaging of BVO sections showing pericyte coverage (PDGFRβ, magenta) of CD31+ ECs (green). White arrows indicate pericytes attached to microvessels, magenta arrows indicate extravascular mural cells. b Percentage of pericyte coverage n = 6 BVOs per group, from three separate preparations. One-two sections per BVO were assessed. c Quantification of vessel density, (d) length in n = 6 BVOs per group, from three separate preparations in four different areas per x10 images. One-two sections per BVO were assessed. Values are presented as mean ± SD; P-values were calculated using a two-tailed Student’s t-test. (b: ***p = 0.0002; c: ****p = 0.000000894; d: ****p = 0.000000394). Bar scales 500 and 50 μm. Source data are provided as a Source Data file.
Fig. 5
Fig. 5. The effect of AZ67 on BVO structure.
a Immunofluorescence confocal imaging of BVO sections showing pericyte coverage (PDGFRβ, magenta) of CD31+ ECs (green). b Percentage of pericyte coverage n = 7 BVOs per group, from three separate preparations. White arrows indicate pericytes attached to microvessels, magenta arrows indicate extravascular mural cells. One-two sections per BVO were assessed. c Quantification of vessel density, d length in n = 7 BVOs per group, from 3 separate preparations in 4 different areas per x10 images. One-two sections per BVO were assessed. Values are presented as mean ± SD; P values were calculated using a one-way ANOVA followed by Tukey’s multiple comparisons tests. (b: CTR vs. AZ67 0.5 μM **p = 0.0015; CTR vs. AZ67 1 μM ****p = 0.000000010; AZ67 0.5 μM vs. AZ67 1 μM **p = 0.0034; c: **** p = 0.000096; d: **p = 0.0012). ns not significant. Bar scales 200 and 50 μm. Source data are provided as a Source Data file.
Fig. 6
Fig. 6. The effect of PFKFB3 knockout on BVO structure.
a CRISPR-Cas9 genome editing was used to generate PFKFB3 knockout iPS cells. Immunofluorescence confocal imaging of unedited control (CTR) and PFKFB3 knockout (P206, P208) BVO sections showing pericyte coverage (PDGFRβ, magenta) of CD31+ ECs (green). b Percentage of pericyte coverage CTR n = 6 BVOs, P206 n = 7 BVOs, P208 n = 7 BVOs, from three separate preparations. One-two sections per BVO were assessed. c Quantification of vessel density and (d) length in CTR n = 6 BVOs, P206 n = 7 BVOs, P208 n = 7 BVOs, from three separate preparations in four different areas per x10 images. One-two sections per BVO were assessed. Values are presented as mean ± SD using two-way ANOVA followed by Tukey’s multiple comparisons tests. (b: CTR vs. P206 ****p = 0.000000000522; CTR vs. P208 ****p = 0.000000128; c: *p = 0.0374; CTR vs P206 ****p = 0.000027; CTR vs P208 ****p = 0.000000022; d: CTR vs P206 ****p = 0.000088; CTR vs P208 ****p = 0.000005). ns not significant. Bar scales 200 and 50 μm. Effect of PFKFB3 knockout on 13C label incorporation into metabolites related to (e) glycolysis, (f) the TCA cycle and (g) glycolytic branch pathways after 3 h of incubation with 13C6-glucose. Data represents mean ± SEM, n = 4 independent experiments, statistical significance was assessed by a two-way ANOVA with Holm-Sidak post-hoc test. (e: LAC **p = 0.00618; PEP **p = 0.00531; DHAP *p = 0.02990; G3P ****p = 0.000000798; FBP *p = 0.02749; F6P *p = 0.04479; G6P*p = 0.00473). G6P glucose 6-phosphate, F6P fructose 6-phosphate, FBP fructose 1,6-bisphosphate, G3P glyceraldehyde 3-phosphate, DHAP dihydroxyacetone phosphate, 1,3-BPG 1,3-bisphosphoglycerate, 2-PG 2-phosphoglycerate, PEP phosphoenolpyruvate, LAC lactate, UDP uridine diphosphate, GlcNAc N-acetylglucosamine, Ru5P ribulose 5-phosphate, R5P ribose 5-phosphate, S7P sedoheptulose-7-phosphate, m + x mass isotopologues x. Source data are provided as a Source Data file.
Fig. 7
Fig. 7. Proteomic analysis of the BVO secretome.
a Pathway enrichment and (b) volcano plot of proteins detected in the secretome of BVOs treated with DMSO (CTR) or PFK15 (2.5 µM) for 24 h. n = 5 BVOs per pooled sample, from 2 separate preparations. P-values < 0.05 shown in red. Volcano plot was generated using GraphPad Prism 9 software and statistical comparisons were conducted using the Ebayes method of the limma package. Nominal p-values are presented in volcano plot while corrected for multiple testing p-values with the Benjamini-Hochberg method are provided in Supplementary Data 2. c CTGF expression in the BVOs secretome, n = 5 BVOs per pooled sample, from 2 separate preparations. Statistical comparison was conducted using the Ebayes method of the limma package. Nominal p-value is displayed in beanplot while corrected for multiple testing p-value with the Benjamini-Hochberg method is provided in Supplementary Data 2. d QPCR quantification of CTGF expression in BVOs (n = 20 per group from three separate preparations) and in iPS-ECs (e) (n = 4 independent preparations). Data are shown as mean ± SD; p values were calculated using a two-tailed Student’s t-test (BVOs: **p = 0.0068, iPS-ECs: ****p = 0.000034). β-actin was used as a normalisation control. f Transcription factor enrichment analysis for differentially expressed proteins using the ChEA3 tool. Red circles indicate putative binding partners of YAP. g YAP reporter activity in HEK293T cells cultured as indicated for 24 h. rCTGF: recombinant CTGF. Data from three independent transfections in quadruplicates are shown as mean ± SD using two-way ANOVA followed by Tukey’s multiple comparisons tests. (CTR vs. PFK15 ****p = <0.000000000000001; CTR vs. PFK15 +rCTGF ****p = 0.000000002; CTR vs. rCTGF ****p = 0.000000013; PFK15 vs. PFK15+rCTGF **p = 0.0057; PFK15 vs. rCTGF **p = 0.0010). YAP subcellular localisation in iPS-EC after 3 h treatment with PFK15 as detected using (h) immunofluorescence confocal microscopy. N nucleus, C cytosol. n = 400 cells per group. Data are shown as mean ± SD using two-way ANOVA followed by Tukey’s multiple comparisons tests. (N > C: CTR vs. PFK15 ****p = 0.000000138; CTR vs. PFK15 +rCTGF ****p = 0.000064; CTR vs. rCTGF ****p = 0.000020; N = C: **p = 0.0030; ***p = 0.0001; ****p = 0.000000216) and (i) western blot analysis. Nucl nucleus, Cyto cytosol. Histone 3 expression (H-H3) was a normalisation control for the nuclear fraction. Loading control: Ponceau staining. Two independent experiments were performed. Source data are provided as a Source Data file.
Fig. 8
Fig. 8. CTGF can restore vascular integrity.
a Phenotypic characterisation of tight junction morphology in iPS-ECs treated as indicated for 3 h using immunofluorescence confocal imaging. Lower panel, quantification of straight, thick and fingers junctions. n = 250 cells per group. Median values are shown in each boxplot. All boxes include the median line, and the box denotes the interquartile range (IQR). Whiskers denote the rest of the data distribution and spread from minimum to maximum. All p values were calculated using a using a two-way ANOVA followed by Tukey’s multiple comparisons tests. (Thick: CTR vs. PFK15 ****p < 0.000000000000001; PFK15 vs. PFK15+rCTGF ****p = 0.000000016; PFK15 vs. rCTGF ****p = 0.000000000017 Fingers: CTR vs. PFK15 ****p < 0.000000000000001; CTR vs. PFK15+rCTGF ****p = 0.000002; CTR vs. rCTGF **p = 0.0035; PFK15 vs. PFK15+rCTGF **p = 0.0043; PFK15 vs. rCTGF ****p = 0.000000781). b Immunofluorescence confocal imaging showing CD31+ ECs (green) in vascular networks covered by pericytes (PDGFRβ+, magenta) in sections from BVOs treated with DMSO (CTR) or PFK15 (2.5 µM) and PFK15 (2.5 µM) + rCTGF(50 ng/ml) for 24 h. White arrows indicate pericytes attached to microvessels, magenta arrows indicate extravascular mural cells. c Pericyte coverage in n = 6 BVOs per group from three separate preparations. One-two sections per BVO were assessed. d Quantification of vessel density and (e) length in n = 6 BVOs per group from three separate preparations and 4 different areas per 10x images have been used. One-two sections per BVO were assessed. Data are shown as mean ± SD using two-way ANOVA followed by Tukey’s multiple comparisons tests. (c: ****p = 0.000061; **p = 0.0058; d: *p = 0.0150 **p = 0.0097; e: **p = 0.0019 ***p = 0.0008). ns not significant. Bar scales 100 μm. Source data are provided as a Source Data file.

References

    1. Taqueti VR, Di Carli MF. Coronary microvascular disease pathogenic mechanisms and therapeutic options: JACC state-of-the-art review. J. Am. Coll. Cardiol. 2018;72:2625–2641. - PMC - PubMed
    1. Warmke N, Griffin KJ, Cubbon RM. Pericytes in diabetes-associated vascular disease. J. Diabetes Complications. 2016;30:1643–1650. - PubMed
    1. Camici PG, Tschope C, Di Carli MF, Rimoldi O, Van Linthout S. Coronary microvascular dysfunction in hypertrophy and heart failure. Cardiovasc. Res. 2020;116:806–816. - PubMed
    1. Hammes HP, et al. Pericytes and the pathogenesis of diabetic retinopathy. Diabetes. 2002;51:3107–3112. - PubMed
    1. Kaze AD, et al. Microvascular disease and incident heart failure among individuals with type 2 diabetes mellitus. J. Am. Heart Assoc. 2021;10:e018998. - PMC - PubMed

Publication types

Substances

LinkOut - more resources