Review
. 2023 Sep 9;14(1):5569.
doi: 10.1038/s41467-023-41368-6.

Scaling the tail beat frequency and swimming speed in underwater undulatory swimming

Affiliations
Review

Scaling the tail beat frequency and swimming speed in underwater undulatory swimming

Jesús Sánchez-Rodríguez et al. Nat Commun. .

Abstract

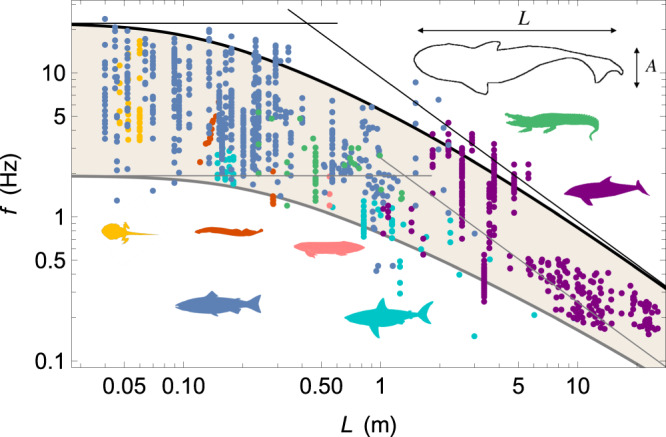
Undulatory swimming is the predominant form of locomotion in aquatic vertebrates. A myriad of animals of different species and sizes oscillate their bodies to propel themselves in aquatic environments with swimming speed scaling as the product of the animal length by the oscillation frequency. Although frequency tuning is the primary means by which a swimmer selects its speed, there is no consensus on the mechanisms involved. In this article, we propose scaling laws for undulatory swimmers that relate oscillation frequency to length by taking into account both the biological characteristics of the muscles and the interaction of the moving swimmer with its environment. Results are supported by an extensive literature review including approximately 1200 individuals of different species, sizes and swimming environments. We highlight a crossover in size around 0.5-1 m. Below this value, the frequency can be tuned between 2-20 Hz due to biological constraints and the interplay between slow and fast muscles. Above this value, the fluid-swimmer interaction must be taken into account and the frequency is inversely proportional to the length of the animal. This approach predicts a maximum swimming speed around 5-10 m.s-1 for large swimmers, consistent with the threshold to prevent bubble cavitation.


Conflict of interest statement

The authors declare no competing interests.

Figures

Fig. 1
Fig. 1. Model predictions and observations of frequency-length.
Tail beat frequency f as a function of length L for agnathans (red), cartilaginous fishes (cyan), ray-finned fishes (blue), lobe-finned fishes (pink), amphibians (yellow), reptiles (green), and mammals (purple). Thick black and grey lines represent the burst and sustained activity levels, respectively, fitted with the model. Thin lines are the scaling laws in the limits of very small and very large swimmers. Values of the parameters for the fast bound are Lcfast=(0.4±0.2) m, f0fast=(22±3) Hz, κfast=(4±4), while for the slow bound we find [Lc]slow=(1.3±0.6) m, [f0]slow=(1.9±0.2) Hz, [κ]slow = (14 ± 13). The alabaster area represents the frequency band used by the swimmers.
Fig. 2
Fig. 2. Model predictions and observations of swimming velocity-length.
Swimming speed U as a function of length L (closed circles) for agnathans (red), cartilaginous fishes (cyan), ray-finned fishes (blue), lobe-finned fishes (pink), amphibians (yellow), reptiles (green), and mammals (purple). Brown squares correspond to the data gathered by Hirt et al. for maximum swimming speeds using the mass-length relationship (see Methods). Open translucent squares represent either non-peer reviewed papers or data coming from estimations and not actual measurements. Open opaque squares represent data obtained using rod-mounted devices. The other data are represented by closed opaque squares. The black and gray thick lines represent the fast and slow bounds, respectively, as predicted by the model together with the parameters used to fit the frequency measurements in Fig. 1. Thin lines are the scaling laws in the limit of very small and very large swimmers. The alabaster area represents the speed band used by the swimmers.
Fig. 3
Fig. 3. Specific power-length graph.
Specific muscle power PM as a function of length, as estimated from the model. The curve is drawn with κ = 1 and is represented in its dimensionless form.
Fig. 4
Fig. 4. Allometric plots.
a Representation of the swimmers used in the dataset in the vertebrate Phylogenetic tree. The red disks correspond to species whose swimming kinematics have been measured and used in our dataset. b Animal mass and c tail beat amplitude as functions of animal length. The solid lines represent the best power-law fits of the data. d Swimming speed as a function of the product of length and tail beat frequency. The solid line represents the best power-law fitting the data.
Fig. 5
Fig. 5. Hill’s muscle model.
Muscle force as a function of tail beat frequency. The curve is drawn with κ = 1 and is represented in its dimensionless form.
Fig. 6
Fig. 6. Water temperature and thermoregulation.
a Tail beat frequency f as a function of length L with coloring indicating the type of thermoregulation. The ectothermics, endothermics and heterothermics animals are shown in blue, red and orange, respectively. b Tail beat frequency f as a function of length L with coloring indicating water temperature.

References

    1. Lauder GV, Tytell ED. Hydrodynamics of undulatory propulsion. Fish. Physiol. 2005;23:425–468.
    1. Sfakiotakis M, Lane DM, Davies JBC. Review of fish swimming modes for aquatic locomotion. IEEE J. Ocean. Eng. 1999;24:237–252.
    1. Videler, J.J. Fish swimming. Springer10.1007/978-94-011-1580-3 (1993).
    1. Di Santo V, et al. Convergence of undulatory swimming kinematics across a diversity of fishes. Proc. Natl Acad. Sci. 2021;118:2113206118. - PMC - PubMed
    1. Bainbridge R. The speed of swimming of fish as related to size and to the frequency and amplitude of the tail beat. J. Exp. Biol. 1958;35:109–133.

Publication types