. 2023 Sep 9;13(1):14890.
doi: 10.1038/s41598-023-41995-5.

ERG K+ channels mediate a major component of action potential repolarization in lymphatic muscle

Affiliations

ERG K+ channels mediate a major component of action potential repolarization in lymphatic muscle

Hae Jin Kim et al. Sci Rep. .

Abstract

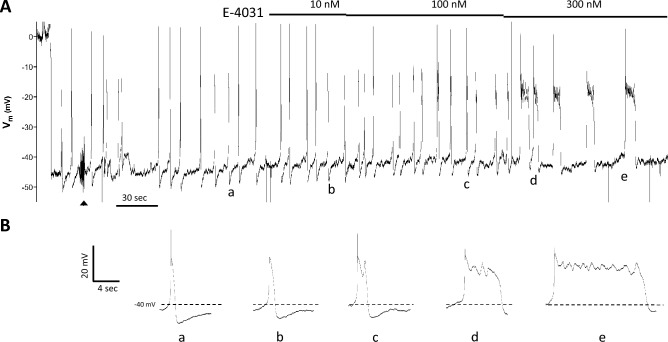
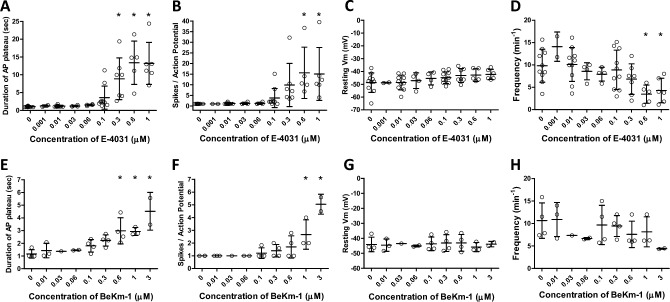
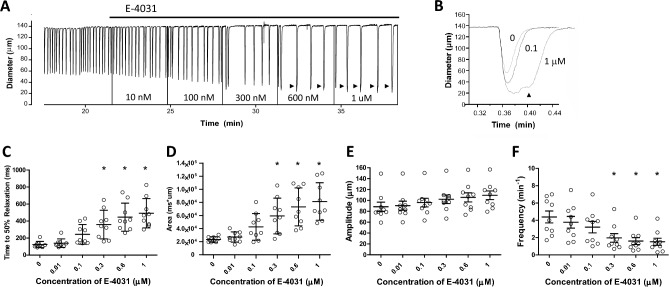
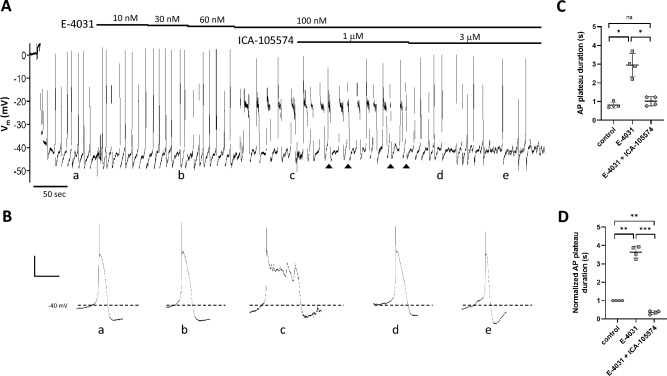
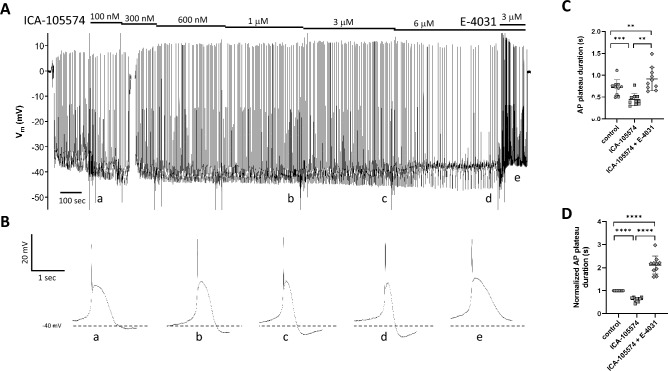
Smooth muscle cells in the walls of collecting lymphatic vessels fire spontaneous action potentials (APs), which conduct rapidly over the muscle layer to initiate contractions that propel lymph. Several ion channels have been implicated in the currents underlying the AP spike and the preceding diastolic depolarization, but the molecular identities of K+ channels involved in AP repolarization are unknown. Based on previous studies of other rhythmically active smooth muscles, we hypothesized that ether-a-go-go related gene (ERG) K+ channels (Kv11) play an important role in repolarization of the AP in lymphatic muscle. Message for one or more ERG channel isoforms was detected by RT-PCR analysis of lymphatic vessels from mice, rats and humans. Membrane potential recordings in smooth muscle cells of rat and human lymphatics revealed that nanomolar concentrations of ERG-1 inhibitors (E-4031 and BeKm-1) prolonged the duration of the AP plateau (normally ~ 1 s in duration) and induced multiple spikes, whereas ERG-1 activators (ICA-105574 and RPR-260243) shortened the plateau and could completely inhibit spontaneous APs. At relatively high inhibitor concentrations, the AP plateau duration lasted as long as 24 s. ERG activators reversed the effects of ERG inhibitors and vice-versa. In pressure myograph studies, ERG channel inhibition prolonged the diastolic repolarization phase of the contraction cycle and reduced the frequency of spontaneous contractions. This is the first evidence for a specific K+ channel contributing to the AP in lymphatic muscle. Our results imply that lymphatic contractile dysfunction may occur in long QT type II patients with mutations that result in ERG channel loss-of-function or impaired trafficking of the channel to the cell membrane.


Conflict of interest statement

The authors declare no competing interests.

Figures

Figure 1
Figure 1
RT-PCR analysis of ERG channel message in human, rat and mouse lymphatic vessels. (A) Human ERG1 = 131 bp, ERG2 = 150 bp, ERG3 = 123, 145 bp detected in samples of intestinal wall (for reference) or isolated mesenteric lymphatic vessels. (B) Rat Erg1 = 131 bp, Erg2 = 124 bp, Erg3 = 129,153 bp detected in brain (for reference) or isolated mesenteric lymphatic vessels. (C) Mouse Erg1 = 263 bp, Erg1a = 303 bp, Erg1b = 219 bp, Erg2 = 194 bp, Erg3 = 267 bp detected in brain (for reference) or isolated inguinal-axillary lymphatic vessels. (D) Mouse Erg1 = 263 bp, Erg1a = 303 bp, Erg1b = 219 bp, Erg2 = 194 bp, Erg3 = 267 bp detected in FACS-purified (GFP +) LMCs from isolated inguinal-axillary lymphatic vessels of Myh11CreERT2; Rosa26mTmG mice. Each gel is representative of 3 separate samples. All images were obtained using Image Lab™ Software Version 3.0 from BIO-RAD.
Figure 2
Figure 2
Vm recordings from the LMC layer of a rat pressurized mesenteric lymphatic vessel in response to the ERG1 inhibitor E-4031. (A) After the initial impalement, Vm dropped rapidly from 0 to − 46 mV and spontaneous APs fired with spikes (in most cases) to + 2 mV. Adjustment of the electrode position and resistance test (at arrowhead) during the first 90 s of recording caused a transient increase in AP frequency that subsequently stabilized. After that time, E-4031 was applied in cumulative doses at the indicated times and concentrations. (B) Expanded time scale shows the shape of individual APs (a–e) at the corresponding times marked (a–e) in (A).
Figure 3
Figure 3
Summary data showing the effects of the ERG1 inhibitors E-4031 and BeKm-1 on various components of the AP in LMCs of rat mesenteric lymphatics. (A) The duration of the AP (defined as the time from the peak of the spike to the point at which Vm repolarized to its initial threshold level) increased with increasing concentration of E-4031; IC50 = 0.24 μM. (B) The number of “spikes” per AP (defined as fluctuations > 3 mV during the plateau phase) also increased with increasing concentration of E-4031; IC50 = 0.25 μM. (C) There was a trend for resting Vm to depolarize with increasing concentrations of E-4031, reaching ~ 6 mV at 1 μM, but this effect was not statistically significant. (D) AP frequency decreased as the concentration of E-4031 increased, with significance reached at the two highest concentrations. (E–H) Summary effects of BeKM-1 on the duration of the AP plateau (E; IC50 = 0.92 μM), the number of spikes per AP (F; IC50 = 1.3 μM), resting Vm (G) and frequency (H). *Significantly different from control value using a one-way ANOVA with Dunnett’s post-hoc tests, p < 0.05. Error bars are ± SD. N = 5, n = 10.
Figure 4
Figure 4
Effects of E-4031 on contractions of rat pressurized mesenteric lymphatics. (A) E-4031 increased the amplitude and decreased the frequency of spontaneous contractions. Vertical lines (to Diam = 0) reflect transient blanking of the light path to mark addition and mixing of each concentration E-4031. (B) E-4031 prolonged the diastolic relaxation phase of the contraction cycle and higher concentrations were often associated with double contractions (also marked arrowheads in A), which were extremely rare under normal conditions in rat mesenteric lymphatics. (C–F) Summary of E-4031 effects on time to 50% relaxation (C), area under the diameter vs. time curve (D), contraction amplitude (E) and frequency (F). *Significantly different from control value using ANOVA with Dunnett’s post-hoc tests, p < 0.05. Error bars are ± SD. N = 4, n = 9.
Figure 5
Figure 5
Representative Vm recording from the LMC layer of a rat pressurized mesenteric lymphatic showing the effects of ICA-105574. (A) The entire recording, showing the initial impalement, the cumulative effects of five concentrations of ICA-105574, the slowing of frequency at 1 μM ICA-105574, the eventual cessation of spontaneous APs at 3 μM ICA-105574 and the return to 0 mV when the electrode is pulled out of the cell. (B) Expanded time scales show how the duration of the plateau phase of the AP is shortened with increasing concentrations of ICA-105574. Individual APs marked (a–d) correspond to the times marked (a–d) in panel (A).
Figure 6
Figure 6
Summary of effects of the ERG channel activators ICA-105574 and RPR-260243 on Vm of rat pressurized mesenteric lymphatics. (A,B) ICA-105574 decreases the duration of the AP plateau phase, and the effect is equally significant if the duration is normalized to the initial control value (B). ICA-105574 does not significantly alter the resting Vm (C), or frequency (D), although there is a trend for frequency to decrease. RPR-260243, another ERG channel activator that works through a different mechanism of action, produces a similar effect on the plateau duration (E,F) but requires higher concentrations to reach significance. RPR does not significantly affect the resting Vm (G) or frequency (H), although there is a trend for frequency to decrease. *Significantly different from control value using a one-way ANOVA with Dunnett’s post-hoc tests, p < 0.05. Error bars are ± SD. N = 5, n = 9.
Figure 7
Figure 7
ICA-105574 reverses the effects of E-4031. (A) After impalement and Vm stabilization, bath application of E-4031 leads to progressive widening of the AP plateau such that at time point (c) there are multiple secondary “spikes”. The subsequent addition of 1 μM ICA-105574 in the continued presence of E-4031 leads to the narrowing of some (arrowheads) but not all APs, whereas 3 mM ICA-105574 consistently reduces plateau duration (e) to values lower than control (a). (B) Expanded time scales show how the duration of the plateau phase of the AP is altered first by the addition of E-4031 and then subsequent addition of ICA-105574. Individual APs marked (a–e) correspond to the times marked (a–e) in (A). Calibration bar: 10 mV·2 s−1 for all traces except (c) where it is 10 mV·5.8 s−1. (C,D) Summary data for 4 vessels from 2 animals, using either the raw (C) or normalized (D, to control) data for AP plateau duration. The concentration of E-4031 was 100 nM; the concentration of ICA-105574 was 3 μM. Error bars are ± SD. Significance determined using a one-way ANOVA with Tukey’s multiple comparison tests. *Indicates p < 0.05; **indicates p < 0.01; ***indicates p < 0.001; ns = not significant at p < 0.05.
Figure 8
Figure 8
E-4031 reverses the effects of ICA-105574. (A) After impalement and Vm stabilization, bath application of increasing concentrations of ICA-105574 leads to progressive narrowing of the AP plateau with eventual slowing of frequency. The subsequent application of E-4031 (3 μM) increases the frequency and results in widening of the AP plateau to a value slightly wider than control. (B) Expanded time scales show how the plateau phase of the AP changes first in response to ICA-105574 and then to ICA-105574 + 3 μM E-4031. Individual APs marked (a–e) correspond to the times marked (a–e) in (A). Note: for the “control” AP, an early recording in 100 nM ICA-105574 was selected because Vm had not completely stabilized before the first application of ICA-105574. Recording is representative of 3 similar experiments. Summary data for 10 vessels from 7 animals, using either the raw (C) or normalized (D, to control) data for AP plateau duration. Error bars are ± SD. Significance determined using a one-way ANOVA with Tukey’s multiple comparison tests. **Indicates p < 0.01; ***indicates p < 0.001; ****indicates p < 0.0001.

References

    1. Scallan JP, Zawieja SD, Castorena-Gonzalez JA, Davis MJ. Lymphatic pumping: Mechanics, mechanisms and malfunction. J. Physiol. 2016;594:5749–5768. doi: 10.1113/JP272088. - DOI - PMC - PubMed
    1. Davis MJ, et al. Intrinsic increase in lymphatic muscle contractility in response to elevated afterload. Am. J. Physiol. (Heart Circ. Physiol.) 2012;303:H795–H808. doi: 10.1152/ajpheart.01097.2011. - DOI - PMC - PubMed
    1. Olszewski WL, Engeset A. Intrinsic contractility of prenodal lymph vessels and lymph flow in human leg. Am. J. Physiol. 1980;239:H775–783. - PubMed
    1. Engeset A, Olszewski W, Jaeger PM, Sokolowski J, Theodorsen L. Twenty-four hour variation in flow and composition of leg lymph in normal men. Acta Physiol. Scand. 1977;99:140–148. doi: 10.1111/j.1748-1716.1977.tb10364.x. - DOI - PubMed
    1. Scallan JP, et al. Independent and interactive effects of preload and afterload on the lymphatic pump. Am. J. Physiol. (Heart Circ. Physiol.) 2012;303:H809–H824. doi: 10.1152/ajpheart.01098.2011. - DOI - PMC - PubMed

Publication types

LinkOut - more resources