. 2023 Sep 9;14(1):5555.
doi: 10.1038/s41467-023-40982-8.

PD-L1 positive astrocytes attenuate inflammatory functions of PD-1 positive microglia in models of autoimmune neuroinflammation

Affiliations

PD-L1 positive astrocytes attenuate inflammatory functions of PD-1 positive microglia in models of autoimmune neuroinflammation

Mathias Linnerbauer et al. Nat Commun. .

Abstract

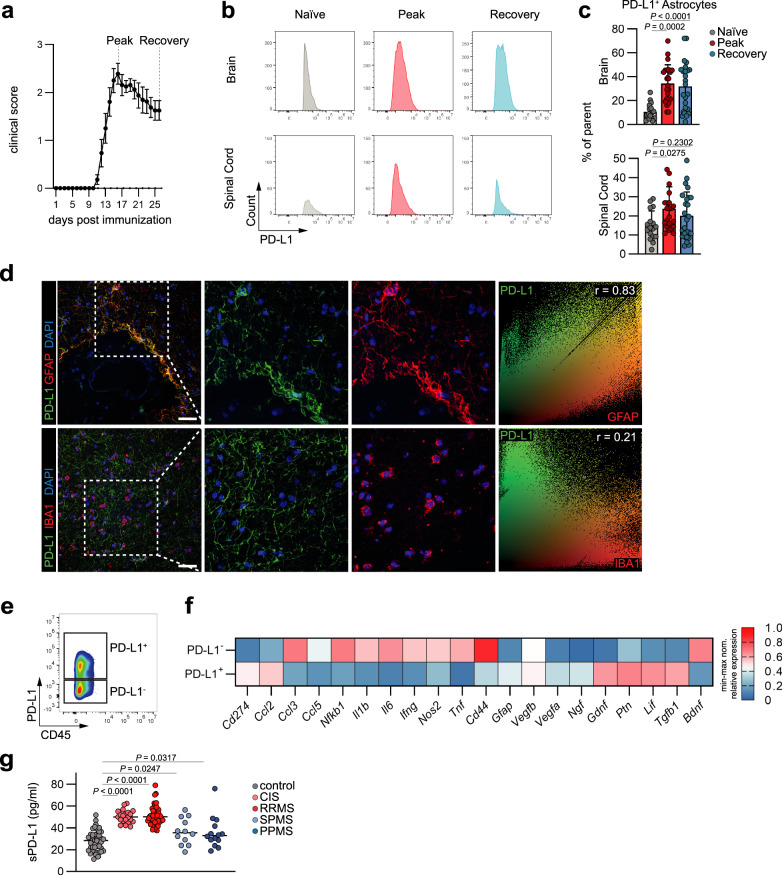
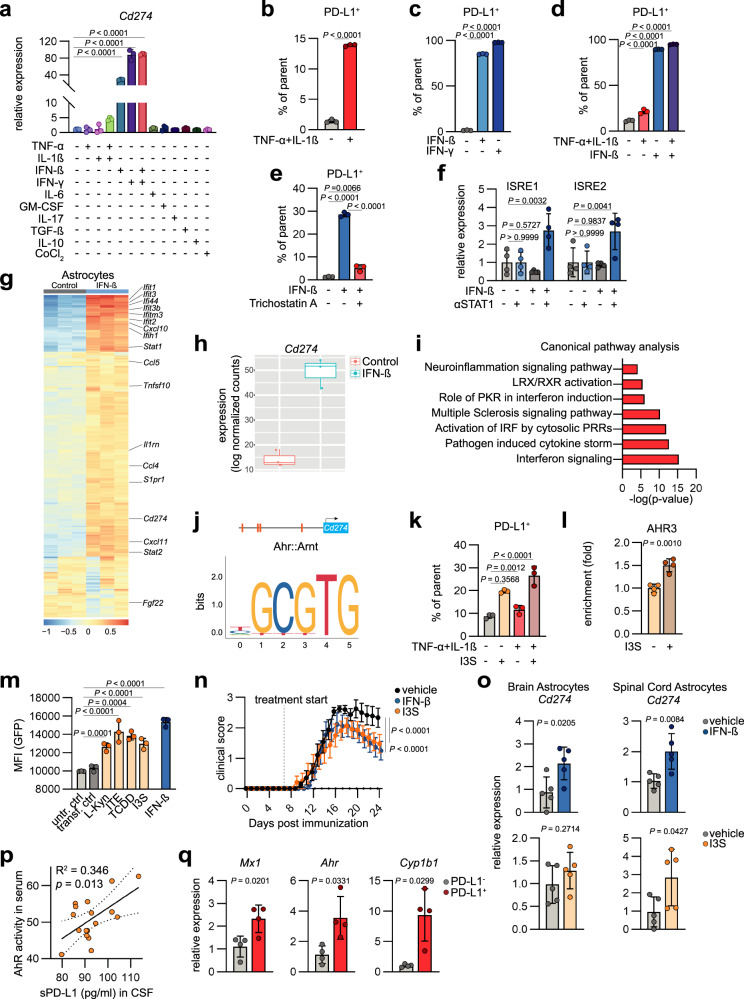
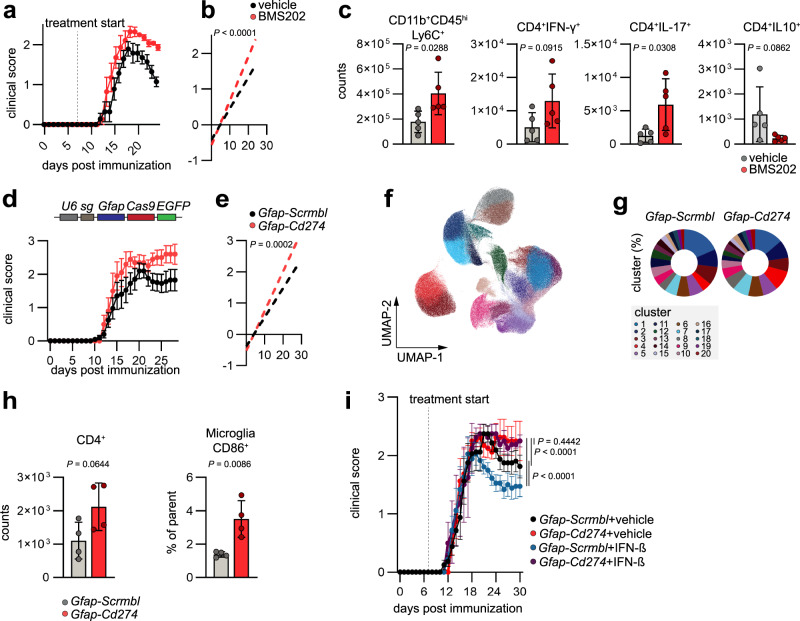
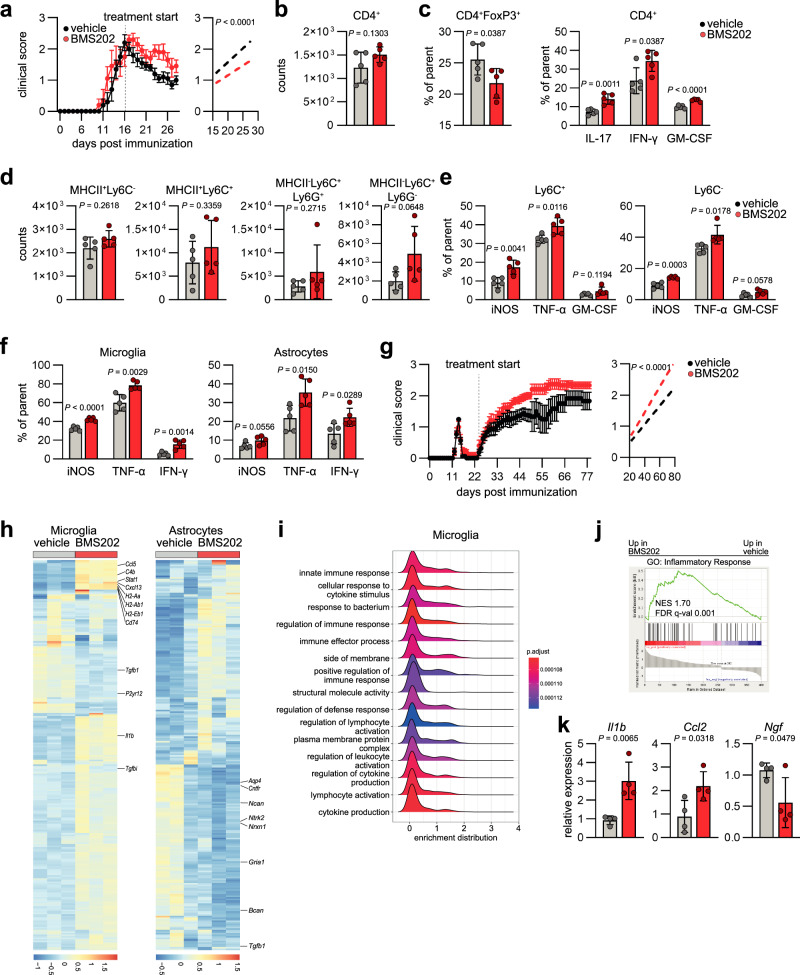
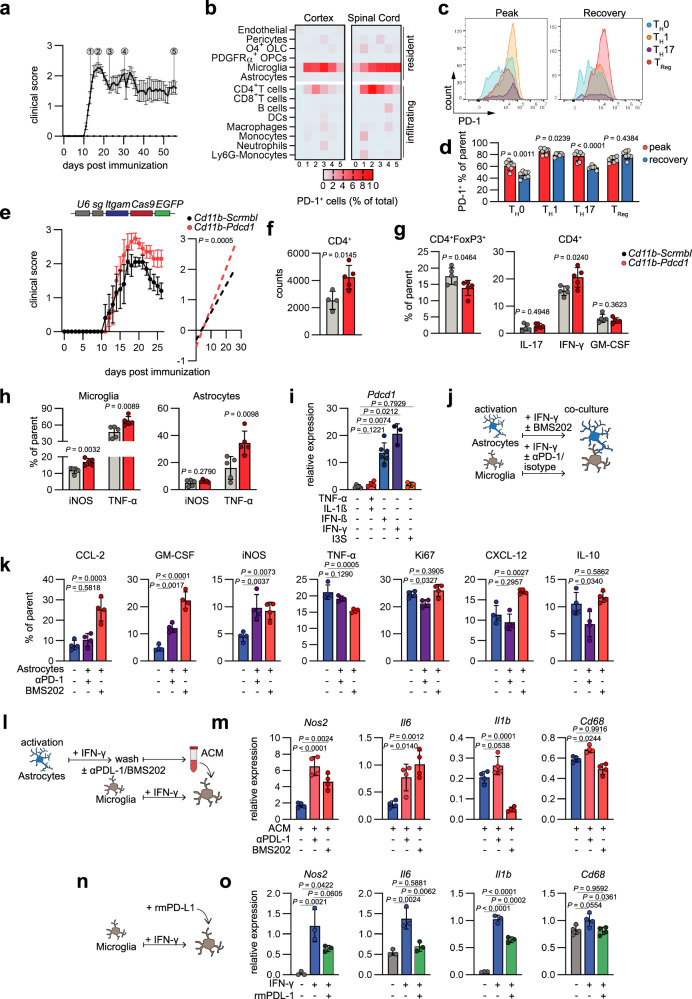
Multiple Sclerosis (MS) is a chronic autoimmune inflammatory disorder of the central nervous system (CNS). Current therapies mainly target inflammatory processes during acute stages, but effective treatments for progressive MS are limited. In this context, astrocytes have gained increasing attention as they have the capacity to drive, but also suppress tissue-degeneration. Here we show that astrocytes upregulate the immunomodulatory checkpoint molecule PD-L1 during acute autoimmune CNS inflammation in response to aryl hydrocarbon receptor and interferon signaling. Using CRISPR-Cas9 genetic perturbation in combination with small-molecule and antibody-mediated inhibition of PD-L1 and PD-1 both in vivo and in vitro, we demonstrate that astrocytic PD-L1 and its interaction with microglial PD-1 is required for the attenuation of autoimmune CNS inflammation in acute and progressive stages in a mouse model of MS. Our findings suggest the glial PD-L1/PD-1 axis as a potential therapeutic target for both acute and progressive MS stages.


Conflict of interest statement

The authors declare no competing interests.

Figures

Fig. 1
Fig. 1. Astrocytes express PD-L1 in the context of autoimmune CNS inflammation.
a Analysis of astrocytes over the course of EAE. Mice per group are n = 5 naive, n = 6 peak, n = 8 recovery. Experiment repeated three times. b Histograms depicting staining of PD-L1 on astrocytes in brain and spinal cord at the naïve, peak and recovery stage of EAE. c Relative expression (% of parent) of PD-L1 by brain and spinal cord astrocytes. n = 17 naive, n = 24 peak, n = 25 recovery. d Immunohistochemical staining of PD-L1+ astrocytes (GFAP+) and microglia (IBA1+) in active white matter lesions from MS patients. Data shown are representative of n = 12 fields from two distinct MS brains. 30 µm scale bar. Pearson’s Correlation coefficient of global PD-L1/GFAP/IBA1 overlap. e Scatter plots of PD-L1+ astrocytes at peak of EAE sorted for mRNA analysis. f Normalized relative expression of genes in PD-L1+ and PD-L1- peak EAE astrocytes. n = 3/10 PD-L1+, n = 3/10 PD-L1. g Quantification of soluble PD-L1 in cerebrospinal fluid from controls and patients with clinically isolated syndrome (CIS), relapsing-remitting MS (RRMS), secondary-progressive (SPMS), or primary-progressive MS (PPMS). n = 44 control, n = 21 CIS, n = 53 RRMS, n = 12 SPMS, n = 14 PPMS. One-way ANOVA with Dunnett’s multiple comparisons test in not otherwise indicated. Multiple unpaired t test in (f) with statistics provided in Supplementary Fig. 1d. Exact P values are provided in the figure. Data shown as mean ± SD. Data shown as mean ± SEM in (a).
Fig. 2
Fig. 2. Astrocytic PD-L1 is induced by interferon and AhR signaling.
a Relative expression of Cd274 in primary mouse astrocytes stimulated with pro- and anti-inflammatory stimuli. n = 3 per group. b Relative expression (% of parent) of PD-L1 in primary mouse astrocytes stimulated with TNF-α and IL-1β (n = 3) or vehicle (n = 3) measured by flow cytometry. Experiment repeated 3 times. c, relative expression (% of parent) of PD-L1 by primary mouse astrocytes following stimulation with IFN-β, IFN-γ, or vehicle measured by flow cytometry. n = 3 per group. d Relative expression (% of parent) of PD-L1 by human astrocytes following stimulation with TNF-α, IL-1β, and IFN-β measured by flow cytometry. n = 3 per group. e, relative expression (% of parent) of PD-L1 by primary mouse astrocytes following stimulation with IFN-β in combination with Trichostatin A or vehicle measured by flow cytometry. n = 3 per group. f ChIP-qCPR analysis of STAT1 recruitment to interferon-sensitive response elements (ISRE) in the Cd274 promoter following stimulation with IFN-β or vehicle. n = 4 per group. g RNA-Seq analysis of sorted astrocytes from B6 mice treated with vehicle or IFN-β. n = 3 per group. h Expression (log normalized counts) of sorted astrocytes from C57Bl/6 mice treated with vehicle or IFN-β. n = 3 per group. i Ingenuity Pathway Analysis (IPA) of sorted astrocytes from vehicle and IFN-β treated mice. j Predicted AhR-binding sites in the Cd274 promoter by JASPAR. k Relative expression (% of parent) of PD-L1 by primary mouse astrocytes following stimulation with TNF-α, IL-1β, I3S, or vehicle measured by flow cytometry. n = 3 per group. l ChIP-qCPR analysis of AhR recruitment to the Cd274 promoter following stimulation with I3S or vehicle, n = 4 per group. m Flow cytometric analysis of CD274 promoter activation (depicted as median fluorescent intensity; MFI) following stimulation with inducers of AhR and interferon signaling using a promoter-GFP-reporter construct. n = 3 per group. n EAE development in mice intranasally treated with vehicle, IFN-β, or I3S starting at day 7 post immunization. n = 13 vehicle, n = 11 I3S, n = 9 IFN-β. Experiment repeated twice. o RT-qPCR analysis of Cd274 expression in sorted astrocytes from brains and spinal cord tissue of mice treated with vehicle, IFN-β, or I3S throughout the course of EAE. n = 5 per group. p Linear regression analysis with 95 % confidence intervals of sPD-L1 (pg/ml) concentration in the cerebrospinal fluid (CSF) obtained from patients with clinically isolated syndrome (CIS) and their AhR activity measured by a promoter-reporter luciferase assay. n = 17. q RT-qPCR quantification of Mx1, Ahr, and Cyp1b1 expression in PD-L1+ and PD-L1-sorted astrocytes. n = 4 per group. Unpaired t test (two-tailed) in (b, l, o, q), One-way ANOVA with Dunnett’s multiple comparisons test in (cf, k, m), Area under the curve (AUC) of disease curves was used to determine statistical significance through t test with Dunnett’s multiple comparisons test in (n). Exact P values are provided in the figure. Data are shown as mean ± SD if not indicated otherwise. Data are shown as mean with the 25th and 75th percentiles in (h). Data are shown as mean ± SEM in (n).
Fig. 3
Fig. 3. PD-L1 expression by astrocytes limits autoimmune CNS inflammation.
a EAE development and regression analysis (b) of clinical scores in mice intranasally treated with vehicle or BMS202 starting at day 7 post immunization. n = 7 vehicle per group. Experiment repeated twice. c Flow cytometric quantification of inflammatory monocytes (CD11b+CD45hiLy6C+), pro-inflammatory TH1 (CD45+CD11bCD4+IFN-γ+), TH17 (CD45+CD11bCD4+IL-17+), and regulatory IL-10+CD4+ T cells in the CNS (brain and spinal cord) of vehicle or BMS202 treated mice. n = 5 per group. d EAE development and regression analysis (e) in mice transduced with Gfap-Scrmbl (n = 10) and Gfap-Cd274 (n = 5). Experiment repeated twice. f UMAP plots of CNS cells analyzed by high-dimensional flow cytometry in Gfap-Scrmbl (n = 5) and Gfap-Cd274 (n = 5) mice. g Abundance of FlowSOM clusters in the CNS of Gfap-Scrmbl (n = 5) and Gfap-Cd274 (n = 5) mice analyzed by high-dimensional flow cytometry. h Quantification of microglia (CD45intCD11b+) and CD4+ T cells (CD45+CD11b) in the CNS of Gfap-Scrmbl and Gfap-Cd274 mice analyzed by flow cytometry. n = 4 per group. i EAE progression in mice transduced with Gfap-Scrmbl and Gfap-Cd274, which were treated intranasally with vehicle or IFN-β starting at day 7 post immunization. n = 8 Gfap-Scrmbl + vehicle, n = 9 Gfap-Scrmbl + IFN-β, n = 4 Gfap-Cd274 + vehicle, n = 4 Gfap-Cd274 + IFN-β. Unpaired t test (two-tailed) in (c, h); Linear regression analysis in (b, d); Area under the curve (AUC) of disease curves was used to determine statistical significance through Tukey’s multiple comparisons test in (i). Exact P-values are provided in the figure. Data are shown as mean ± SD in (c, h). Data are shown as mean ± SEM in (a, d, i).
Fig. 4
Fig. 4. PD-L1/PD-1 signaling in chronic autoimmune CNS inflammation limits glial pathogenicity.
a EAE progression and regression analysis in B6 mice treated intranasally with vehicle or BMS202 starting at peak of disease (day 16 post immunization). n = 5 vehicle, n = 5 BMS202. b Quantification of CD4+ T cells (CD45+CD11b) in the CNS of mice treated with vehicle or BMS202 during late stages of CNS inflammation. n = 5 per group. c Relative abundance (% of parent) of regulatory T cells (CD4+FoxP3+), TH1 cells (CD45+CD11bCD4+IFN-γ+), TH17 cells (CD45+CD11bCD4+IL17+) and GM-CSF producing cells (CD45+CD11bCD4+GM-CSF+) in the CNS of mice treated with vehicle or BMS202 during late stages of CNS inflammation. n = 5 per group. d Quantification of CD45hiCD11b+MHCII+Ly6C, CD45hiCD11b+MHCII+Ly6C+, CD45hiCD11b+MHCIILy6C+Ly6G+, and CD45hiCD11b+MHCIILy6C+Ly6G in the CNS of mice treated with vehicle or BMS202 during late stages of CNS inflammation. n = 5 per group. e Relative expression (% of parent) of pro-inflammatory cytokines iNOS, TNF-α, and GM-CSF produced by Ly6C+ and Ly6C+ myeloid cells in the CNS of mice treated with vehicle or BMS202 during late stages of CNS inflammation. n = 5 per group. f Relative expression (% of parent) of pro-inflammatory cytokines iNOS, TNF-α, and IFN-γ produced by microglia and astrocytes in the CNS of mice treated with vehicle or BMS202 during late stages of CNS inflammation. n = 5 per group. g EAE progression and regression analysis of NOD/ShiLtJ mice treated with vehicle or BMS202 starting at day 23 post immunization. n = 16 vehicle, n = 16 BMS202. Experiment repeated twice. h RNA-Seq analysis of sorted microglia and astrocytes from NOD/ShiLtJ mice treated with vehicle or BMS202 starting at day 23 post immunization. n = 3 per group. i, j pathway enrichment and GSEA (h) of microglial gene expression from NOD/ShiLtJ mice treated with vehicle or BMS202. n = 3 per group. k RT-qPCR analysis of Il1b, Ccl2, and Ngf expression by sorted microglia from NOD/ShiLtJ mice treated with vehicle or BMS202. n = 4 per group. Unpaired t test (two-tailed) in (bf, k); Linear regression analysis starting day 16 p.i. in (a); Linear regression analysis starting day 23 p.i. in (g). Exact P values are provided in the figure. Data are shown as mean ± SD if not indicated otherwise. Data are shown as mean ± SEM in (a, e).
Fig. 5
Fig. 5. Astrocytic PD-L1+ attenuates pro-inflammatory signaling in microglia through PD-1.
a EAE development in B6 mice. 0 = naive, 1 = onset, 2 = peak, 3 = early recovery, 4 = late recovery, 5 = super late recovery. n = 27 b High-dimensional flow cytometric analysis of the cellular abundance in cortex and spinal cords throughout the course of EAE (a). n = 3 per timepoint and tissue. c, d Histograms of PD-1 staining and relative expression (% of parent) (d) in CD4+ T cell subsets in the CNS of EAE mice at peak and during recovery stages. n = 7 per group. e EAE development and regression analysis of mice transduced with Cd11b-Scrmbl (n = 5) and Cd11b-Pdcd1 (n = 5). f Quantification of CD4+ T cells in the CNS of mice transduced with Cd11b-Scrmbl or Cd11b-Pdcd1. n = 4 Cd11b-Scrmbl, n = 5 Cd11b-Pdcd1. g Relative abundance (% of parent) of regulatory T cells (CD4+FoxP3+), TH1 cells (CD45+CD11bCD4+IFN-γ+), TH17 cells (CD45+CD11bCD4+IL17+), and GM-CSF producing cells (CD45+CD11bCD4+GM-CSF+) in the CNS of mice transduced with Cd11b-Scrmbl or Cd11b-Pdcd1. n = 5 per group. h Relative expression (% of parent) of pro-inflammatory cytokines iNOS and TNF-α by microglia and astrocytes in the CNS of mice transduced with Cd11b-Scrmbl or Cd11b-Pdcd1. n = 5 per group. i RT-qPCR analysis of Pdcd1 expression by primary mouse microglia following stimulation with vehicle (n = 5), TNF-α + IL-1β (n = 4), IFN-β (n = 6), IFN-γ (n = 3), or I3S (n = 3). j Schematic depicting the co-culture of primary mouse microglia and astrocytes with PD-1/PD-L1 blockade. k Relative expression (% of parent) of pro- and anti-inflammatory cytokines by primary mouse microglia following stimulation with IFN-γ and blockade of PD-L1 by BMS202, PD-1 by α-PD1 or isotype control measured by intracellular flow cytometry. n = 4 per group. l Schematic depicting the stimulation of primary mouse microglia with astrocyte-conditioned medium (ACM) from primary mouse astrocytes activated with IFN-γ and PD-L1 blockade by BMS202 or α-PD-L1. m RT-qPCR analysis of Nos2, Il6, Il1b, and Cd68 by primary mouse microglia following blockade of soluble PD-L1 by BMS202 or α-PD-L1. n = 4 per group. n Schematic depicting the stimulation of primary mouse microglia with IFN-γ and recombinant mouse PD-L1 (rmPD-L1). o RT-qPCR analysis of Nos2, Il6, Il1b, and Cd68 by IFN-γ-activated primary mouse microglia following treatment with rmPD-L1. n = 3 per group. Unpaired t test (two-sided) if not indicated otherwise; Linear regression analysis in (e); One-way ANOVA with Tukey’s multiple comparisons test in (k, m, o). Exact P values are provided in the figure. Data are shown as mean ± SD in if not indicated otherwise. Data are shown as mean ± SEM in (a, e).

References

    1. Allen NJ, Lyons DA. Glia as architects of central nervous system formation and function. Science. 2018;362:181–185. doi: 10.1126/science.aat0473. - DOI - PMC - PubMed
    1. Sofroniew MV. Astrocyte barriers to neurotoxic inflammation. Nat. Rev. Neurosci. 2015;16:249–263. doi: 10.1038/nrn3898. - DOI - PMC - PubMed
    1. Chao C-C, et al. Metabolic control of astrocyte pathogenic activity via cPLA2-MAVS. Cell. 2019;179:1483.e22–1498.e22. doi: 10.1016/j.cell.2019.11.016. - DOI - PMC - PubMed
    1. Mächler P, et al. In vivo evidence for a lactate gradient from astrocytes to neurons. Cell Metab. 2016;23:94–102. doi: 10.1016/j.cmet.2015.10.010. - DOI - PubMed
    1. Alvarez JI, et al. The Hedgehog pathway promotes blood-brain barrier integrity and CNS immune quiescence. Science. 2011;334:1727–1731. doi: 10.1126/science.1206936. - DOI - PubMed

Publication types

Substances