

TIHM: An open dataset for remote healthcare monitoring in dementia
- PMID: 37689815
- PMCID: PMC10492790
- DOI: 10.1038/s41597-023-02519-y
TIHM: An open dataset for remote healthcare monitoring in dementia
Abstract
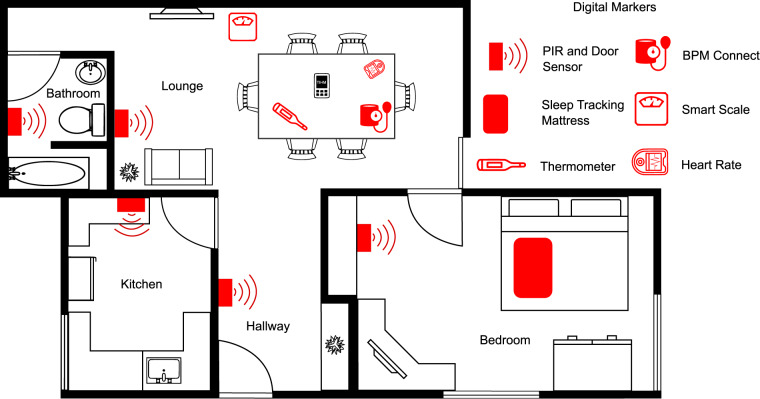
Dementia is a progressive condition that affects cognitive and functional abilities. There is a need for reliable and continuous health monitoring of People Living with Dementia (PLWD) to improve their quality of life and support their independent living. Healthcare services often focus on addressing and treating already established health conditions that affect PLWD. Managing these conditions continuously can inform better decision-making earlier for higher-quality care management for PLWD. The Technology Integrated Health Management (TIHM) project developed a new digital platform to routinely collect longitudinal, observational, and measurement data, within the home and apply machine learning and analytical models for the detection and prediction of adverse health events affecting the well-being of PLWD. This work describes the TIHM dataset collected during the second phase (i.e., feasibility study) of the TIHM project. The data was collected from homes of 56 PLWD and associated with events and clinical observations (daily activity, physiological monitoring, and labels for health-related conditions). The study recorded an average of 50 days of data per participant, totalling 2803 days.
© 2023. Springer Nature Limited.
Conflict of interest statement
The authors declare no competing interests.
Figures

References
-
- Enshaeifar S, et al. The internet of things for dementia care. IEEE Internet Computing. 2018;22:8–17. doi: 10.1109/MIC.2018.112102418. - DOI
-
- Palermo, F. et al. Designing A Clinically Applicable Deep Recurrent Model to Identify Neuropsychiatric Symptoms in People Living with Dementia Using In-Home Monitoring Data, Workshop on Bridging the Gap: From Machine Learning Research to Clinical Practice, NeurIPS, 10.48550/arXiv.2110.09868 (2021).
Publication types
MeSH terms
Grants and funding
- UKDRI-7002/Alzheimer's Research UK (ARUK)
- UKDRI-7002/Alzheimer's Research UK (ARUK)
- UKDRI-7002/Alzheimer's Research UK (ARUK)
- UKDRI-7002/Alzheimer's Research UK (ARUK)
- UKDRI-7002/Alzheimer's Research UK (ARUK)
- UKDRI-7002/Alzheimer's Research UK (ARUK)
- UKDRI-7002/Alzheimer's Research UK (ARUK)
- UKDRI-7002/Alzheimer's Society
- UKDRI-7002/Alzheimer's Society
- UKDRI-7002/Alzheimer's Society
- UKDRI-7002/Alzheimer's Society
- UKDRI-7002/Alzheimer's Society
- UKDRI-7002/Alzheimer's Society
- UKDRI-7002/Alzheimer's Society
LinkOut - more resources
Full Text Sources
Medical
