. 2023 Nov 1;31(11):3337-3354.
doi: 10.1016/j.ymthe.2023.09.003. Epub 2023 Sep 9.

Asparagine endopeptidase protects podocytes in adriamycin-induced nephropathy by regulating actin dynamics through cleaving transgelin

Affiliations

Asparagine endopeptidase protects podocytes in adriamycin-induced nephropathy by regulating actin dynamics through cleaving transgelin

Yang Qiu et al. Mol Ther. .

Abstract

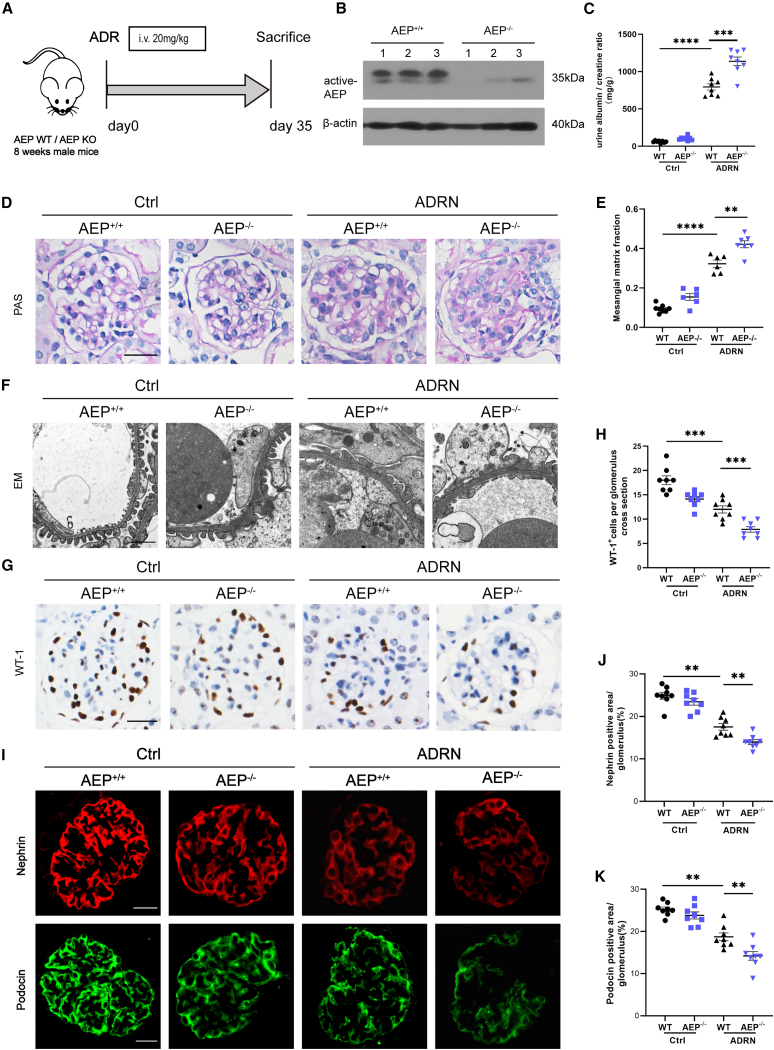
Focal segmental glomerulosclerosis (FSGS) is the most common glomerular disorder causing end-stage renal diseases worldwide. Central to the pathogenesis of FSGS is podocyte dysfunction, which is induced by diverse insults. However, the mechanism governing podocyte injury and repair remains largely unexplored. Asparagine endopeptidase (AEP), a lysosomal protease, regulates substrates by residue-specific cleavage or degradation. We identified the increased AEP expression in the primary proteinuria model which was induced by adriamycin (ADR) to mimic human FSGS. In vivo, global AEP knockout mice manifested increased injury-susceptibility of podocytes in ADR-induced nephropathy (ADRN). Podocyte-specific AEP knockout mice exhibited much more severe glomerular lesions and podocyte injury after ADR injection. In contrast, podocyte-specific augmentation of AEP in mice protected against ADRN. In vitro, knockdown and overexpression of AEP in human podocytes revealed the cytoprotection of AEP as a cytoskeleton regulator. Furthermore, transgelin, an actin-binding protein regulating actin dynamics, was cleaved by AEP, and, as a result, removed its actin-binding regulatory domain. The truncated transgelin regulated podocyte actin dynamics and repressed podocyte hypermotility, compared to the native full-length transgelin. Together, our data reveal a link between lysosomal protease AEP and podocyte cytoskeletal homeostasis, which suggests a potential therapeutic role for AEP in proteinuria disease.

Keywords: asparagine endopeptidase; cytoskeletal dynamics; focal segmental glomerulosclerosis; lysosomal protease; podocyte injury; transgelin.


Conflict of interest statement

Declaration of interests All authors declare no conflict of interest.

Figures

None
Graphical abstract
Figure 1
Figure 1
AEP was upregulated in injured podocytes (A) Relative mRNA level of AEP in the kidney from control balb/c male mice and ADR-induced FSGS balb/c male mice (n = 6). (B) Representative immunohistochemistry images of AEP in the kidney from control (Ctrl) mice and ADRN mice. Scale bar, black 20 μm. (C) Quantification of AEP positive area per glomerulus (20 glomeruli per mouse were analyzed, n = 9 mice per group). (D) Representative western blot and summarized data (E, F) of AEP and nephrin expression in the kidney cortex from Ctrl and ADR mice (n = 9 blots in total). (G) Double immunofluorescence staining of AEP (green) and synaptopodin (red) in glomeruli from Ctrl mice and ADRN mice. Scale bar, 20 μm. (H and I) Representative western blotting of AEP (n = 6 blots in total) in podocytes treated with ADR (0.2 μg/mL) and puromycin (PAN, 25 μg/mL), respectively and the quantification of pro-AEP and active AEP expression (J and K for ADR-treated podocytes; L and M for PAN-treated podocytes). n = 6 per group. ∗p < 0.05, ∗∗p < 0.01. Data are mean ± SEM.
Figure 2
Figure 2
KO of AEP exacerbated glomerular lesions in ADR-induced nephropathy (A) The schematic diagram shows the procedure of ADR-induced FSGS of AEP WT or AEP KO mice. (B) Representative western blotting (n = 6 blots in total) of AEP expression in kidney cortex lysate from AEP+/+ and AEP−/− mice (n = 6). (C) Urine albumin-to-creatinine ratio in different groups mice (n = 8). (D) Representative images for morphological examinations of glomerular changes by Periodic acid-Schiff (PAS) staining. Scale bar, 20 μm. (E) Quantification of mesangial matrix fraction of glomeruli in PAS (20 glomeruli per mouse were analyzed; n = 8 mice per group). (F) Representative transmission electron microscopy (EM) images showing morphological changes in the podocyte foot process in different groups of mice. Scale bar, 1 μm (n = 3). (G) Representative immunohistochemistry images of WT-1 in the kidney section from different groups. Scale bar, 20 μm. (H) Quantification of WT-1 positive cells per glomerulus in the kidney (20 glomeruli per mouse were analyzed, n = 8 mice per group). (I) Representative image for nephrin and podocin staining in the kidney section from different groups, Scale bar, 20 μm. (J and K) Quantification of nephrin, podocin positive area per glomerulus in the kidney sections (20 glomeruli per mouse were analyzed; n = 8 mice per group). ∗p < 0.05, ∗∗p < 0.01, ∗∗∗p < 0.001, ∗∗∗∗p < 0.0001. Data are mean ± SEM.
Figure 3
Figure 3
AEP knockdown induced podocyte cytoskeleton disarrangement and cell injury and AEP overexpression reversed ADR-induced podocyte injury (A and B) Gene silencing efficiency of AEP by Western blot in shAEP transfected podocytes (n = 6 blots in total). (C and D) Overexpression of AEP by Western blot in AdAEP transfected podocytes (n = 6 blots in total). (E and F) Representative images of F-actin by rhodamine-phalloidin staining of podocytes. Scale bar, 20 μm. Summarized data from counting the cells with distinct, longitudinal F-actin fibers was shown in (F). Scoring was determined from 100 podocytes on each slide (n = 6). (G–J) Representative western blotting (G) and summarized data (H–J) showing nephrin, podocin and desmin protein levels in podocytes transfected with scrambled shRNA or AEP shRNA (n = 6). (K and L) Representative images of F-actin by rhodamine-phalloidin staining of AdAEP podocytes. Scale bar, 20 μm. Summarized data is shown in (L) (n = 6). (M–P) Representative western blotting (M) and summarized data (N–P) showing nephrin, podocin and desmin protein levels in podocytes transfected with GFP or AEP adenovirus under ADR stimulation conditions (n = 6). ∗p < 0.05, ∗∗p < 0.01, ∗∗∗p < 0.001, ∗∗∗∗p < 0.0001. Data are mean ± SEM.
Figure 4
Figure 4
Podocyte-specific AEP deletion aggravated renal injury in ADR-induced nephropathy (A) Generation of conditional KO mice in which AEP was specifically ablated in podocytes by using Cre-LoxP recombination system. Exons 2 and 3 were deleted upon NPHS2-Cre-mediated recombination. Genotyping was confirmed by tail preparation and PCR at 3 weeks of age. (B and C) Representative Western blot (n = 6 blots in total) and quantification of AEP expression in isolated glomeruli lysate from AEP-flox/Cre- and AEP-flox/Cre+ mice. (D) Urine albumin-to-creatinine ratio in mice (n = 8). (E) Representative images of Periodic acid-Schiff (PAS) staining and electron microscopy (EM) showing glomerular morphological changes in different groups of mice. Scale bar, 20 μm in PAS, 1 μm in EM. (F) Quantification of mesangial matrix fraction of glomeruli in PAS (n = 8). (G) Representative images of nephrin, podocin, desmin, and WT-1 staining in different groups. Scale bar, 20 μm. (H) Quantification of WT1 positive cells per glomerulus in the kidney (20 glomeruli per mouse were analyzed; n = 8 mice per group). ∗p < 0.05, ∗∗p < 0.01, ∗∗∗p < 0.001. Data are mean ± SEM.
Figure 5
Figure 5
Podocyte-specific AEP overexpression ameliorated podocyte injury in ADR-induced nephropathy (A) Generation of conditional gene-edit mice in which AEP was specifically overexpressed in podocytes by using Cre–LoxP recombination system. AEP gene CDS was inserted after Rosa26 exon 1 which was in company with the stop element. The stop element was deleted upon NPHS2-Cre-mediated recombination. Genotyping was confirmed by tail preparation and PCR at 3 weeks of age. (B) Western blot and summarized data of AEP expression in glomeruli from Cre-/AEP-rosa-flox and Cre+/AEP-rosa-flox mice (n = 6). (C) Urine albumin-to-creatinine ratio in mice (n = 8). (D) Representative images of Periodic acid-Schiff (PAS) staining and electron microscopy analysis showing glomerular morphological changes in different groups of mice. Scale bar, 20 μm in the PAS, 1 μm in the EM. (E) Quantification of mesangial matrix fraction of glomeruli in PAS (n = 8). (F) Representative images of nephrin, podocin, desmin, and WT-1 staining in different groups. Scale bar, 20 μm. (G) Quantifications of WT1 per glomerulus in the kidney (20 glomeruli per mouse were analyzed; n = 8 mice per group). Scale bar, 20 μm ∗p < 0.05, ∗∗p < 0.01, ∗∗∗p < 0.001. Data are mean ± SEM.
Figure 6
Figure 6
AEP degraded transgelin (A and B) An endogenous interaction of AEP and transgelin in podocytes was confirmed by co-immunoprecipitation (co-IP), using IgG group as a negative control. (C) An endogenous interaction of AEP and transgelin in kidney lysates from AEP KO and AEP WT mice was confirmed by co-IP. (D and E) Representative western blot and quantification of transgelin in podocytes transfected with scrambled shRNA or AEP shRNA (n = 6). (F and G) Representative western blot and quantification of transgelin in podocytes transfected with AdGFP or AdAEP (n = 6). (H–K) Representative immunofluorescence images of transgelin (green) and synaptopodin (red) in glomeruli from AEP+/+ and AEP−/− mice (the first and second row), AEP-flox/cre- and AEP-flox/cre+ mice (the third and fourth row), cre-/AEP-rosa-flox and cre+/AEP-rosa-flox mice (the fifth and sixth row). Scale bar, 20 μm. The quantification data were shown in (I, J, and K) ∗p < 0.05, ∗∗p < 0.01, ∗∗∗p < 0.001. Data are mean ± SEM.
Figure 7
Figure 7
AEP cleaved transgelin at N150 site in C terminus (A) Western blot analysis of the cell lysates of 293T cells overexpressing GST-transgelin, which were incubated with kidney lysate from AEP+/+ or AEP−/− mice at pH 6.0 or pH 7.4 AEP buffer for 30 min, respectively. (B) The enzymatic activities of AEP in different groups in (A) were determined by AEP activity assay. (C) Western blot showing the cleavage of transgelin by recombined AEP at pH 6.0 and pH 7.4. The cleavage fragments were recognized by transgelin antibody and GST-tag antibody. (D) The enzymatic activity of AEP in different groups in (C) were determined using AEP activity assay. (E) Western blot showing the cleavage of transgelin by AEP WT that was abolished by mutant AEP C189S. (F) The enzymatic activity of AEP in different groups in (E) were determined using AEP activity assay. (G) Western blot showing the processing of purified GST-transgelin by recombinant AEP. The AEP-derived transgelin fragments were detected using anti-transgelin N-terminal antibody and anti-transgelin C-terminal antibody. (H) Transgelin amino acid sequence alignment among different species. ABM, actin-binding motif; CLR: C-terminal calponin-like repeat. (I) Cleavage of point mutant transgelin by AEP. The cleavage was analyzed by western blot after GST-transgelin wide-type, N150A and N141A were incubated with active recombined AEP.
Figure 8
Figure 8
Cleavage of transgelin C terminus affected podocytes cytoskeleton (A) Schematic diagram of transgelin domains and its fragments with different length. (B–F) Western blot showing the expression of desmin, podocin, cleaved caspase 3 and RhoA in podocytes with different fragments overexpression. Summarized data were shown in (C–F) (n = 3). (G–I) Representative immunofluorescence images of F-actin staining and paxillin staining and quantification of F-actin and paxillin (H and I) in podocytes transfected with different plasmids. Scare bar, 20 μm ∗p < 0.05, ∗∗p < 0.01, ∗∗∗p < 0.001. Data are mean ± SEM.

References

    1. Rosenberg A.Z., Kopp J.B. Focal Segmental Glomerulosclerosis. Clin. J. Am. Soc. Nephrol. 2017;12:502–517. doi: 10.2215/CJN.05960616. - DOI - PMC - PubMed
    1. Fogo A.B. Causes and pathogenesis of focal segmental glomerulosclerosis. Nat. Rev. Nephrol. 2015;11:76–87. doi: 10.1038/nrneph.2014.216. - DOI - PMC - PubMed
    1. Perico L., Conti S., Benigni A., Remuzzi G. Podocyte-actin dynamics in health and disease. Nat. Rev. Nephrol. 2016;12:692–710. doi: 10.1038/nrneph.2016.127. - DOI - PubMed
    1. Fu Y., Liu H.W., Forsythe S.M., Kogut P., McConville J.F., Halayko A.J., Camoretti-Mercado B., Solway J. Mutagenesis analysis of human SM22: characterization of actin binding. J. Appl. Physiol. 2000;89:1985–1990. doi: 10.1152/jappl.2000.89.5.1985. - DOI - PubMed
    1. Liu J., Zhang Y., Li Q., Wang Y. Transgelins: Cytoskeletal Associated Proteins Implicated in the Metastasis of Colorectal Cancer. Front. Cell Dev. Biol. 2020;8:573859. doi: 10.3389/fcell.2020.573859. - DOI - PMC - PubMed

Publication types

MeSH terms