. 2023 Dec;12(31):e2300987.
doi: 10.1002/adhm.202300987. Epub 2023 Sep 21.

Bioactive Suture with Added Innate Defense Functionality for the Reduction of Bacterial Infection and Inflammation

Affiliations

Bioactive Suture with Added Innate Defense Functionality for the Reduction of Bacterial Infection and Inflammation

Manoj Puthia et al. Adv Healthc Mater. 2023 Dec.

Abstract

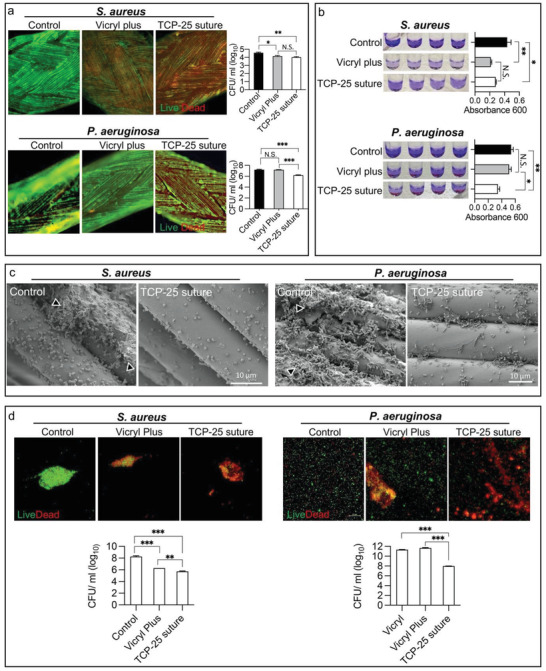
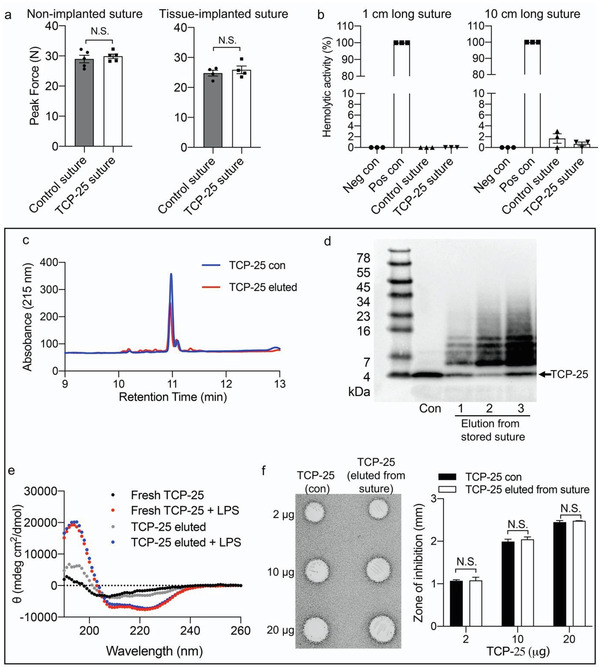
Surgical site infections (SSI) are a clinical and economic burden. Suture-associated SSI may develop when bacteria colonize the suture surface and form biofilms that are resistant to antibiotics. Thrombin-derived C-terminal peptide (TCP)-25 is a host defense peptide with a unique dual mode of action that can target both bacteria and the excessive inflammation induced by bacterial products. The peptide demonstrates therapeutic potential in preclinical in vivo wound infection models. In this study, the authors set out to explore whether TCP-25 can provide a new bioactive innate immune feature to hydrophilic polyglactin sutures (Vicryl). Using a combination of biochemical, biophysical, antibacterial, biofilm, and anti-inflammatory assays in vitro, in silico molecular modeling studies, along with experimental infection and inflammation models in mice, a proof-of-concept that TCP-25 can provide Vicryl sutures with a previously undisclosed host defense capacity, that enables targeting of bacteria, biofilms, and the accompanying inflammatory response, is shown.

Keywords: TCP-25; host defense peptides; polyglactin; surgical site infections; suture.


Conflict of interest statement

A.S. is one of the founders of in2cure AB, a company developing peptides for therapeutic applications. A patent application has been filed on materials with anti‐inflammatory and/or anti‐microbial properties.

Figures

Figure 1
Figure 1
Coating conditions, antibacterial properties, and release profile of TCP‐25 peptide‐coated polyglactin suture. Effects of coating conditions on the peptide loading and antimicrobial activity of polyglactin sutures. Sutures were coated with TCP‐25 under a) varying conditions of coating concentrations, b) coating times, and c) coating temperatures. The peptide was eluted from the coated sutures, and protein concentrations were estimated (left panels). To study effects on antimicrobial activity, elutions from sutures were used in a radial discussion assay (RDA) as shown in the right panel. The diameter of the clear zone (excluding the 4 mm well) was presented as the inhibitory effect of the released peptide (For [1a,b,c], mean values ± standard error of the mean [SEM] are presented, n = 3). d) The cumulative release of TCP‐25 from sutures in vitro. As illustrated, a Transwell insert was used to obtain conditions mimicking a surgical wound, and TCP‐25 release was estimated. e) In vivo release of TCP‐25 from suture. In SKH‐1 mice, sutures coated with tetramethylrhodamine (TAMRA)‐labeled TCP‐25 were subcutaneously placed. At 1, 6, 24, and 72 h, peptide release was longitudinally monitored by quantifying fluorescence using IVIS imaging. Heat map overlays obtained from emitted light are shown. Bar chart shows the measured radiance emitted from the region of interest (mean values are presented, n = 4). The dotted line shows the region of interest. f) Scanning electron microscopy showing the surface of the polyglactin sutures before and after the TCP‐25 coating. *P ≤ 0.05 and ***P ≤ 0.001.
Figure 2
Figure 2
QCM‐D, coarse‐grained simulation, and O‐PTIR analysis showing peptide–polyglactin interactions. a) QCM‐D monitoring of TCP‐25 binding to Vicryl fibers. Finely cut fibers were dissolved in ethanol and drop‐cast to poly‐L‐lysine‐coated SiO2 to a confluent fiber mat. Peptide binding onto fiber‐functionalized sensors was confirmed by frequency changes (ΔF) of −100 ± 27 Hz and dissipation changes (ΔD) of (+42 ± 11) × 10−6, with respect to pure MQ water. In contrast, the possible adsorption of the peptide onto the underlying poly‐L‐lysine surface was ruled out in control experiments, in which the interaction of the peptide with fiber‐free poly‐L‐lysine‐functionalized SiO2 surfaces was monitored under the same experimental conditions, showing only a minute frequency shift of −4 ± 1 Hz. Measurements were performed at room temperature (n = 3). b–e) Coarse‐grained simulations of Vicryl assembly with TCP‐25. A 1 µs CG self‐assembly simulation of 50 copies of the 100‐mer polyglactin 910 model was performed to build a Vicryl polymer model. Subsequently, ten copies of TCP‐25 were added to the system and three independent 10 µs simulations were conducted at 320 K. The figure shows initial and final snapshots from one of the simulations. Polyglactin chains are coloured cyan (lactic acid subunits), grey (glycolic acid subunits), red (carboxyl terminus), and orange (hydroxyl terminus). The TCP‐25 peptides are shown in pink (b). (Top) Minimum distance between TCP‐25 peptides and the surface of the Vicryl polymer for all three simulations. Thick lines show average over ten peptides and the shaded areas indicate standard deviation. (Bottom) Solvent accessible surface area (SASA) of the Vicryl polymer comparing simulation with (red) and without (black) TCP‐25. Thick lines show average over three repeat simulations and shaded areas indicate standard deviation. Probe radius used for SASA calculation is 0.26 nm (c). (Top) The average percentage of contacts made by each subunit of polyglactin with the peptide at three time points during the simulations. COO, carboxyl terminus; G1 to G9, glycolide subunits; L6, lactide subunit; and G10‐OH, glycolide with hydroxyl terminus. (Bottom) The same analysis performed for each residue of the peptide. Distance cut‐off used for contact measurement was 0.6 nm (d). (Top) An enlarged snapshot showing entanglement of the TCP‐25 peptide with the polyglactin polymer from the end of one simulation. (Bottom) SASA of the peptides throughout the simulations, averaged over ten peptides and three simulations (e). f) Normalized O‐PTIR spectra acquired at 2 cm−1 spectral data point spacing with five averages from uncoated (control), TCP‐25 coated, and washed TCP‐25 coated sutures. Dashed line shows the band position characteristic for TCP‐25 coated sutures at 1656 cm−1. g) O‐PTIR ratio maps were derived from the images acquired at 1656 cm−1 (ratio map nominator) and divided by the images acquired at 1760 cm−1 (ratio map denominator). The yellow color shows the distribution of TCP‐25 on the suture surface.
Figure 3
Figure 3
Structural analysis of TCP‐25 eluted from coated sutures. a) High‐performance liquid chromatography (HPLC) analysis of fresh TCP‐25 or TCP‐25 eluted from coated sutures. b) Circular dichroism (CD) spectra of TCP‐25 from coated sutures either alone or after incubation with LPS (left panel). The α‐helical content of TCP‐25 estimated from molar ellipsometry at 222 nm (right panel) is displayed. Data are presented as the mean ± SEM (n = 3). P values were determined using an unpaired t‐test. c) Intrinsic fluorescence spectra of 10 µm TCP‐25 from the coated sutures, showing shifts in the emission maximum of the peptides after incubation with varying concentrations of LPS (left panel). d) Fitting of the TCP‐25′s emission maximum wavelength (Δmax) in function of varying concentrations of LPS. Data are represented as the mean ± SEM (n = 3). *P ≤ 0.05.
Figure 4
Figure 4
In vitro and in vivo antibacterial effects of TCP‐25 suture. a) Bioluminescent S. aureus or P. aeruginosa bacteria were incubated with TCP‐25‐coated or control suture and imaged using IVIS. Representative photos are shown (n = 3). b) Bioluminescence emitted from bacteria after treatment with TCP‐25 sutures. Bioluminescent versions of S. aureus or P. aeruginosa were incubated with TCP‐25 sutures. Signals from bacteria were acquired using a luminometer. Data are presented as the mean ± SEM (n = 3). P values were calculated using a two‐way analysis of variance (ANOVA) and Tukey's post hoc test. c) Representative images showing results from Bacterial live–dead assay. Staining was performed using a LIVE/DEAD Baclight bacterial viability kit and imaged using fluorescence microscopy. The green color showed live bacteria whereas the red color showed dead bacteria (n = 3). d) Scanning electron microscopy (SEM) images showing the bacterial morphology after contact with TCP‐25 sutures. e) In vivo infection imaging showing anti‐bacterial properties of TCP‐25 sutures in a mouse model of suture infection. Uncoated control sutures or TCP‐25 sutures were subcutaneously implanted on the left or right side, respectively and contaminated with bioluminescent S. aureus. Bacterial bioluminescence was non‐invasively imaged using the IVIS imaging system. f) The line chart shows the bacterial bioluminescence emission at 1, 6, 24, 48, and 72 h post‐infection. Data are shown as the mean ± SEM (n = 5). P values were calculated using a two‐way ANOVA with Sidak's test. g) Bar‐chart shows bacterial counts in the tissue surrounding control or TCP‐25 sutures. After suture implantation and contamination with S. aureus, mice were sacrificed at 72 h and tissue adjacent to the suture was collected for CFU enumeration using viable count assay. Data are shown as the mean ± SEM (n = 5 mice per group). P values were calculated using unpaired t‐tests. h) In vivo infection and drug imaging by IVIS in mice. To image in vivo drug localization along with bioluminescent bacterial imaging, sutures were coated with fluorescently labeled TCP‐25. Representative photos display bioluminescence (lum) and TCP‐25 TAMRA fluorescence (flu) 6 h post‐suture implantation (n = 5). *P ≤ 0.05; **P ≤ 0.01; and ***P ≤ 0.001.
Figure 5
Figure 5
In vitro and in vivo effects of TCP‐25 sutures on endotoxin‐induced inflammation. a) NF‐κB and AP‐1 activation analysis by quantifying secreted alkaline phosphatase in THP1‐Xblue‐CD14 cells (upper bar chart). Cell viability was determined with the MTT assay (lower bar chart). Lysed cells were included as positive control. Data are shown as the mean ± SEM (n = 3). P values were calculated using one‐way ANOVA. b) Longitudinal imaging of inflammation in NF‐κB reporter mice. TCP‐25 or control sutures were implanted on the left or right side, respectively and contaminated with LPS. An IVIS Spectrum system was used for in vivo bioimaging of NF‐κB reporter gene expression. Representative heat‐map overlay photos show bioluminescent signals at 3 and 24 h after implantation. Bar charts show analysis of the emissions from the NF‐κB reporter mice. Data are shown as the mean ± SEM (n = 5). P values were determined using unpaired t‐tests. c) TNF‐α and IL‐6 cytokine levels in fluid extracted from implanted sutures after 24 h of implantation. Data are shown as the mean ± SEM (n = 5 mice per group). P values were calculated by unpaired t‐tests. *P ≤ 0.05, **P ≤ 0.01, ***P ≤ 0.001, and ***P ≤ 0.001. NS: non‐significant.
Figure 6
Figure 6
Antibiofilm effects of TCP‐25‐coated suture. a) Representative fluorescence microscopy images after live/dead staining showing S. aureus or P. aeruginosa biofilm adhered to the suture surface (green, live bacteria; red, dead bacteria). TCP‐25‐coated or control sutures were added to the wells of the biofilm microtiter plate, and biofilms were allowed to grow for 48 h. Sutures were stained using LIVE/DEAD Baclight bacterial viability kit and imaged using fluorescence microscopy. Vicryl Plus was used as a benchmark comparison. The bar chart shows the total number of live bacteria on suture‐adhered biofilms estimated using a viable count analysis. Data are shown as the mean ± SEM (n = 3). P values were analyzed using a one‐way ANOVA. b) Crystal violet staining showing measurement of biofilm mass. Vicryl Plus was used as a benchmark comparison. Data are shown as the mean ± SEM (n = 3). P values were determined using a one‐way ANOVA. c) Scanning electron microscopy of S. aureus or P. aeruginosa biofilm grown on TCP‐25‐coated or control sutures. Representative SEM images showing the suture surface. Arrowhead shows bacterial biofilms formed on the suture surface. d) Bacterial LIVE/DEAD analysis showing the antibiofilm effects of the TCP‐25‐coated sutures. S. aureus and P. aeruginosa mature biofilms were treated with TCP‐25‐coated or control sutures. Staining was performed using LIVE/DEAD Baclight bacterial viability kit and followed by fluorescence microscopy. The green color shows live bacteria whereas the red color shows dead bacteria. Representative images are shown (n = 3). Vicryl Plus was used as a benchmark comparison. *P ≤ 0.05, **P ≤ 0.01, and ***P ≤ 0.001. NS: non‐significant.
Figure 7
Figure 7
Human neutrophil elastase‐induced TCP‐25 fragmentation in TCP‐25 sutures. a) Peptide fragmentation pattern of TCP‐25 after treatment of TCP‐25 suture with human neutrophil elastase. TCP‐25 suture was incubated with human neutrophil elastase and analyzed by nano LC‐MS/MS. The figure shows the sequences of main peptides and the quantity of successful identifications by mass spectrometry at 0, 30, and 180 min (n = 2). b) Illustration of main peptides obtained after human neutrophil elastase digestion of TCP‐25 from coated sutures. *These peptides have been reported to show antibacterial effects. c) Antibacterial activity of peptide fragment products obtained after treatment of TCP‐25 suture with human neutrophil elastase was analyzed by evaluating the antibacterial activity against E. coli by RDA. The bar chart shows quantification of the clear zone. Data are shown as the mean ± SEM (n = 3). d) The anti‐inflammatory activity of peptide fragment products obtained after treatment of TCP‐25 suture with human neutrophil elastase. NF‐κB and AP‐1 activation was evaluated in THP1‐Xblue‐CD14 reporter cells. Data are shown as the mean ± SEM (n = 3). ***P ≤ 0.001. NS: non‐significant.
Figure 8
Figure 8
Determination of the tensile strength, hemolytic activity, and effects upon long‐term storage of TCP‐25 sutures. a) Effect of TCP‐25 coating on the tensile strength of the sutures. The tensile strengths of freshly coated non‐implanted (left panel) or tissue‐implanted (right panel) sutures were measured. To study the effect of TCP‐25 coating on the tensile strength in vivo, sutures were subcutaneously implanted in mice for 4 days. Data are shown as the mean ± SEM (n = 5). A Mann–Whitney U test was used to calculate P values. b) Hemolytic activity of control and TCP‐25‐coated sutures. A hemolysis assay was performed using human blood. The left bar chart shows the hemolytic activity of 1 cm long sutures, and the right bar chart shows the hemolytic activity of 10 cm long sutures (mean values ± SEM are presented, n = 3). NS: non‐significant. c) HPLC analysis of control (fresh TCP‐25) or TCP‐25 eluted from coated sutures after long‐term storage. TCP‐25 sutures were stored at room temperature for 18 months after which peptides were eluted for HPLC analysis. d) Western blot analysis of TCP‐25 eluted from coated sutures after 18 months of storage at room temperature. e) Results showing CD spectra of TCP‐25 from stored sutures with and without LPS. Fresh TCP‐25 was used as a control for comparison. f) Suture storage effect on the antimicrobial activity and release of TCP‐25 as evaluated by radial diffusion assay using E. coli. Results show quantification of the clear zones. Data are shown as the mean ± SEM (n = 3–4). NS: non‐significant.
Figure 9
Figure 9
TCP‐25 suture targets human wound fluid‐induced inflammation. a) TCP‐25 suture decreases human wound fluid's pro‐inflammatory ability in vitro. In a reporter assay, THP‐1‐XBlue‐CD14 cells were used. In the presence of TCP‐25 suture or control suture. cells were stimulated by acute (AWF) and chronic wound fluid (CWF) derived from infected wounds from human patients; NF‐κB and AP‐1 activation were evaluated by determining the production of secreted alkaline phosphatase from the reporter cells. Data are presented as the mean ± SEM (n = 6). P values were calculated using paired t‐test. b) TCP‐25 suture decreases human wound fluid's pro‐inflammatory ability in vivo. TCP‐25‐coated sutures were contaminated with human chronic wound fluid and implanted on the back of NF‐κB reporter mice. Non‐invasive IVIS imaging was performed to visualize NF‐κB activation. Data are shown as the mean ± SEM (n = 5). P values were computed using a Mann–Whitney U test. *P ≤ 0.05 and **P ≤ 0.01.

References

    1. a) Weiser T. G., Haynes A. B., Molina G., Lipsitz S. R., Esquivel M. M., Uribe‐Leitz T., Fu R., Azad T., Chao T. E., Berry W. R., Gawande A. A., Bull. W. H. O. 2016, 94, 201; - PMC - PubMed
    2. b) Dobson G. P., Int. J. Surg. 2020, 81, 47; - PMC - PubMed
    3. c) Weiser T. G., Haynes A. B., Molina G., Lipsitz S. R., Esquivel M. M., Uribe‐Leitz T., Fu R., Azad T., Chao T. E., Berry W. R., Gawande A. A., Lancet 2015, 385, S11. - PubMed
    1. Gillespie B. M., Harbeck E., Rattray M., Liang R., Walker R., Latimer S., Thalib L., Andersson A. E., Griffin B., Ware R., Chaboyer W., Int. J. Surg. 2021, 95, 106136. - PubMed
    1. a) Owens C. D., Stoessel K., J. Hosp. Infect. 2008, 70, 3; - PubMed
    2. b) Surgery N. G. R. H. U. o. G., Lancet 2021, 398, 1687; - PubMed
    3. c) Allegranzi B., Nejad S. B., Combescure C., Graafmans W., Attar H., Donaldson L., Pittet D., Lancet 2011, 377, 228; - PubMed
    4. d) Kirkland K. B., Briggs J. P., Trivette S. L., Wilkinson W. E., Sexton D. J., Infect. Control Hosp. Epidemiol. 1999, 20, 725. - PubMed
    1. Allegranzi B., Bischoff P., De Jonge S., Kubilay N. Z., Zayed B., Gomes S. M., Abbas M., Atema J. J., Gans S., Van Rijen M., Boermeester M. A., Egger M., Kluytmans J., Pittet D., Solomkin J. S., Lancet Infect. Dis. 2016, 16, e276. - PubMed
    1. Surgery N. G. R. H. U. o. G., Lancet 2022, 400, 1767. - PubMed

Publication types

LinkOut - more resources