. 2024 Jan 18;109(2):389-401.
doi: 10.1210/clinem/dgad537.

Endogenous Glucose Production in Patients With Glycogen Storage Disease Type Ia Estimated by Oral D-[6,6-2H2]-glucose

Affiliations

Endogenous Glucose Production in Patients With Glycogen Storage Disease Type Ia Estimated by Oral D-[6,6-2H2]-glucose

Alessandro Rossi et al. J Clin Endocrinol Metab. .

Abstract

Context: Glycogen storage disease type Ia (GSDIa) is an inborn metabolic disorder characterized by impaired endogenous glucose production (EGP). Monitoring of patients with GSDIa is prioritized because of ongoing treatment developments. Stable isotope tracers may enable reliable EGP monitoring.

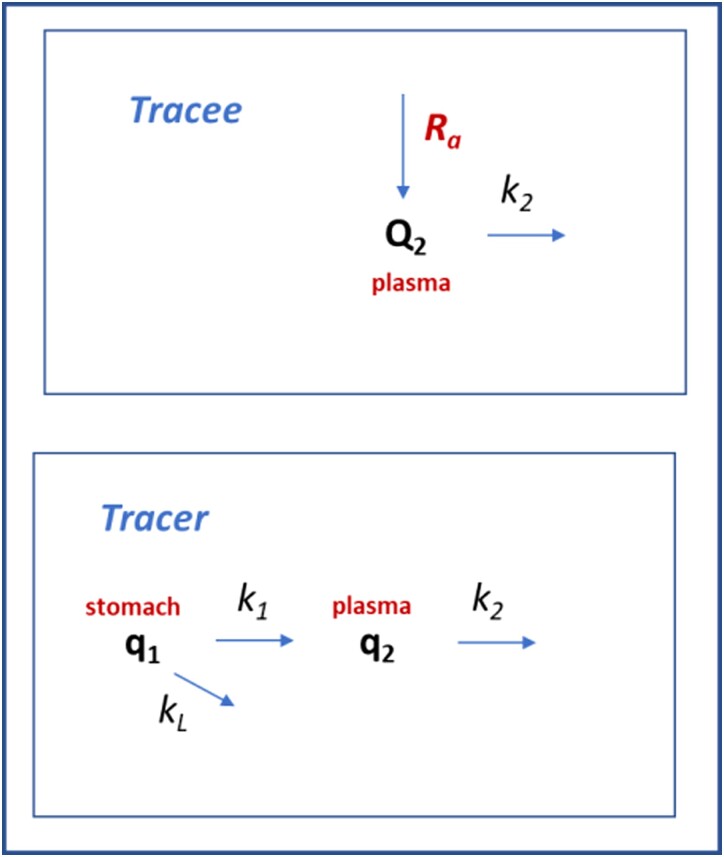
Objective: The aim of this study was to prospectively assess the rate of appearance of endogenous glucose into the bloodstream (Ra) in patients with GSDIa after a single oral D-[6,6-2H2]-glucose dose.

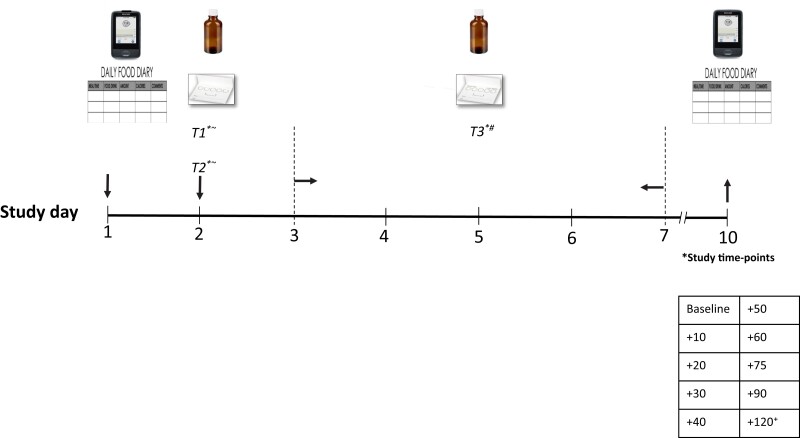
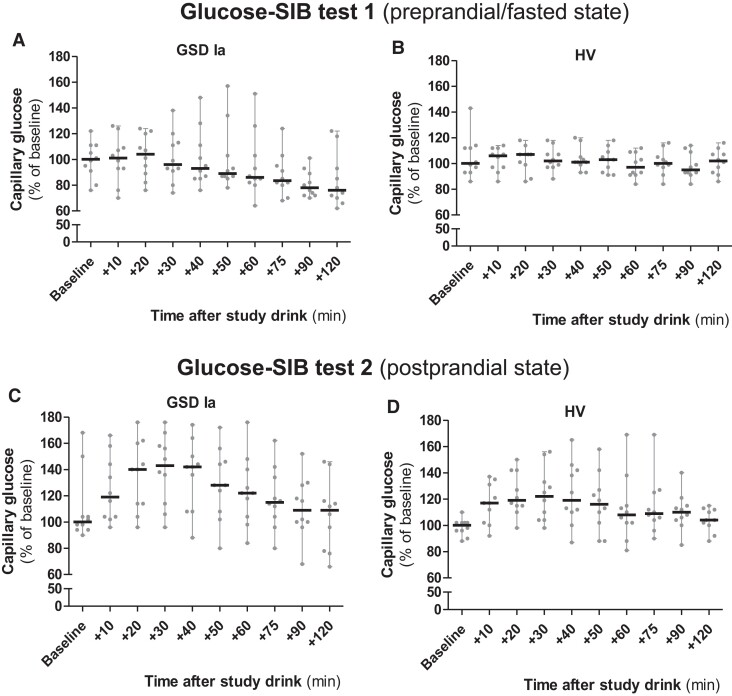
Methods: Ten adult patients with GSDIa and 10 age-, sex-, and body mass index-matched healthy volunteers (HVs) were enrolled. For each participant, 3 oral glucose tracer tests were performed: (1) preprandial/fasted, (2) postprandial, and (3) randomly fed states. Dried blood spots were collected before D-[6,6-2H2]-glucose administration and 10, 20, 30, 40, 50, 60, 75, 90, and 120 minutes thereafter.

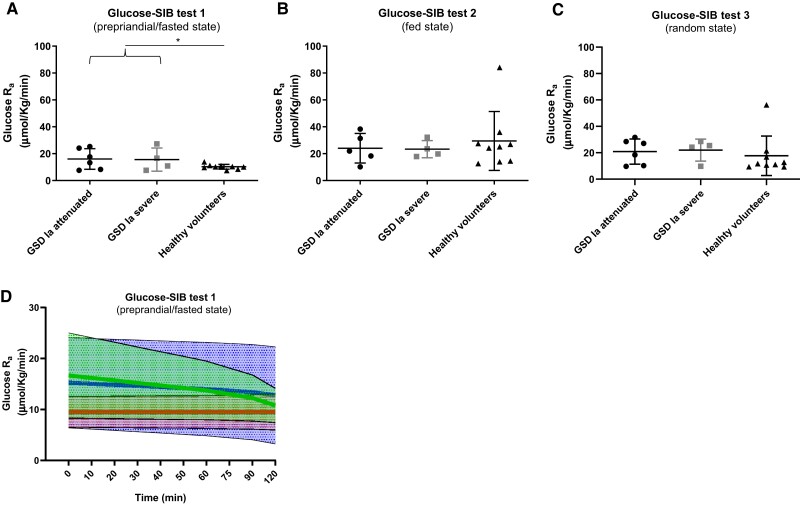
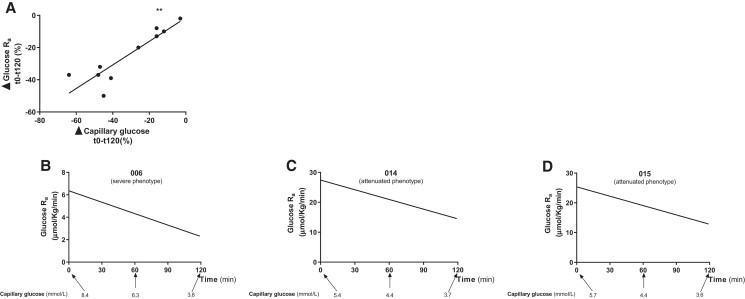
Results: Glucose Ra in fasted HVs was consistent with previously reported data. The time-averaged glucose Ra was significantly higher in (1) preprandial/fasted patients with GSDIa than HV and (2) postprandial HV compared with fasted HV(P < .05). A progressive decrease in glucose Ra was observed in preprandial/fasted patients with GSDIa; the change in glucose Ra time-course was directly correlated with the change in capillary glucose (P < .05).

Conclusion: This is the first study to quantify glucose Ra in patients with GSDIa using oral D-[6,6-2H2] glucose. The test can reliably estimate EGP under conditions in which fasting tolerance is unaffected but does not discriminate between relative contributions of EGP (eg, liver, kidney) and exogenous sources (eg, dietary cornstarch). Future application is warranted for longitudinal monitoring after novel genome based treatments in patients with GSDIa in whom nocturnal dietary management can be discontinued.

Keywords: diet; glycogen storage disease type Ia; monitoring; precision medicine; stable isotopes.


Figures

Figure 1.
Figure 1.
Study protocol. T1, glucose-SIB test 1 (before breakfast); T2, glucose-SIB test 2 (after lunch); T3, glucose-SIB test 3 (random time); supervised; #unsupervised; +1 additional sample at +180 was collected in a subset of participants. Light grey arrows, start; black arrows, end.
Figure 2.
Figure 2.
Two-compartment model of tracer kinetics. The aim is to compute the rate of appearance (Ra) of unlabeled glucose. Ra represents the sum of endogenous glucose production (mainly by the liver) and other sources of unlabeled glucose (eg, in the nonfasted tests including intestinal glucose uptake). Q2 is the pool of unlabeled glucose in the plasma compartment (the tracee), q1 the pool of labeled glucose (tracer) administered orally, and q2 the pool of labeled glucose tracer observed in the plasma. Reaction rates v depend on rate constants k, which are assumed to be identical for tracer and tracee, since these are biochemically indistinguishable.
Figure 3.
Figure 3.
Capillary and CGM glucose concentrations during glucose-SIB test 1 and glucose-SIB test 2. Capillary glucose concentrations (CBG) during glucose-SIB test 1 and 2 in patients with GSDIa (n = 100 [ie, 10 time points × 10 participants] per each glucose-SIB test) and HVs (HVs, n = 100 [ie, 10 time points × 10 participants] per each glucose-SIB test). Results are calculated compared with median baseline values calculated in each subgroup (ie, GSDIa and HVs, respectively) for each glucose-SIB test (100% = median of baseline values in each subgroup) and presented as median with range (grey circles show single participants’ values). 20% = 1 mmol/L glucose.
Figure 4.
Figure 4.
Glucose Ra in the study participants. (A-C) Time-averaged glucose Ra calculated with fixed F and constrained C and Ka. Mean and standard deviation are shown. (D) Glucose Ra time course calculated with fixed F and constrained C and Ka. A line connecting the mean value calculated at each time point (thick line) and SD (shaded area) are shown (green, GSDIa attenuated; blue, GSDIa severe; red, HVs). *P < .05.
Figure 5.
Figure 5.
(A) Correlation between the change in glucose Ra and capillary blood glucose concentrations (CBG) during glucose-SIB test 1 in patients with GSDIa (r = 0.79, **P < .01). Δ was calculated as |(valueendtest1valuestarttest11)×100|. The baseline values were considered as the value start test; values at +120 (or +180) were considered as the value end test. (B-D) Relationship between calculated glucose Ra and CBG during glucose-SIB test 1 in patients with GSDI with severe (B) and attenuated (C, D) phenotypes who developed hypoglycemia at the end of glucose-SIB test 1.

References

    1. Derks TGJ, Rodriguez-Buritica DF, Ahmad A, et al. Fischinger moura de Souza C, riba-wolman R, rossi A, saavedra H, gupta RN, valayannopoulos V, mitchell J. Glycogen storage disease type ia: current management options, burden and unmet needs. Nutrients. 2021;13(11):3828. - PMC - PubMed
    1. Ross KM, Ferrecchia IA, Dahlberg KR, Dambska M, Ryan PT, Weinstein DA. Dietary management of the glycogen storage diseases: evolution of treatment and ongoing controversies. Adv Nutr. 2020;11(2):439‐446. - PMC - PubMed
    1. Rake JP, Visser G, Labrune P, Leonard JV, Ullrich K, Smit GP. Glycogen storage disease type I: diagnosis, management, clinical course and outcome. Results of the European study on glycogen storage disease type I (ESGSD I). Eur J Pediatr. 2002;161(1):S20‐S34. - PubMed
    1. Kishnani PS, Austin SL, Abdenur JE, et al. Diagnosis and management of glycogen storage disease type I: a practice guideline of the American college of medical genetics and genomics. Genet Med. 2014;16(11):e1. - PubMed
    1. Walter JH, Labrune P, Laforêt P. The glycogen storage diseases and related disorders. In: Saudubray JM, Baumgartner MR, García-Cazorla Á, Walter J, eds. Inborn Metabolic Diseases. Springer; 2022:179-200.

Supplementary concepts