

Knockdown of Secernin 1 inhibit cell invasion and migration by activating the TGF-β/Smad3 pathway in oral squamous cell carcinomas
- PMID: 37691034
- PMCID: PMC10493221
- DOI: 10.1038/s41598-023-41504-8
Knockdown of Secernin 1 inhibit cell invasion and migration by activating the TGF-β/Smad3 pathway in oral squamous cell carcinomas
Abstract
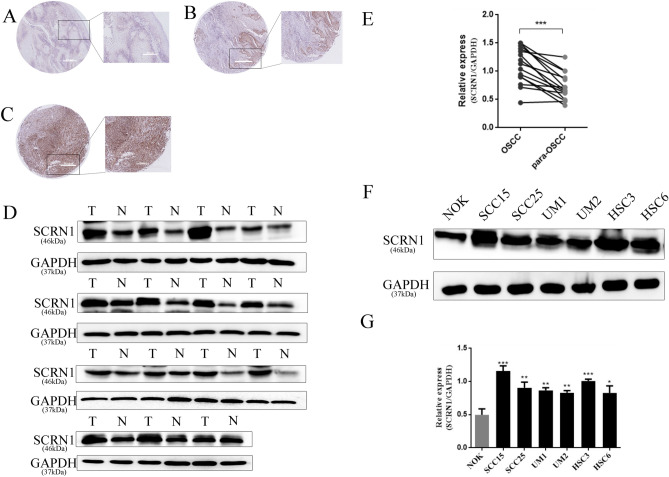
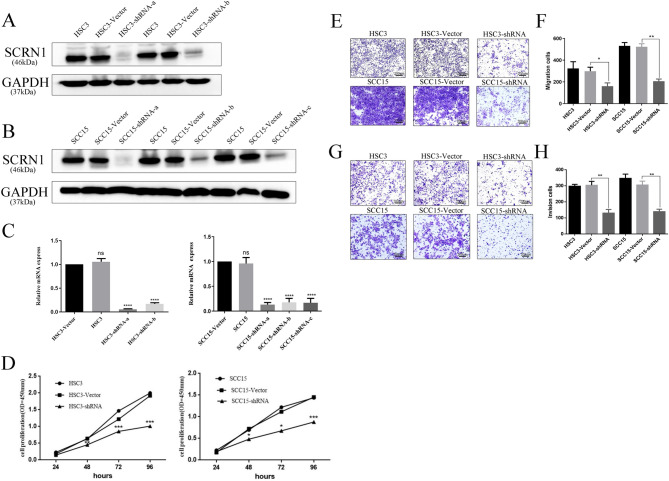
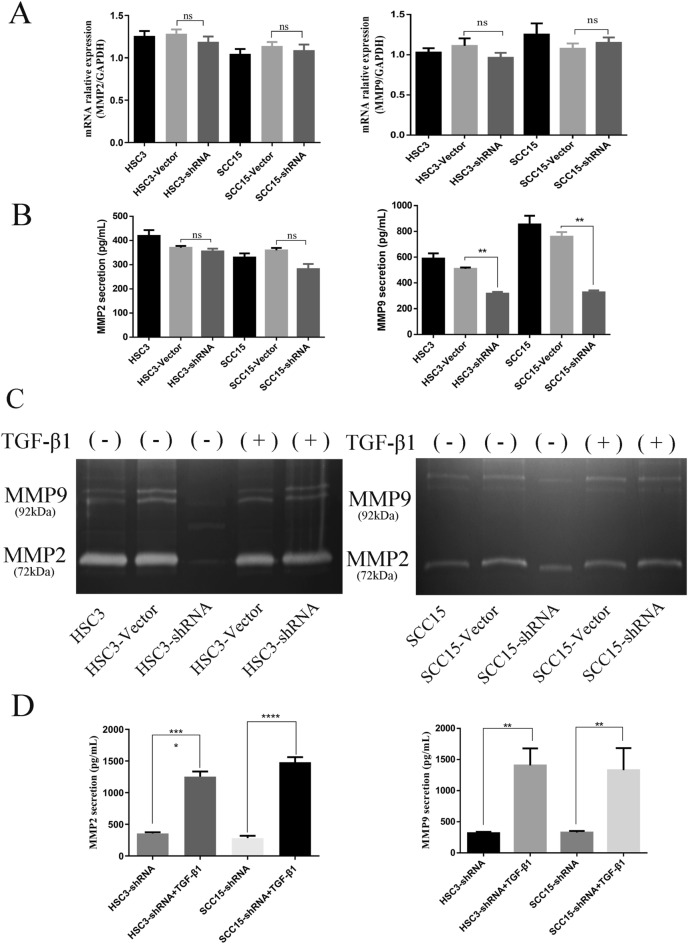
Secernin-1 (SCRN1) is a regulator of exocytosis in mast cells. Recently, SCRN1 was reported to be correlated with the prognosis of colorectal cancer and gastric cancer, but its functional effects on oral squamous cell carcinoma (OSCC) remain unclear. Our aim was to explore the expression pattern and the migration and invasion effects of the newly identified SCRN1 in OSCC. Western blotting (WB) was performed to measure SCRN1 expression in human OSCC tissue samples and OSCC cell lines. The effects of SCRN1 on OSCC cell proliferation, invasion and migration were analyzed by cell counting kit-8 and Transwell assays. The expression levels of TGF-β, Smad3 and phosphorylated Smad3 (p-Smad3) were measured by WB. The secretion of matrix metalloproteinase (MMP)-2 and MMP-9 was determined by the enzyme-linked immunosorbent assay. The expression of SCRN1 was significantly elevated in OSCC tissues and cell lines. SCRN1 knockdown reduced the expression of TGF-β and p-Smad3 in OSCC cells. TGF-β stimulation promoted proliferation, invasion and migration and enhanced the expression of p-Smad3 and the secretion of MMP9 in SCRN1-knockdown OSCC cell lines. Our study demonstrated that SCRN1 is upregulated in OSCC. Further analyses demonstrated that SCRN1 promotes the proliferation, invasion and migration of OSCC cells via TGF-β/Smad3 signaling.
© 2023. Springer Nature Limited.
Conflict of interest statement
The authors have no relevant financial or non-financial interests to disclose.
Figures

Similar articles
-
FERMT1 knockdown inhibits oral squamous cell carcinoma cell epithelial-mesenchymal transition by inactivating the PI3K/AKT signaling pathway.BMC Oral Health. 2021 Nov 23;21(1):598. doi: 10.1186/s12903-021-01955-9. BMC Oral Health. 2021. PMID: 34814915 Free PMC article.
-
Loss of CYLD promotes cell invasion via ALK5 stabilization in oral squamous cell carcinoma.J Pathol. 2018 Mar;244(3):367-379. doi: 10.1002/path.5019. Epub 2018 Feb 1. J Pathol. 2018. PMID: 29235674
-
Increased expression of lncRNA FTH1P3 promotes oral squamous cell carcinoma cells migration and invasion by enhancing PI3K/Akt/GSK3b/ Wnt/β-catenin signaling.Eur Rev Med Pharmacol Sci. 2018 Dec;22(23):8306-8314. doi: 10.26355/eurrev_201812_16528. Eur Rev Med Pharmacol Sci. 2018. PMID: 30556871
-
Mir-5100 Mediates Proliferation, Migration and Invasion of Oral Squamous Cell Carcinoma Cells Via Targeting SCAI.J Invest Surg. 2021 Aug;34(8):834-841. doi: 10.1080/08941939.2019.1701754. Epub 2019 Dec 18. J Invest Surg. 2021. PMID: 31851859
-
Loss of RUNX3 expression inhibits bone invasion of oral squamous cell carcinoma.Oncotarget. 2017 Feb 7;8(6):9079-9092. doi: 10.18632/oncotarget.14071. Oncotarget. 2017. PMID: 28030842 Free PMC article.
Cited by
-
Secernin-2 Stabilizes Histone Methyltransferase KMT2C to Suppress Progression and Confer Therapeutic Sensitivity to PARP Inhibition in Triple-Negative Breast Cancer.Adv Sci (Weinh). 2025 Mar;12(10):e2413280. doi: 10.1002/advs.202413280. Epub 2025 Jan 21. Adv Sci (Weinh). 2025. PMID: 39836524 Free PMC article.
-
Mast cells: key players in digestive system tumors and their interactions with immune cells.Cell Death Discov. 2025 Jan 15;11(1):8. doi: 10.1038/s41420-024-02258-y. Cell Death Discov. 2025. PMID: 39814702 Free PMC article. Review.
-
TCF7 functions as a prognostic biomarker in bladder cancer by strengthening EMT and stemness associated with TGF-β/SMAD3 signaling.Mol Cell Biochem. 2025 Jul;480(7):4135-4148. doi: 10.1007/s11010-025-05241-y. Epub 2025 Mar 1. Mol Cell Biochem. 2025. PMID: 40025258
References
Publication types
MeSH terms
Substances
LinkOut - more resources
Full Text Sources
Medical
Molecular Biology Databases
Miscellaneous
