. 2023 Sep 11;14(1):34.
doi: 10.1186/s13229-023-00567-0.

Cortex-restricted deletion of Foxp1 impairs barrel formation and induces aberrant tactile responses in a mouse model of autism

Affiliations

Cortex-restricted deletion of Foxp1 impairs barrel formation and induces aberrant tactile responses in a mouse model of autism

Xue Li et al. Mol Autism. .

Abstract

Background: Many children and young people with autism spectrum disorder (ASD) display touch defensiveness or avoidance (hypersensitivity), or engage in sensory seeking by touching people or objects (hyposensitivity). Abnormal sensory responses have also been noticed in mice lacking ASD-associated genes. Tactile sensory information is normally processed by the somatosensory system that travels along the thalamus to the primary somatosensory cortex. The neurobiology behind tactile sensory abnormalities, however, is not fully understood.

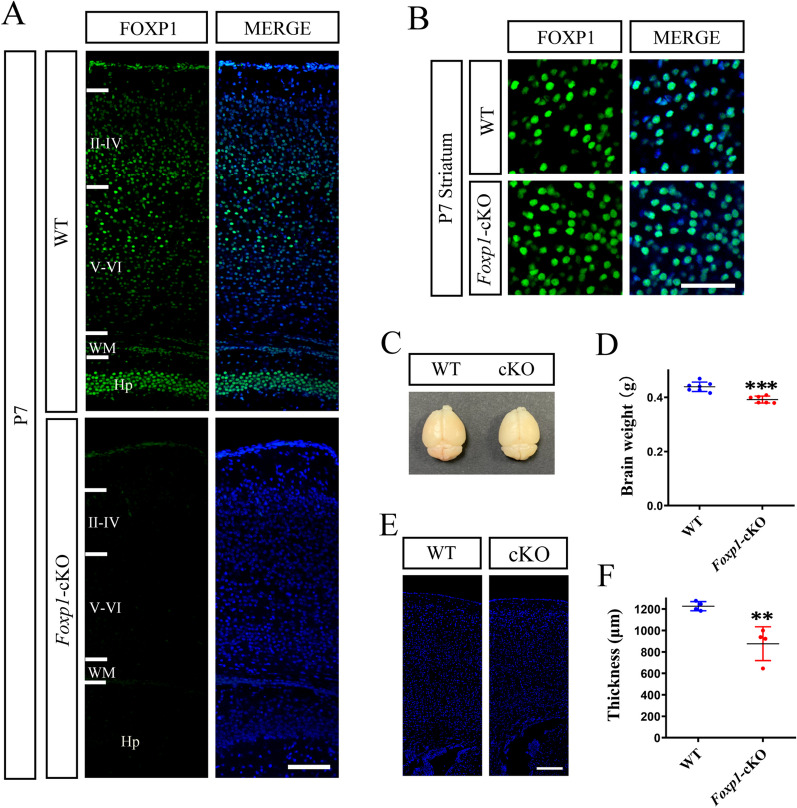
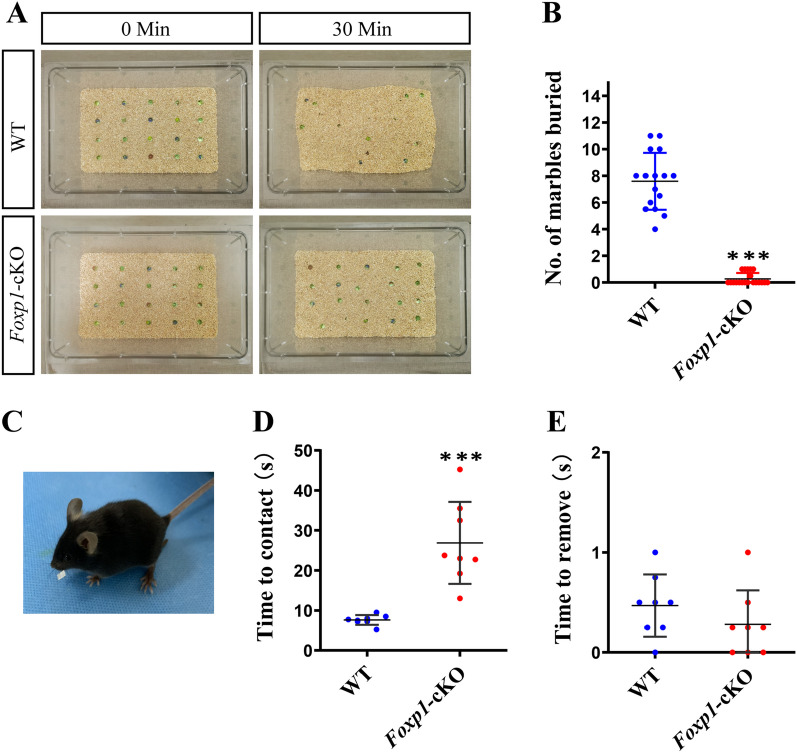
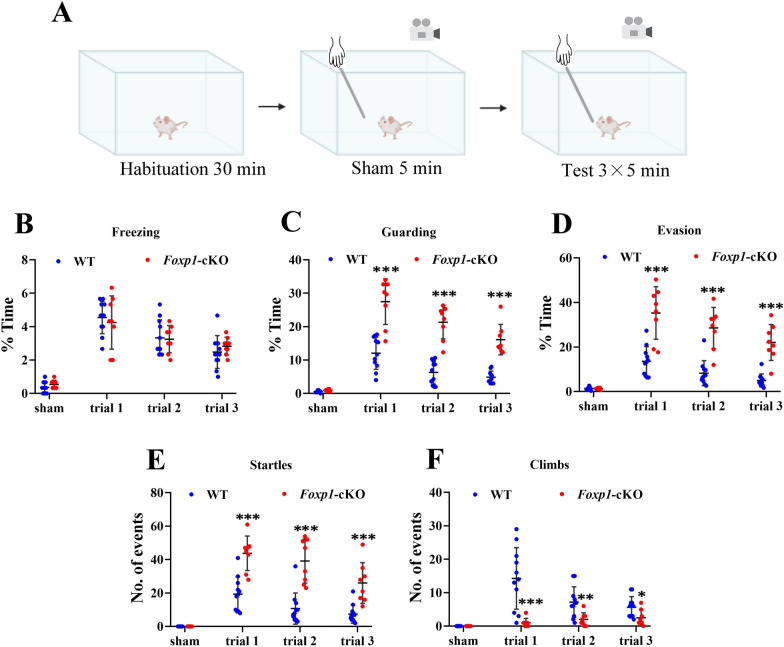
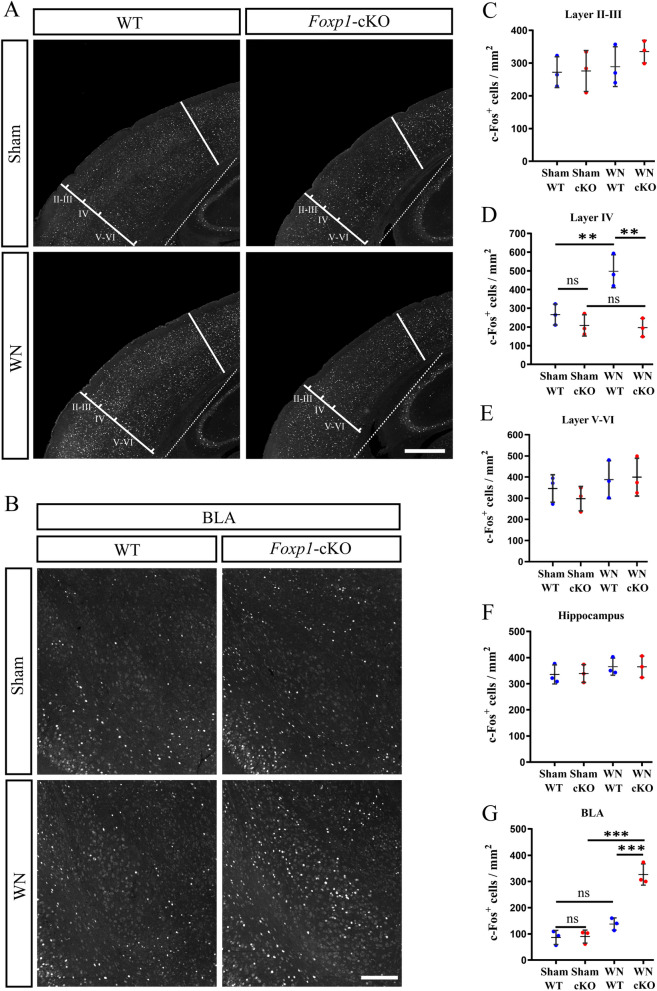
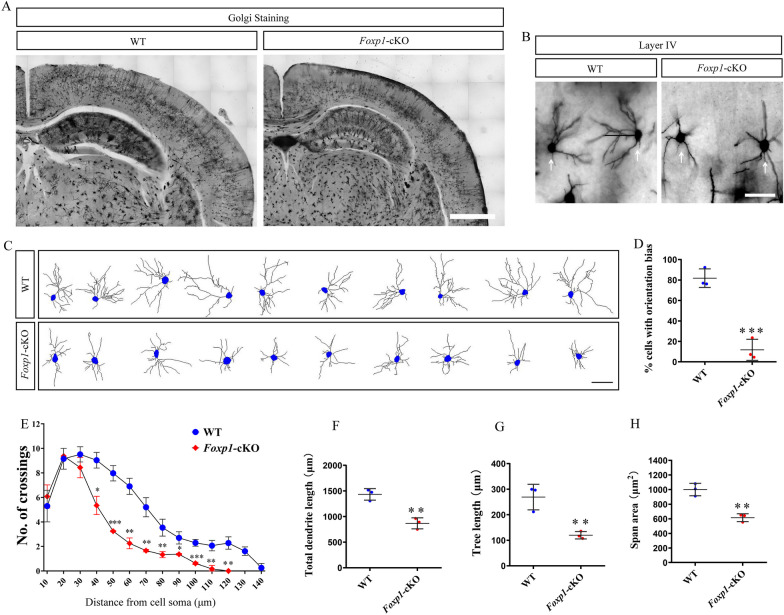
Methods: We employed cortex-specific Foxp1 knockout (Foxp1-cKO) mice as a model of autism in this study. Tactile sensory deficits were measured by the adhesive removal test. The mice's behavior and neural activity were further evaluated by the whisker nuisance test and c-Fos immunofluorescence, respectively. We also studied the dendritic spines and barrel formation in the primary somatosensory cortex by Golgi staining and immunofluorescence.

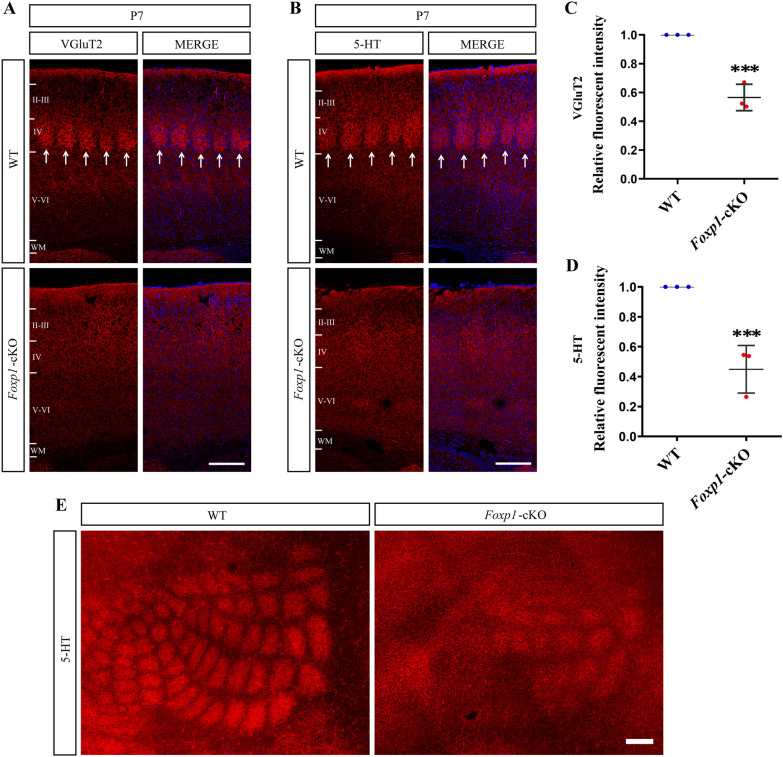
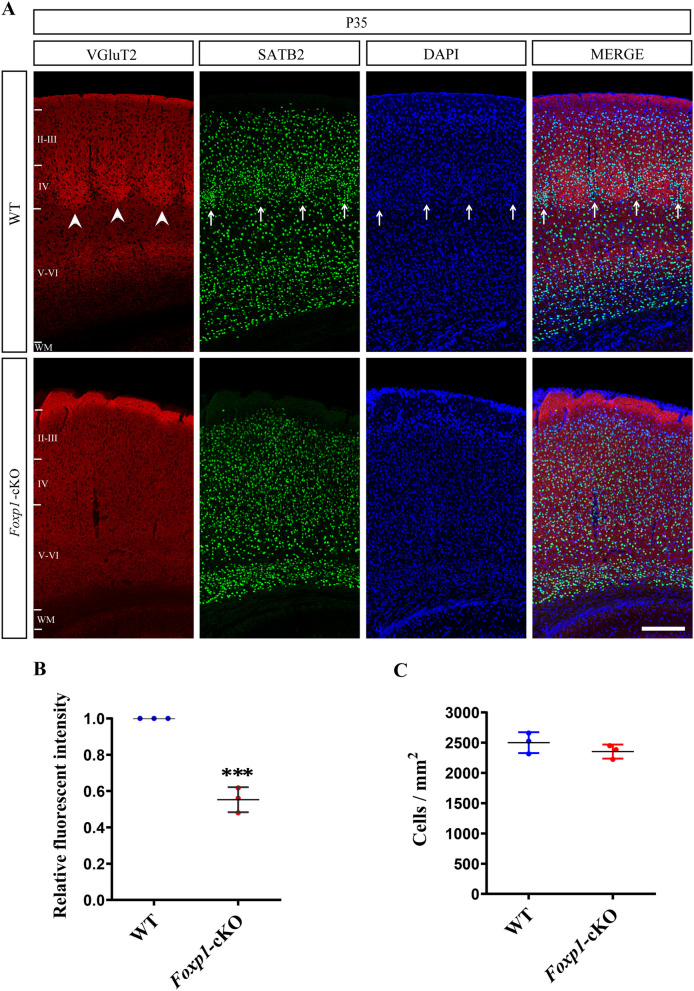
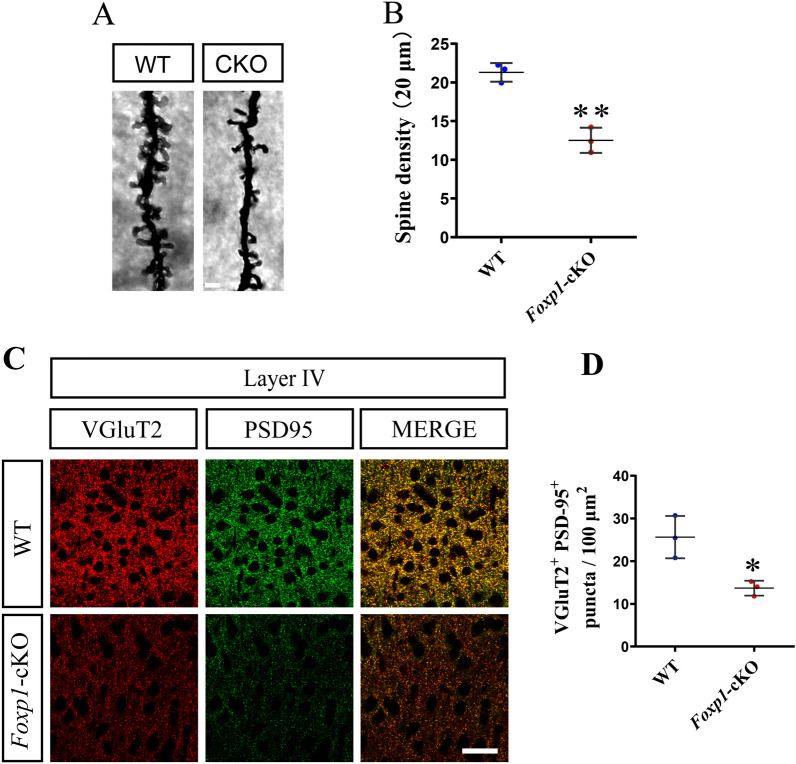
Results: Foxp1-cKO mice had a deferred response to the tactile environment. However, the mice exhibited avoidance behavior and hyper-reaction following repeated whisker stimulation, similar to a fight-or-flight response. In contrast to the wild-type, c-Fos was activated in the basolateral amygdala but not in layer IV of the primary somatosensory cortex of the cKO mice. Moreover, Foxp1 deficiency in cortical neurons altered the dendrite development, reduced the number of dendritic spines, and disrupted barrel formation in the somatosensory cortex, suggesting impaired somatosensory processing may underlie the aberrant tactile responses.

Limitations: It is still unclear how the defective thalamocortical connection gives rise to the hyper-reactive response. Future experiments with electrophysiological recording are needed to analyze the role of thalamo-cortical-amygdala circuits in the disinhibiting amygdala and enhanced fearful responses in the mouse model of autism.

Conclusions: Foxp1-cKO mice have tactile sensory deficits while exhibit hyper-reactivity, which may represent fearful and emotional responses controlled by the amygdala. This study presents anatomical evidence for reduced thalamocortical connectivity in a genetic mouse model of ASD and demonstrates that the cerebral cortex can be the origin of atypical sensory behaviors.

Keywords: Autism; Barrel cortex; Spines; Tactile; Thalamocortical; c-Fos.


Conflict of interest statement

The authors have no competing interests to declare.

Figures

Fig. 1
Fig. 1
Cortical knockout of Foxp1 impairs development of cerebral cortex. A Immunostaining of FOXP1 (green) on the coronal sections of P7 mouse brains. Nuclei were stained with DAPI (blue). Foxp1 was absent from the cortex and hippocampus of Foxp1-cKO mouse brains. B Foxp1 was expressed in the striatum of both WT and KO mouse brains. II-VI, cortical layers; WM, white matter; Hp, hippocampus. C Representative image of whole brains from P35 WT and Foxp1-cKO mice. D Histogram of brain weights. Circles (Blue: WT; Red: Foxp1-cKO) represent the single data points for each brain (n = 6–7 animals). ***p < 0.001. E Coronal sections of cerebral cortex from P35 WT and Foxp1-cKO mice. Scale bar, 50 μm in (A), (B), and (E). F Histogram of the cortical thickness at P35. Circles represent the average thickness for each animal, n = 4 brains per genotype. **p < 0.01
Fig. 2
Fig. 2
Foxp1-cKO mice display tactile sensory deficits. A Representative images showing the marbles on top of bedding initially and after 30 min of the marble burying test. B Comparisons of the number of buried marbles by the mice. Circles represent the data points from each animal, WT: n = 16; cKO: n = 20. ***p < 0.001. C Representative image depicting a mouse undergoing the adhesive removal test. D and E is the time to contact (D) and time to remove (E) the adhesives, respectively, in WT (n = 8) and Foxp1-cKO mice (n = 8). Circles represent the average time of four trials from each animal. ***p < 0.001
Fig. 3
Fig. 3
Foxp1-cKO mice display hyper-reactive to repeated whisker stimulation. A Schematic diagram of whisker nuisance task. The mouse behaviors in response to the whisker stimulation were scored using criteria described in the methods. BD Quantification of the average time spent in freezing, guarding, and evasion behaviors of WT (n = 11) and Foxp1-cKO mice (n = 8). Circles represent the data points from each animal. ***p < 0.001. EF Quantify the number of startle and climb events in response to stick during each session. Circles represent the data points from each animal. *p < 0.05, **p < 0.01, ***p < 0.001
Fig. 4
Fig. 4
C-Fos is not induced in layer IV but increased in BLA of Foxp1-cKO mice by whisker stimulation. AB c-Fos immunolabeling in the barrel cortex (A), hippocampus (A), and BLA (B) of WT and cKO mice 2 h following repeated whisker stimulation. White dot lines indicate the border between the cortex and hippocampus. Scale bars, 500 μm in (A), 200 μm in (B). CE Quantification of c-Fos positive cells in cortical layers of WT and Foxp1-cKO mice. Circles (Blue: WT; Red: Foxp1-cKO) represent the average cell number for each animal (3 animals per genotype; 3 sections per animal). Ns, no significant difference; **p < 0.01. FG Statistics of c-Fos positive cells in the hippocampus (F) and BLA (G). Circles represent the c-Fos+ cell density for each animal (3 animals per genotype; 3 sections per animal). Ns, no significant difference; ***p < 0.001
Fig. 5
Fig. 5
Foxp1 regulates barrel formation in S1. A and B Brain coronal sections from P7 WT and Foxp1-cKO mice subjected to VGluT2 (A) or 5-HT (B) immunostaining. Arrow delineates the barrel units in layer IV of S1. The barrel patches from TCA were almost invisible in Foxp1-cKO mice. Scale bar, 200 μm in (A) and (B). C and D Quantifications of VGluT2 (A) and 5-HT (B) fluorescence intensity of layer IV. Circles represent the average fluorescence intensity for each animal (3 animals per genotype; 3 sections per animal). ***p < 0.001. E A representative image showing 5-HT staining on flattened cortices from P7 WT and Foxp1-cKO mice. Scale bar, 200 μm
Fig. 6
Fig. 6
Cortical deletion of Foxp1 alters cytoarchitecture of barrel field. A Double immunolabeling of VGluT2+ TCA terminals and SATB2+ cortical neurons from P35 WT and the KO mouse brains. DAPI (blue) and SATB2 (red) positive cells formed a ring-like organization around VGluT2+ TCA (red) in control mice (Arrow) but not in the Foxp1-cKO cortex. Arrowhead delineates the barrel in layer IV of S1. Scale bar, 200 μm. B Quantifications of VGluT2 fluorescence intensity of layer IV. Circles represent the average fluorescence intensity for each animal (3 animals per genotype; 3 sections per animal). ***p < 0.001. C The density of SATB2+ cells in layer IV. Circles represent the average cell density for each animal (3 animals per genotype; 3 sections per animal)
Fig. 7
Fig. 7
Foxp1 is required for the dendrite development of layer IV neurons. A Representative Golgi-Cox staining in Foxp1-cKO and WT control mice at 6 weeks of age. Scale bar, 1 mm. B Photomicrographs of spiny stellate neurons (arrows) stained with Golgi-Cox in the barrel cortex. Scale bar, 50 μm. C Reconstruction of individual layer IV stellate neurons from WT and the KO brains. Scale bar, 50 μm. D Histogram shows the proportions of cells with asymmetric dendrite orientation. Symbols (Blue circles: WT; Red circles: Foxp1-cKO) represent the single data points for each animal (13–25 cells per animal, n = 3 animals per genotype). ***p < 0.001. E The number of dendritic intersections with Sholl circles at increasing distances from the center of the cell soma. The KO mice had significantly fewer intersections with circles 40 to 120 μm away from the soma. Circles represent the average of all analyzed cells for each animal (13–25 cells per animal), n = 3 brains per genotype. *p < 0.05, **p < 0.01, ***p < 0.001. FH Quantification of the total length of dendrites, span area, and tree length of layer IV neurons in S1. Circles (Blue: WT; Red: Foxp1-cKO) represent the average of all analyzed cells for each animal (13–25 cells per animal), n = 3 brains per genotype. **p < 0.01
Fig. 8
Fig. 8
Foxp1-cKO mice display fewer thalamocortical synapses. A Representative images of spines on dendritic branches of the spiny stellate neurons from KO and WT mice. Scale bar, 2 μm. B Histogram of the mean spine counts on 20 μm long dendrites. Circles (Blue: WT; Red: Foxp1-cKO) represent the average density of all analyzed segments from each animal (12 segments per animal), n = 3 brains per genotype. **p < 0.01. C Brain coronal sections were immunostained for VGluT2 and PSD-95. Scale bar, 20 μm. D Statistics of puncta number of VGluT2+PSD-95+ excitatory thalamocortical synapses per 100 mm2 in layer IV of S1. Circles represent the average puncta number for each animal (3 animals per genotype; 3 sections per animal). *p < 0.05

Similar articles

Cited by

References

    1. Ozonoff S. Editorial perspective: autism spectrum disorders in DSM-5–an historical perspective and the need for change. J Child Psychol Psychiatry. 2012;53:1092–1094. - PubMed
    1. Marco EJ, Hinkley LB, Hill SS, Nagarajan SS. Sensory processing in autism: a review of neurophysiologic findings. Pediatr Res. 2011;69:48R–54R. - PMC - PubMed
    1. Foss-Feig JH, Heacock JL, Cascio CJ. Tactile responsiveness patterns and their association with core features in autism spectrum disorders. Res Autism Spectr Disord. 2012;6:337–344. - PMC - PubMed
    1. Robertson CE, Baron-Cohen S. Sensory perception in autism. Nat Rev Neurosci. 2017;18:671–684. - PubMed
    1. Dunn W. The sensations of everyday life: empirical, theoretical, and pragmatic considerations. Am J Occup Ther. 2001;55:608–620. - PubMed

Publication types

Substances