. 2023 Sep 10;13(1):165.
doi: 10.1186/s13578-023-01121-4.

Sex differences in paternal arsenic-induced intergenerational metabolic effects are mediated by estrogen

Affiliations

Sex differences in paternal arsenic-induced intergenerational metabolic effects are mediated by estrogen

Yanfeng Xue et al. Cell Biosci. .

Abstract

Background: Gene-environment interactions contribute to metabolic disorders such as diabetes and dyslipidemia. In addition to affecting metabolic homeostasis directly, drugs and environmental chemicals can cause persistent alterations in metabolic portfolios across generations in a sex-specific manner. Here, we use inorganic arsenic (iAs) as a prototype drug and chemical to dissect such sex differences.

Methods: After weaning, C57BL/6 WT male mice were treated with 250 ppb iAs in drinking water (iAsF0) or normal water (conF0) for 6 weeks and then bred with 15-week-old, non-exposed females for 3 days in cages with only normal water (without iAs), to generate iAsF1 or conF1 mice, respectively. F0 females and all F1 mice drank normal water without iAs all the time.

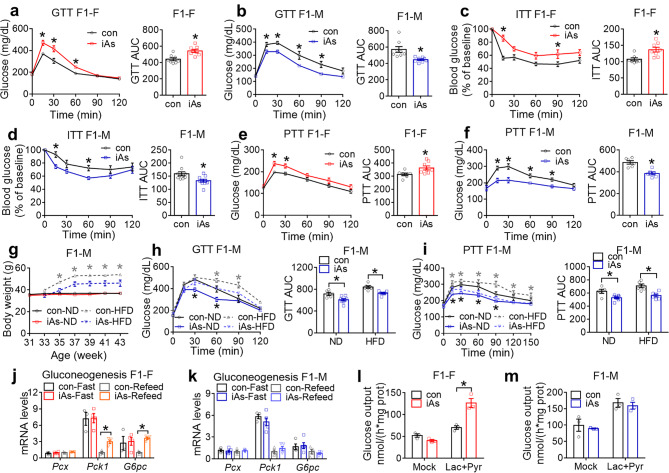
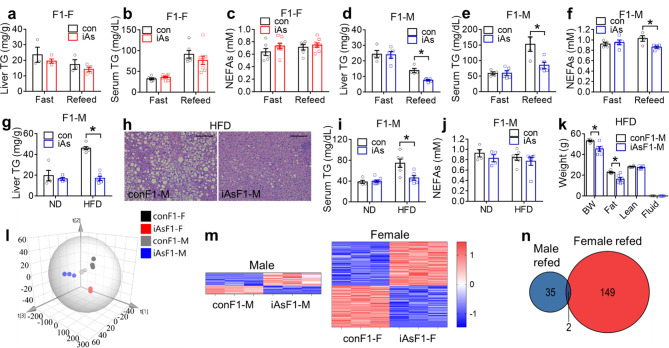
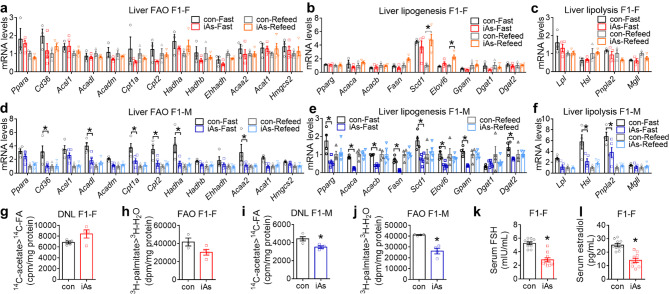
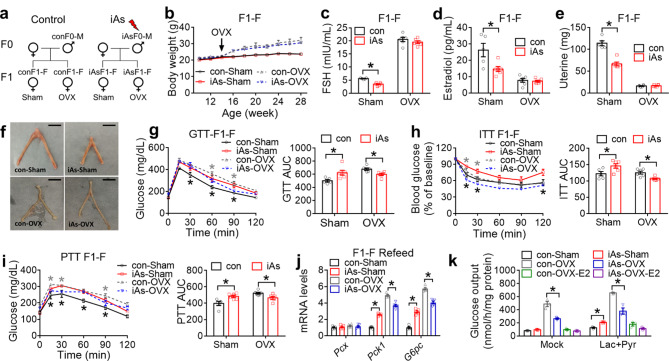
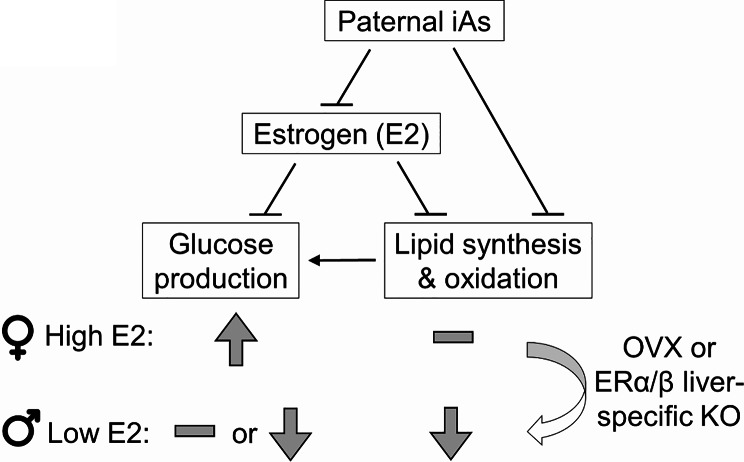
Results: We find that exposure of male mice to 250 ppb iAs leads to glucose intolerance and insulin resistance in F1 female offspring (iAsF1-F), with almost no change in blood lipid profiles. In contrast, F1 males (iAsF1-M) show lower liver and blood triglyceride levels than non-exposed control, with improved glucose tolerance and insulin sensitivity. The liver of F1 offspring shows sex-specific transcriptomic changes, with hepatocyte-autonomous alternations of metabolic fluxes in line with the sex-specific phenotypes. The iAsF1-F mice show altered levels of circulating estrogen and follicle-stimulating hormone. Ovariectomy or liver-specific knockout of estrogen receptor α/β made F1 females resemble F1 males in their metabolic responses to paternal iAs exposure.

Conclusions: These results demonstrate that disrupted reproductive hormone secretion in alliance with hepatic estrogen signaling accounts for the sex-specific intergenerational effects of paternal iAs exposure, which shed light on the sex disparities in long-term gene-environment interactions.

Keywords: Arsenic exposure; Environmental health; Epigenetic inheritance; Estrogen signaling pathway; Glucose and lipid metabolism.


Conflict of interest statement

The authors disclose no conflict of interest.

Figures

Fig. 1
Fig. 1
Sex difference in glucose metabolism in F1 offspring in response to paternal iAs. (a) Glucose tolerance test (GTT) and area under the curve (AUC) for control (con) or iAs F1 females (F1-F) at 12 weeks old, n = 8 mice. (b) GTT of F1 males (F1-M) at 12 weeks old, n = 8 mice. (c) Insulin tolerance test (ITT) of F1 females at 14 weeks old, n = 7 mice for con and n = 8 mice for iAs. (d) ITT of F1 males at 14 weeks old, n = 10 mice. (e) Pyruvate tolerance test (PTT) of F1 females at 20 weeks old, n = 7 mice for con and n = 8 mice for iAs. (f) PTT of F1 males at 20 weeks old, n = 6 mice. (g) Body weight of F1 males on a normal chow diet (ND) or a high-fat diet (HFD). HFD started at 33 weeks old. n = 5 mice for con-ND, n = 8 mice for iAs-ND, and n = 6 mice for con-HFD or iAs-HFD. (h) GTT of F1 males on the indicated diet at 41 weeks old, n = 5 mice for con-ND, n = 8 mice for iAs-ND, and n = 6 mice for con-HFD or iAs-HFD. (i) PTT of F1 males on the indicated diet at 43 weeks old, n = 5 mice for con-ND, n = 8 mice for iAs-ND, and n = 6 mice for con-HFD and iAs-HFD. (j) RT-qPCR analysis of gluconeogenic genes in the liver of F1 females under 7 h fasting (Fast) or 7 h refeeding (Refeed) conditions. The mean value in the con-Refeed group was set as 1. n = 3 mice for control groups and n = 4 mice for iAs groups. (k) RT-qPCR analysis of gluconeogenic genes in the liver of F1 males under 7 h fasting (Fast) or 7 h refed (Refeed) conditions, n = 4 mice for con groups and n = 5 mice for iAs groups. (l) Glucose output assay (GOP) in primary hepatocytes isolated from F1 females at 22 weeks old, n = 3 mice. (m) GOP in primary hepatocytes isolated from F1 males at 22 weeks old, n = 3 mice. Black or gray asterisks indicate significant differences between con and iAs groups on ND or HFD, respectively. Two-way ANOVA with Holm-Sidak method was used to analyze GTT, PTT, ITT, time-dependent body weight changes, gene expression changes, GOP, and 4-group AUC of kinetic metabolic tests. Two-sided t-test was used to analyze 2-group AUC of kinetic metabolic tests. Data are mean ± S.E.M. * P < 0.05
Fig. 2
Fig. 2
Sex difference of lipid metabolism for F1 offspring in response to paternal iAs. (a) Liver triglyceride (TG) contents in F1 females (F1-F), n = 3 mice for control (con) and n = 4 mice for iAs groups. (b-c) Serum TG and non-esterified fatty acids (NEFAs) levels in F1 females, n = 6 mice for control and n = 8 mice for iAs groups. (d) Liver TG contents in F1 males (F1-M), n = 4 mice for control and n = 5 mice for iAs groups. (e-f) Serum TG and NEFAs levels in F1 males, n = 4 mice for control and n = 5 mice for iAs groups. (g) Liver TG contents in F1 males at the fasting condition on the indicated diet, n = 4 mice for normal chow diet (ND) groups, and n = 6 mice for high-fat diet (HFD) groups. (h) Hematoxylin and eosin (H&E) staining of livers in F1 males on HFD. Scale bar, 100 μm. (i-j) Serum TG and NEFAs levels in F1 males, n = 4–8 mice for ND groups and n = 6 mice for HFD groups. (k) Magnetic resonance imaging (MRI) analysis of F1 males on HFD, n = 6 mice. (l) Partial least squares of discriminant analysis (PLS-DA) of the RNA-seq results of the livers in the conF1-F, iAsF1-F, conF1-M, and iAsF1-M groups in the refed condition, n = 3 mice. (m) Heat map of differentially expressed genes (DEGs) due to paternal iAs in either male or female F1 livers as identified by RNA-seq with q < 0.05 as cut-off. The color key shows Z-Score calculated as (FPKM-Mean)/SD. (n) Venn diagram of hepatic DEGs in iAsF1-F vs. conF1-F mice and DEGs in iAsF1-M vs. conF1-M mice in the refed condition, n = 3 mice. Two-way ANOVA with Holm-Sidak method was used to analyze liver TG levels, serum TG and NEFAs levels, and MRI data. Data are mean ± S.E.M. * P < 0.05 between conF1 and iAsF1 groups under the same conditions
Fig. 3
Fig. 3
Paternal iAs alters hepatic lipid metabolic gene expression and sex hormones in F1 offspring. (a-c) RT-qPCR analysis of genes in fatty acid oxidation (FAO), lipogenesis, and lipolysis in the liver of F1 females (F1-F) after 7 h fasting or 7 h refed conditions, n = 3 mice for control groups and n = 4 for iAs groups. The mean value in the con-Refeed groups was set as 1. (d-f) RT-qPCR analysis of genes in FAO, lipogenesis, and lipolysis in the liver of F1 males (F1-M), n = 4 mice control groups and n = 5 for iAs groups. (g)14 C-acetate tracer analysis of de novo lipogenesis (DNL) in primary hepatocytes from F1 females at 22 weeks old, n = 4 mice. (h)3 H-palmitate tracer analysis of FAO in primary hepatocytes from F1 females at 22 weeks old, n = 3–4 mice. (i)14 C-acetate tracer analysis of DNL in primary hepatocytes from F1 males at 22 weeks old, n = 4 mice. (j)3 H-palmitate tracer analysis of FAO in primary hepatocytes from F1 males at 22 weeks old, n = 4 mice. (k-l) Serum follicle-stimulating hormone (FSH) and estradiol levels in F1 females, n = 10 mice. Two-way ANOVA with the Holm-Sidak method was used to analyze gene expression levels. Two-sided t-test was used to analyze isotope tracer assays, serum FSH levels, and serum estradiol levels. Data are mean ± S.E.M. * P < 0.05 between conF1 and iAsF1 groups under the same conditions
Fig. 4
Fig. 4
Sex hormones in F1 females mediate female-specific glucose phenotypes of paternal iAs. (a) Experimental scheme for F1 females (F1-F) with sham or ovariectomy (OVX) surgery at 14 weeks old. (b) Body weight, n = 5–6 mice. (c-d) Serum follicle-stimulating hormone (FSH) and estradiol levels in F1 females, n = 5–6 mice. (e) Uterine weight of F1 females after surgery, n = 5–6 mice. (f) Representative pictures of uterine from F1 females after sham and OVX. Scale bar, 5 mm. (g) Glucose tolerance test (GTT) and area under the curve (AUC) in F1 females at 22 weeks old after sham or OVX, n = 5–6 mice. Black or gray asterisks indicate significant differences between con and iAs groups after sham or OVX, respectively. (h) Insulin tolerance test (ITT) in F1 females at 24 weeks old after sham or OVX, n = 5–6 mice. (i) Pyruvate tolerance test (PTT) in F1 females at 20 weeks old after sham or OVX, n = 5–6 mice. (j) RT-qPCR analysis of gluconeogenic genes in the liver of F1 females in the fasting condition after sham or OVX, n = 5–6 mice. The mean value in the con-sham group was set as 1. (k) Glucose output (GOP) in primary hepatocytes from F1 females after sham or OVX at 22 weeks old, n = 3 for each group. Two-way ANOVA with the Holm-Sidak method was used to analyze GTT, PTT, ITT, 4-group AUC of kinetic metabolic tests, time-dependent body weight changes, gene expression levels, GOP, serum FSH and estradiol, and uterine weight. Data are mean ± S.E.M. * P < 0.05 between conF1 and iAsF1 groups under the same conditions
Fig. 5
Fig. 5
Gonad hormones in F1 females mask lipid phenotypes of paternal iAs. (a) Liver triglyceride (TG) contents in F1 females in the fasting condition after sham or OVX, n = 5–6 mice. (b) H&E staining of the liver in F1 females after sham or OVX. Scale bar, 100 μm. (c-d) Serum TG and non-esterified fatty acids (NEFAs) levels in F1 females after sham or OVX, n = 5–6 mice. (e-g) RT-qPCR analysis of genes in lipogenesis, fatty acid oxidation (FAO), and lipolysis in the liver of F1 females in the fasting condition after sham or OVX, n = 5–6 mice. The mean value in the con-sham group was set as 1. Two-way ANOVA with the Holm-Sidak method was used to analyze liver TG, serum TG, serum NEFAs, and gene expression levels. Data are mean ± S.E.M. * P < 0.05 between conF1 and iAsF1 groups under the same conditions
Fig. 6
Fig. 6
Liver ERα/β in F1 females is required for the glucose phenotypes of paternal iAs. (a) Experimental scheme for adult-onset liver-specific knockout of ERα/β in mice carrying double floxed ERα/β alleles through AAV injection at 19 weeks old. (b) RT-qPCR analysis of ERα/β in the liver of F1 females injected with AAV expressing GFP or Cre, n = 8 mice. (c) Western blot analysis of ERα and ERβ in the liver of F1 females injected with AAV-GFP or AAV-Cre, n = 4 mice. (d-e) Glucose tolerance test (GTT) and area under the curve (AUC) in F1 females (F1-F) at 27 weeks old, n = 8–12 mice per group. (f-g) Insulin tolerance test (ITT) in F1 females at 33 weeks old, n = 8–9 mice. (h-i) Pyruvate tolerance test (PTT) in F1 females at 31 weeks old, n = 8–9 mice. (j-k) RT-qPCR analysis of gluconeogenic genes in the liver of F1 females under fasting or refed condition. The mean value in the con-GFP or con-Cre groups was set as 1. n = 4–5 mice. (l-m) Glucose output (GOP) assay in primary hepatocytes from F1 females at 30 weeks old injected with AAV-GFP or AAV-Cre, n = 3 mice. Two-way ANOVA with the Holm-Sidak method was used to analyze GTT, PTT, ITT, gene expression levels, and GOP. Two-sided t-test was used to analyze 2-group AUC of kinetic metabolic tests. Data are mean ± S.E.M. * P < 0.05 between conF1 and iAsF1 groups under the same conditions
Fig. 7
Fig. 7
Liver ERα/β in F1 females counteracts the lipid metabolic changes of paternal iAs. (a) Liver triglyceride (TG) contents in F1 females injected with AAV-GFP, n = 4–5 mice. (b) Serum TG levels in F1 females injected with AAV-GFP, n = 8 mice. (c) Serum non-esterified fatty acids (NEFAs) levels in F1 females injected with AAV-GFP, n = 11 mice. (d) Liver TG contents in F1 females injected with AAV-Cre, n = 4 mice. (e) Serum TG levels in F1 females injected with AAV-Cre, n = 8 mice. (f) Serum NEFAs levels in F1 females injected with AAV-Cre, n = 9–11 mice. (g-l) RT-qPCR analysis of genes in fatty acid oxidation (FAO), lipogenesis, and lipolysis in fasting or refed condition in the liver of F1 females injected with AAV-GFP or AAV-Cre, n = 4–5 mice. The mean values in the con-GFP or con-Cre group were set as 1. (m-n)3 H-palmitate tracer analysis of FAO in primary hepatocytes from F1 female mice at 30 weeks old injected with AAV-GFP or AAV-Cre, n = 3–4 mice. (o-p)14 C-acetate tracer analysis of de novo lipogenesis (DNL) in primary hepatocytes from F1 female mice at 30 weeks old injected with AAV-GFP or AAV-Cre, n = 3 mice. Two-way ANOVA with the Holm-Sidak method was used to analyze liver TG, serum TG, serum NEFAs, and gene expression levels. Two-sided t-test was used to analyze isotope tracer assays. Data are mean ± S.E.M. * P < 0.05 between conF1 and iAsF1 groups under the same conditions
Fig. 8
Fig. 8
Working model. The sex difference in paternal iAs-induced glucose and lipid metabolic changes in F1 offspring

References

    1. Catalán V, Avilés-Olmos I, Rodríguez A, Becerril S, Fernández-Formoso JA, Kiortsis D, et al. Time to consider the Exposome hypothesis in the development of the obesity pandemic. Nutrients. 2022;14:1597. - PMC - PubMed
    1. Heindel JJ, Howard S, Agay-Shay K, Arrebola JP, Audouze K, Babin PJ, et al. Obesity II: establishing causal links between chemical exposures and obesity. Biochem Pharmacol. 2022;199:115015. - PMC - PubMed
    1. Stegemann R, Buchner DA. Transgenerational inheritance of metabolic disease. Semin Cell Dev Biol. 2015;43:131–40. - PMC - PubMed
    1. Jeon JY, Ha KH, Kim DJ. New risk factors for obesity and diabetes: environmental chemicals. J Diabetes Investig. 2015;6:109–11. - PMC - PubMed
    1. Le Magueresse-Battistoni B, Vidal H, Naville D. Environmental pollutants and metabolic Disorders: the Multi-Exposure scenario of life. Front Endocrinol. 2018;9:582. - PMC - PubMed