. 2023 Sep;13(9):e1356.
doi: 10.1002/ctm2.1356.

Single-cell RNA sequencing captures patient-level heterogeneity and associated molecular phenotypes in breast cancer pleural effusions

Affiliations

Single-cell RNA sequencing captures patient-level heterogeneity and associated molecular phenotypes in breast cancer pleural effusions

Holly J Whitfield et al. Clin Transl Med. 2023 Sep.

Abstract

Background: Malignant pleural effusions (MPEs) are a common complication of advanced cancers, particularly those adjacent to the pleura, such as lung and breast cancer. The pathophysiology of MPE formation remains poorly understood, and although MPEs are routinely used for the diagnosis of breast cancer patients, their composition and biology are poorly understood. It is difficult to distinguish invading malignant cells from resident mesothelial cells and to identify the directionality of interactions between these populations in the pleura. There is a need to characterize the phenotypic diversity of breast cancer cell populations in the pleural microenvironment, and investigate how this varies across patients.

Methods: Here, we used single-cell RNA-sequencing to study the heterogeneity of 10 MPEs from seven metastatic breast cancer patients, including three Miltenyi-enriched samples using a negative selection approach. This dataset of almost 65 000 cells was analysed using integrative approaches to compare heterogeneous cell populations and phenotypes.

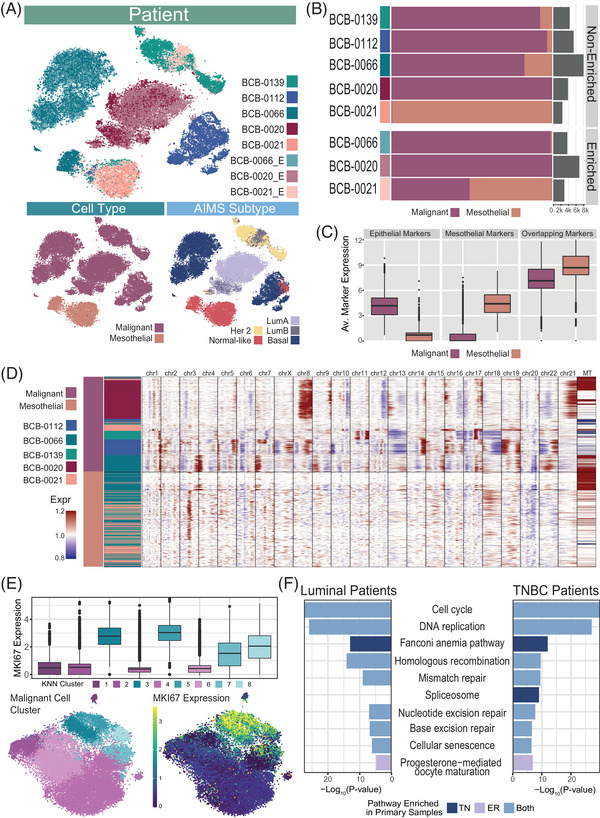
Results: We identified substantial inter-patient heterogeneity in the composition of cell types (including malignant, mesothelial and immune cell populations), in expression of subtype-specific gene signatures and in copy number aberration patterns, that captured variability across breast cancer cell populations. Within individual MPEs, we distinguished mesothelial cell populations from malignant cells using key markers, the presence of breast cancer subtype expression patterns and copy number aberration patterns. We also identified pleural mesothelial cells expressing a cancer-associated fibroblast-like transcriptomic program that may support cancer growth.

Conclusions: Our dataset presents the first unbiased assessment of breast cancer-associated MPEs at a single cell resolution, providing the community with a valuable resource for the study of MPEs. Our work highlights the molecular and cellular diversity captured in MPEs and motivates the potential use of these clinically relevant biopsies in the development of targeted therapeutics for patients with advanced breast cancer.


Conflict of interest statement

The authors declare no conflict of interest.

Figures

FIGURE 1
FIGURE 1
Single‐cell transcriptomic landscape of malignant pleural effusions. (A) A tSNE representation of 49 109 cells that were isolated from seven pleural effusions. Six cell types were assigned: malignant cells (43.4% total cells, purple), mesothelial (9.7%, orange), T cells (18.7%, dark blue), NK cells (9.7%, light blue), B cells (1.4%, yellow) and cell types belonging to a myeloid lineage (11.8%, green). Bar shows the proportion of each cell type across all seven MPEs. Cell‐type colours are used consistently throughout the figure. (B) Clustered correlations (spearman) between transcriptomic profiles of different cell types aggregated within each patient (see Supplementary Methods), showing evidence for whole‐transcriptome similarities across similar cell types. The colours of the cell types are to the same as Figure 1A. The same order was used in the X and Y axes. (C) Gene expression patterns across cell populations using the normalized expression of upregulated genes for each cell type, averaged within each patient (see Supplementary Methods). Hierarchical clustering of genes shows clear patterns of differential expression between cell types, annotated with marker genes of interest. (D) Cell‐type proportions per patient showing the diversity across patients with different disease subtypes. Each horizontal bar represents the cell type proportions in a patient and total cell number is indicated on the right‐hand side. Cell type according to colour legend in panel A. (E) Percent of cells in each cell type with non‐zero expression of nine marker genes across MPE and primary breast tumour datasets. Cell type according to colour legend in panel A, except for additional cell types in primary samples (CAFs and endothelial).
FIGURE 2
FIGURE 2
Immune components of malignant pleural effusions. (A) A tSNE of 22 414 immune cells from seven breast cancer patients coloured by cell type. (B) Diversity of patient immune profiles represented as the proportion of overall cells per patient for different disease subtypes. Each horizontal bar represents the cell‐type proportions in a patient and total cell number is indicated on the right‐hand side. Cell type according to colour legend in panel A. (C) Average normalized expression of marker genes across cell‐type populations. Hierarchical clustering of genes shows concordance between cell type‐specific marker genes and cell‐type identities. (D) Percentage of T cells that are CD4‐positive (light purple) or CD8‐positive (dark purple) in each patient. Across all patients, there are 31 double‐positive cells (both CD4‐ and CD8‐positive), which are included as grey. (E) Percentage of T and NK cells in each patient that belong to each subpopulation. Patient ID according to colour legend in panel B.
FIGURE 3
FIGURE 3
Inter‐patient heterogeneity in the mesothelial and malignant composition of MPEs‐level heterogeneity of cancer cell phenotypes. (A) A tSNE of 37 428 non‐immune cells from eight breast cancer patient samples (five non‐enriched, three enriched) coloured by (i) patient ID (E: enriched), (ii) cell type and (iii) breast cancer subtypes based on the AIMS breast cancer classifier on pseudo‐bulk samples. Cell type and subtype colour legends here are used throughout the figure. (B) Proportions and total number of malignant and mesothelial cells per patient, illustrating cancer cell presence is variable among patients, and that standard cancer cell enrichment strategies still retain mesothelial cells in MPE samples. Each horizontal bar represents the cell‐type proportions in a patient and total cell number is indicated on the right‐hand side. Cell type according to colour legend in panel A. (C) The average log2(TPM+1) expression of three groups of marker genes across malignant and mesothelial populations. Expression has been averaged across genes in each group, per cell. This includes epithelial breast cancer‐specific marker genes (CLDN4, IMP3, MUC1, CDH1, CEACAM5, SCGB2A2, CLDN3 and CLDN7) and mesothelial‐specific marker genes (CALB2, WT1, UPK3B, CDH2, COL1A2, S100A4 and MSLN) known to distinguish between malignant epithelial and mesothelial cell populations, in contrast to common overlapping markers (KRT8, KRT19, VIM, CD44 and ACTB) that make it difficult to distinguish these populations. (D) Malignant and mesothelial cell populations were subsampled from patient clusters (see Supplementary Methods), and the heatmap shows their expression intensity (based on read depth) across chromosomal positions relative to a baseline of benign epithelial mammary cells and non‐malignant immune cells from five patients. This can be used to identify regions of the tumour genome that may have undergone somatic copy number variation. (E) Analysis of 31 628 malignant cells from seven samples (BCB‐0020, BCB‐0139, BCB‐0112 and BCB‐066, and three enriched samples: BCB‐0020_E, BCB‐0021 and BCB‐0066_E). Patient data were integrated and clustered into eight clusters, as shown on the left tSNE. Clusters 3, 5, 7 and 8 (blue) show high MKI67 log‐expression, where the remaining clusters (1, 2, 4 and 6) have low or no expression of MKI67 (boxplot, right tSNE). (F) We pseudo‐bulked cells from the eight clusters in Figure 3E for luminal (BCB‐0020, BCB‐0139, BCB‐0020_E, BCB‐0021_E) and triple negative breast cancer (TNBC) (BCB‐0112, BCB‐0066, BCB‐0066_E) separately, then performed a differential expression between clusters with high MKI67 expression (clusters 3, 5, 7 and 8) and low MKI67 expression (clusters 1, 2, 4 and 6). KEGG pathways upregulated in the MKI67‐high clusters (blue), in either luminal (ER: Estrogen Receptor) or triple‐negative breast cancer patients (TN: Triple Negative), are presented with their corresponding −log10(p‐value). The horizontal bars indicating p‐value are coloured based on whether or not the pathway is also enriched in luminal or TN (or both) primary breast cancer samples.
FIGURE 4
FIGURE 4
Mesothelial‐derived CAFs in malignant pleural effusion. (A) PCA plot demonstrating transcriptomic differences between pseudo‐bulked malignant (pink) and mesothelial (orange) populations. Pseudo‐bulk samples are aggregated within each patient for patients with sufficient numbers of malignant and mesothelial cells (BCB‐0112; circle, BCB‐0139; square, BCB‐0066; diamond, BCB‐0021 [enriched]; triangle). (B) Upper heatmap shows the scaled log(CPM) (counts per million) expression of 40 differentially expressed genes (corrected p‐value < .05, FDR < .05), including the top 20 genes upregulated in malignant pseudo‐bulk samples (pink) and top 20 genes upregulated in mesothelial pseudo‐bulk samples (orange). The lower heatmap shows the average gene set score across malignant (pink) and mesothelial (orange) cells in each pseudo‐bulk sample for a CAF signature and two epithelial signatures to describe the CAF phenotype of mesothelial cells and the relative epithelial phenotype of malignant cells. (C) Network representation that captures the top 100 interactions between ligands and receptors that are expressed in mesothelial (pink) and malignant (purple) cell populations, respectively. Node size indicates the proportion of cells in each cell type that express a gene, and transparency shows average log‐expression. (D) Gene set scores for FGFR2‐positive (light pink) and ‐negative (dark pink) malignant cells for FGF‐related signalling pathways. (E) Expression of FGFR2‐positive malignant cells across patients compared with per‐patient gene set scores. Total number of FGFR2‐positive cells per patient is indicated by the bar chart (left). The log‐expression of FGFR2 in FGFR2‐positive malignant cells across patients is shown in the middle. The boxplots (right) summarize gene set scores for FGFR2‐positive (light pink) and ‐negative (dark pink) malignant cells in each patient. The light pink and dark pink horizontal lines through the boxplots indicate the median score for FGFR2‐negative and ‐positive cells, respectively.

Similar articles

Cited by

References

    1. Antony VB, Loddenkemper R, Astoul P, et al. Management of malignant pleural effusions. Am J Respir Crit Care Med. 2000;162:1987‐2001. - PubMed
    1. Fentiman IS, Millis R, Sexton S, Hayward JL. Pleural effusion in breast cancer: a review of 105 cases. Cancer. 1981;47:2087‐2092. - PubMed
    1. Asciak R, Rahman NM. Malignant pleural effusion: from diagnostics to therapeutics. Clin Chest Med. 2018;39:181‐193. - PubMed
    1. Skok K, Hladnik G, Grm A, Crnjac A. Malignant pleural effusion and its current management: a review. Medicina (Lithuania). 2019;55:490. - PMC - PubMed
    1. Nam H‐S. Malignant pleural effusion: medical approaches for diagnosis and management. Tuberc Respir Dis. 2014;76:211‐217. - PMC - PubMed

Publication types