Review
. 2023 Oct 30;381(2259):20220350.
doi: 10.1098/rsta.2022.0350. Epub 2023 Sep 11.

Recent developments in X-ray diffraction/scattering computed tomography for materials science

Affiliations
Review

Recent developments in X-ray diffraction/scattering computed tomography for materials science

Naomi E Omori et al. Philos Trans A Math Phys Eng Sci. .

Abstract

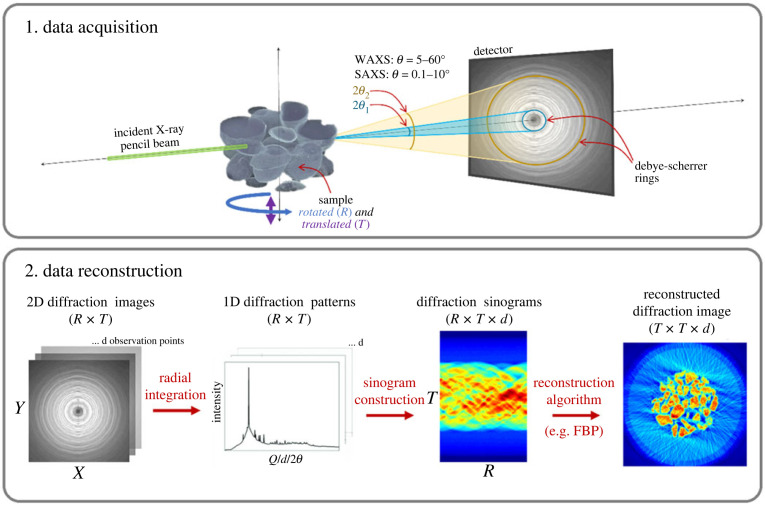
X-ray diffraction/scattering computed tomography (XDS-CT) methods are a non-destructive class of chemical imaging techniques that have the capacity to provide reconstructions of sample cross-sections with spatially resolved chemical information. While X-ray diffraction CT (XRD-CT) is the most well-established method, recent advances in instrumentation and data reconstruction have seen greater use of related techniques like small angle X-ray scattering CT and pair distribution function CT. Additionally, the adoption of machine learning techniques for tomographic reconstruction and data analysis are fundamentally disrupting how XDS-CT data is processed. The following narrative review highlights recent developments and applications of XDS-CT with a focus on studies in the last five years. This article is part of the theme issue 'Exploring the length scales, timescales and chemistry of challenging materials (Part 2)'.

Keywords: X-ray; XRD-CT; chemical imaging; diffraction; scattering; tomography.


Conflict of interest statement

We declare we have no competing interests.

Figures

Figure 1.
Figure 1.
Summary of XRD-CT data acquisition and reconstruction. Note the following terms in the above for R (rotation), T (translation), d (observation points) and FBP (filtered back projection).
Figure 2.
Figure 2.
XRD-CT exemplar in Li-ion batteries showing spatial distribution of all components in a pristine NMC532 AAA battery cell where (P) and (S) indicate the primary and secondary phase components. Reproduced from Vamvakeros et al. [82].
Figure 3.
Figure 3.
PDF-CT exemplar in Fischer–Tropsch catalyst. Reconstructed two-dimensional integrated Fourier transform intensity maps based on the intensity of the Co–Co scattering features at approximately 3 Å (CoO) and 2.5 Å fcc Co are shown under reduction and during FT conditions as a function of temperature and time. Note corresponding XRD-CT data shown in the left panel. Reproduced from Senecal et al. [126].
Figure 4.
Figure 4.
XRD-CT exemplar from a microparticle of van Gogh's Wheat Stack Under a Cloudy Sky (1889) (left) (a) Photograph of Wheat Stack Under a Cloudy Sky by Van Gogh (October 1889, oil on canvas, Kröller-Müller Museum, NL) with white circle denoting sample area and b/c) detail of paint sample. (Right) XRD-CT reconstructions of (a) projected and (b) internal crystalline distribution of the paint sample. Reproduced from Vanmeert et al. with permission from John Wiley & Sons [135].
Figure 5.
Figure 5.
XRD-CT and XRF-CT reconstructions in cortical bone. Ca XRF-CT 3D renders in (a) and (b) and XRF-CT slices in (c) and (d). (e) Examples of reconstructed diffractograms originating from the points marked with circled crosses in f. (f) Rietveld scale factor (f) and integrated background (g). Reproduced from Palle et al. [148] with permission from Elsevier.
Figure 6.
Figure 6.
SAXS-TT exemplar in murine neuronal matter. Myelin peaks (2) from the cervical portion of a spinal cord (1) are scanned to produce two-dimensional SAXS projections (3), which are reconstructed to form tensor tomograms providing three-dimensional fibre orientations per voxel (4). Reproduced from Giorgiadis et al. [46].
Figure 7.
Figure 7.
XRD-CT data analysis using the CNN PQ-Net in a model multiphase NiO-PdO-CeO2-ZrO2-Al2O3 catalytic system. Crystallite size and lattice parameter maps for CeO2 and ZrO2 obtained with the Rietveld method (a), results obtained with the PQ-Net (b), their absolute difference (c). Reproduced from Dong et al. [171].

References

    1. Pan X, Siewerdsen J, La Riviere PJ, Kalender WA. 2008. Anniversary paper: development of X-ray computed tomography: the role of medical physics and AAPM from the 1970s to present. Med. Phys. 35, 3728-3739. (10.1118/1.2952653) - DOI - PMC - PubMed
    1. Johansen G. 2005. Nuclear tomography methods in industry. Nucl. Phys. A 752, 696-705. (10.1016/j.nuclphysa.2005.02.069) - DOI
    1. Podurets K, Kichanov SE, Glazkov VP, Kovalenko ES, Murashev MM, Kozlenko DP, Lukin EV, Yatsishina EB. 2021. Modern methods of neutron radiography and tomography in studies of the internal structure of objects. Crystallogr. Rep. 66, 254-266. (10.1134/S1063774521020115) - DOI
    1. Matsumoto Y et al. 2017. Recent progress of radiography and tomography at the energy-resolved neutron imaging system RADEN. Phys. Proc. 88, 162-166. (10.1016/j.phpro.2017.06.022) - DOI
    1. Midgley PA, Dunin-Borkowski RE. 2009. Electron tomography and holography in materials science. Nat. Mater. 8, 271-280. (10.1038/nmat2406) - DOI - PubMed

LinkOut - more resources