

Pioneer activity distinguishes activating from non-activating SOX2 binding sites
- PMID: 37691488
- PMCID: PMC10577566
- DOI: 10.15252/embj.2022113150
Pioneer activity distinguishes activating from non-activating SOX2 binding sites
Abstract
Genome-wide transcriptional activity involves the binding of many transcription factors (TFs) to thousands of sites in the genome. Pioneer TFs are a class of TFs that maintain open chromatin and allow non-pioneer TFs access to their target sites. Determining which TF binding sites directly drive transcription remains a challenge. Here, we use acute protein depletion of the pioneer TF SOX2 to establish its functionality in maintaining chromatin accessibility. We show that thousands of accessible sites are lost within an hour of protein depletion, indicating rapid turnover of these sites in the absence of the pioneer factor. To understand the relationship with transcription, we performed nascent transcription analysis and found that open chromatin sites that are maintained by SOX2 are highly predictive of gene expression, in contrast to all other SOX2 binding sites. We use CRISPR-Cas9 genome editing in the Klf2 locus to functionally validate a predicted regulatory element. We conclude that the regulatory activity of SOX2 is exerted mainly at sites where it maintains accessibility and that other binding sites are largely dispensable for gene regulation.
Keywords: acute protein depletion; chromatin accessibility; gene regulation; pioneer activity; transcription factors.
© 2023 The Authors. Published under the terms of the CC BY 4.0 license.
Conflict of interest statement
JD is a co‐founder of Nucleome Therapeutics and provides consultancy to the company. The remaining authors declare no competing interests.
Figures
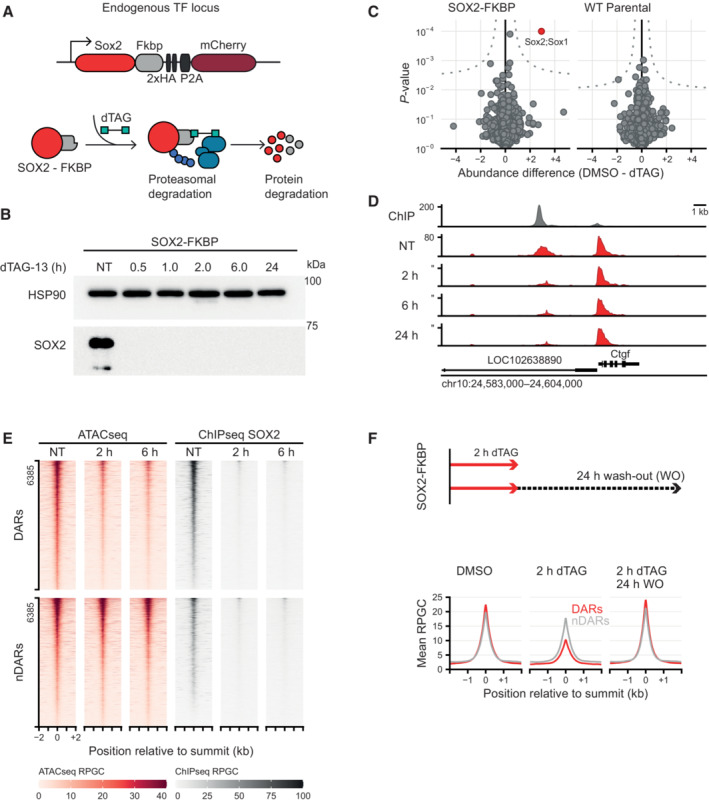
Schematic representation of the dTAG system, wherein an FKBP‐tagged protein can be proteasomally degraded upon addition of the dTAG‐13 small molecule.
Western blot showing protein abundance of SOX2 upon addition of dTAG‐13 for the indicated times in SOX2‐FKBP cell lines. HSP90 was used as loading control (NT, Not Treated).
Quantitative mass spectrometry results showing the differential protein abundance upon 30 min of dTAG treatment versus DMSO treated SOX2‐FKBP cells and parental (untagged) cells.
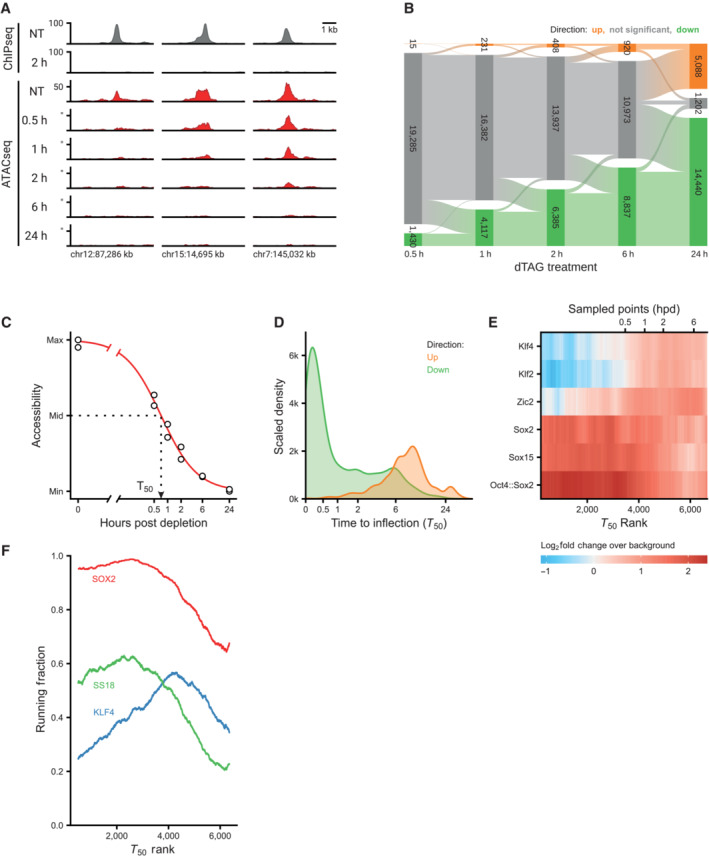
Genomic tracks showing SOX2 binding by ChIPseq (gray) and accessibility by ATACseq (red) around the Ctgf gene for SOX2‐FKBP cell line after indicated times of depletion by dTAG treatment. Y‐axes show reads per genomic content (RPGC).
Heatmap showing accessibility and SOX2 ChIPseq before and after dTAG treatment in SOX2‐FKBP cell line at SOX2 peaks that are differentially accessible regions (DAR) or where no differentially accessible region is detected (nDAR) partially matched for SOX2 binding.
Top: Experimental procedure for SOX2 ATACseq after wash‐off of dTAG. Bottom: Average profile of ATACseq in SOX2 degradation system and restoration of SOX2 after 2 and 24 h of dTAG wash‐off at the same DARs/nDARs as in (E).
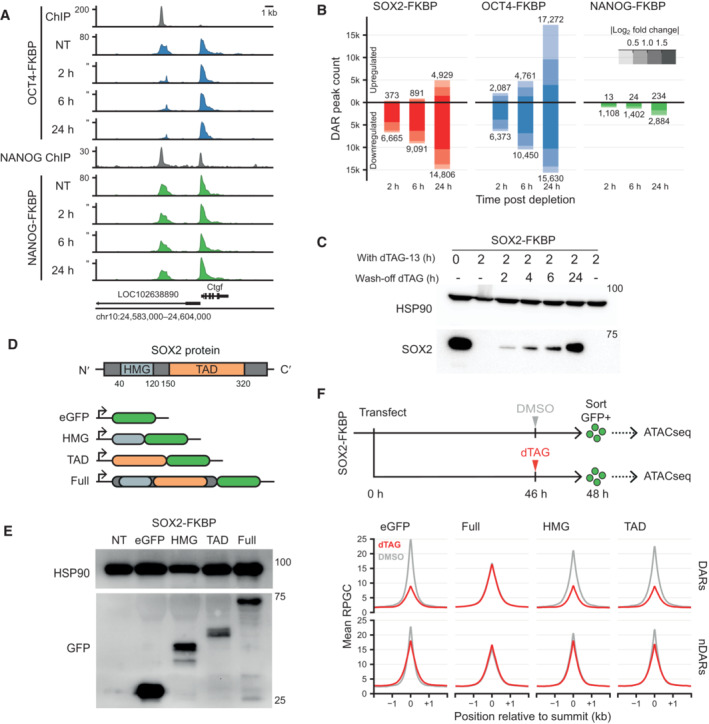
Genomic tracks of accessibility changes by ATACseq in OCT4 and NANOG FKBP tagged lines measured in untreated condition (NT) and after OCT4 and NANOG depletion at the indicated timepoints. ChIPseq tracks for OCT4 in the OCT4‐FKBP line and NANOG from publicly available data are shown on top of ATACseq. Y‐axes refers to reads per genomic content (RPGC).
Bar plot showing the number of differential accessible regions (DARs) after a time course of SOX2, OCT4 and NANOG depletion, in FKBP tagged lines.
Western blot analysis of SOX2 expression level at 0 and 2 h of dTAG‐13 and during a time course of dTAG‐13 washoff. HSP90 was used as loading control.
Schematic representation of SOX2 protein showing the DNA binding domain (HMG) and the trans‐activation domain (TAD). To generate versions of the protein for ectopic expression, the HMG, TAD or full length SOX2 was cloned in frame with the eGFP sequence in an episomal expression vector.
Western blot using an antibody against eGFP shows the fusion proteins running at the expected size. HSP90 was used as a loading control.
Top; Representation of the experimental procedure for ATACseq after ectopic expression of the truncated SOX2‐EGFP constructs. SOX2‐FKBP cells were transfected with the plasmids and seeded for DMSO or dTAG‐13 treatment. eGFP positive cells were sorted and ATACseq was performed on the eGFP expressing cells. Bottom; Line plot showing the average signal of ATACseq after overexpression of the plasmids after DMSO (gray) or dTAG13 treatment (red) for the endogenous SOX2‐FKBP degradation. The average ATACseq signal is plotted for the DARs and nDARs as identified in Fig 1F.
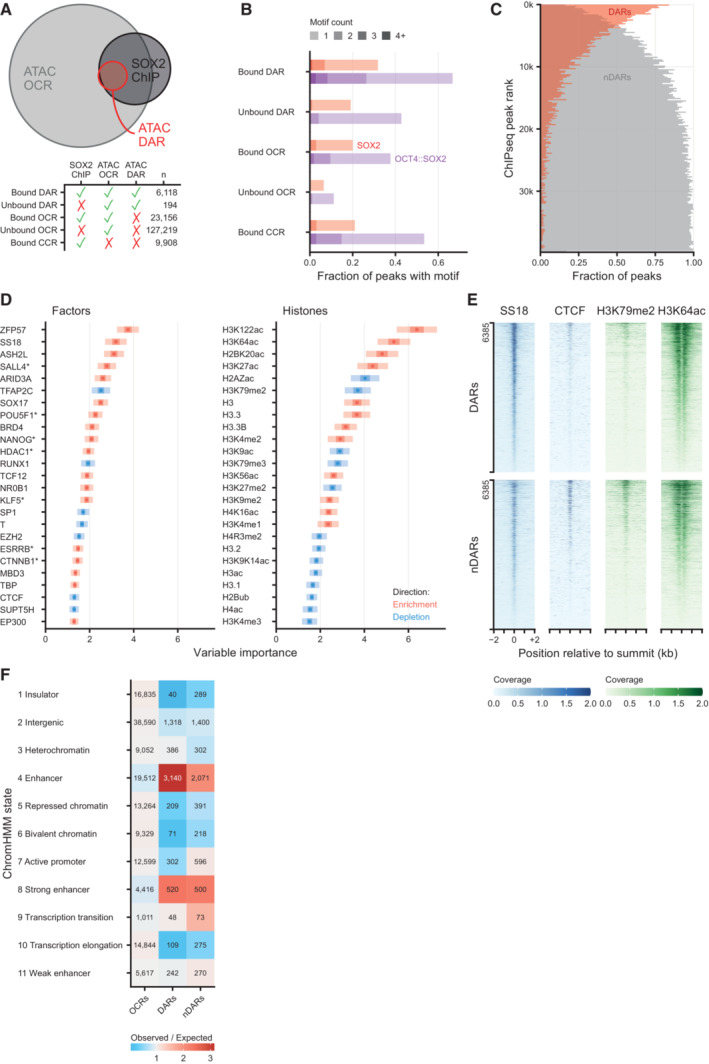
Euler diagram showing the overlap between differentially accessible regions (DARs) after 2 h of SOX2 depletion, all ATACseq peaks (OCR, open chromatin regions) and SOX2 DNA binding (SOX2 ChIP). Bottom panel shows the number of peaks in each overlap category. CCR: closed chromatin region, i.e., SOX2 ChIPseq peaks that do not overlap OCRs.
Fraction of peaks containing 1 or more OCT4::SOX2 or SOX2 DNA binding motifs, stratified by whether OCRs, DARs and/or SOX2 binding sites as measured by ChIPseq, or combinations thereof.
Vertical histogram of SOX2 ChIPseq peaks ranked by signal intensity, stratified by their overlap with downregulated DARs or lack of such overlap (nDAR), displayed in 200 peak bins.
Left, top 25 (chromatin binding) factors in the Cistrome factors datasets whose overlap with all ATACseq peaks is predictive in random forest classification to discriminate the DARs from non‐DARs (nDAR) peaks partially matched for SOX2 binding levels. ATACseq peaks were extended by 300 bp in both directions. Variable importance was calculated with subsampling inference, wherein the 95% confidence interval (CI) is indicated with a light color, the 50% CI with a darker color and the median with a point. Enrichment and depletion indicate higher and lower average overlap in the DAR than nDAR categories respectively. Right, top 25 histone modifications using the Cistrome histone datasets of 100 re‐sampling.
Tornado plots showing example differences between DARs and nDARs for SS18, CTCF, H3K79me2 and H3K64ac from publicly available ChIPseq datasets. Coverage indicates values in pre‐processed data.
Heatmap of ChromHMM defining chromatin states of different set of ATACseq peaks: other open chromatin regions (OCRs), DARs and partially SOX2‐binding matched nDARs. The expected value was calculated under independence of proportions assumption, as they are calculated for a chi‐squared test.
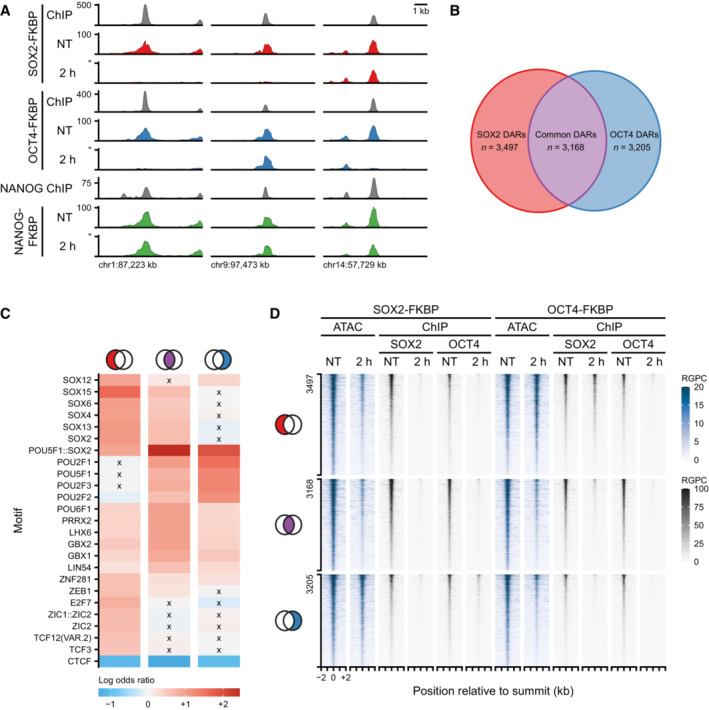
Example regions of changes in accessibility as measured by ATACseq during the SOX2, OCT4, and NANOG depletion time course. Y‐axis indicates reads per genomic content (RPGC). In gray are shown the ChIPseq tracks for SOX2, OCT4, and NANOG.
Euler diagram shows the number of regions losing accessibility (DARs) after SOX2 depletion only (red, SOX2 DARs), OCT4 depletion only (blue, OCT4 DARs) and in common (purple, common DARs).
Heatmap showing the top 25 motifs at SOX2, common and OCT4 DARs. Colorbar indicates odds of finding the motif in the DAR set relative to all other OCRs. Crosses denote non‐significant odds.
Tornado plots showing ATACseq (blue) after SOX2 and OCT4 depletion. Regions are divided by SOX2, Common and OCT4 DARs. In gray, ChIPseq signal of SOX2 and OCT4 after SOX2 and OCT4 depletion. RPGC: reads per genomic content.
Example regions of changes in SOX2 occupancy measured by ChIPseq (to, in gray) and in accessibility as measured by ATACseq (red) during the SOX2 depletion time course. Y‐axis indicates reads per genomic content (RGPC).
Alluvial diagram shows the number of regions gaining accessibility (up, orange) or losing accessibility (down, green) over the SOX2 depletion time course.
Illustration of estimating the time to inflection (T 50) for a DAR, wherein a log‐logistic model is fit to the data over time after depletion.
Kernel density estimate of the time to inflection for DARs going up and down. The density is scaled such that the area under the curve integrates to the number of DARs. Time to inflection is displayed with inverse hyperbolic sine transformation.
Heatmap of motif enrichment displaying downregulated DARs on the X‐axis sorted by time to inflection. Colors display a fold change of a centered running mean, measuring the fraction of peaks containing the indicated motifs over a 400 peaks window, relative to the fraction of nDARs containing these motifs. Sampled time points are indicated at the bins where the time to inflection surpasses the sampled time.
Patterns of protein binding at sites ordered by their inflection time (T 50). Running fraction represents the fraction of peaks in a 1,000‐peak window that overlaps one of the specified ChIPseq datasets. The SS18 and KLF4 peaks were acquired from Cistrome, whereas the SOX2 peaks were taken from the SOX2‐FKBP line in the untreated condition.
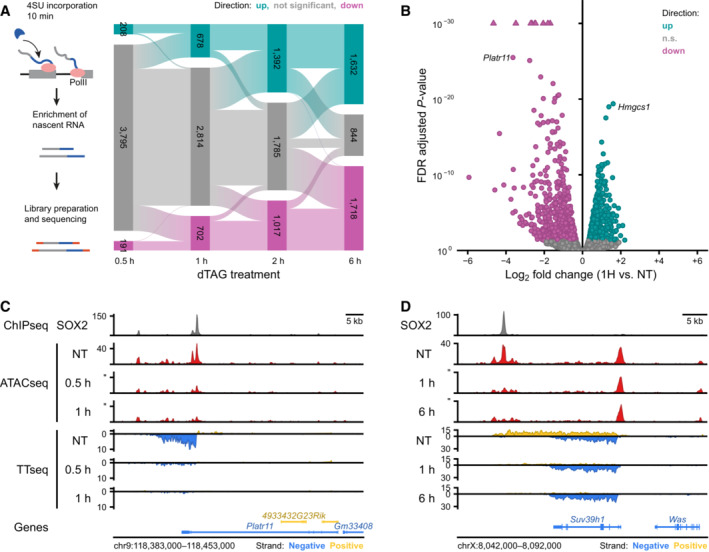
Top: Schematic representation of the TTchemseq method to measure nascent transcripts. Bottom: Alluvial diagram showing the differentially transcribed units: upregulated units (up, light blue) and downregulated units (down, violet) during SOX2 depletion time course.
Volcano plot showing effect sizes and significance of the downregulated (violet) and upregulated (lightblue) transcribed units after 1 h of SOX2 degradation. n.s.: not significant.
Genomic tracks showing SOX2 ChIPseq (top), ATACseq data (middle) and nascent transcription measured with TTchemseq (bottom) at the Platr11 locus in untreated (NT) 0.5 and 1 h dTAG‐13 treated SOX2‐FKBP cells.
The same as in (C) but for Suv39h1 locus in untreated (NT), 1 and 6 h dTAG‐13 treated.
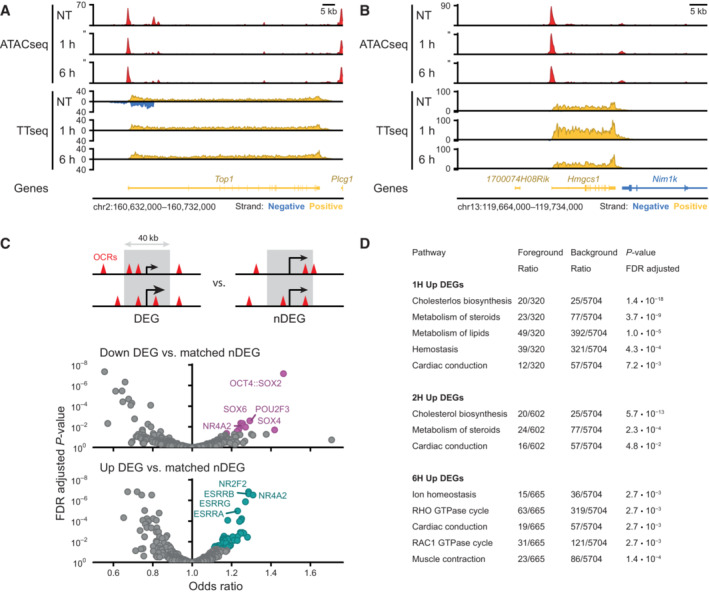
Example region showing changes in accessibility measured by ATACseq and transcription measured by TTchemseq for the Top1 locus in untreated (NT), 1 and 6 h of dTAG‐13 treatment in SOX2‐FKBP cells. Y‐axes shows reads per genomic content.
Same as in (A) but for Hmgcs1 locus.
Top: schematic of the widow selected for motif analysis around differentially expressed genes (DEGs) and expressed matched control non‐DEGs (nDEGs). Bottom: volcano plot showing the motifs found in open chromatin regions (OCRs) in a 40 kb window centered on the TSSs of downregulated DEGs and at upregulated DEGs.
Table showing reactome pathway (Gillespie et al, 2022) overrepresentation analysis results on TTchem‐seq DEGs.following SOX2 depletion. Table shows all significant hits at the FDR adjusted P‐value threshold lower than 0.05, stratified by timepoint and direction. For 0.5 h and downregulated DEGs, no significant pathway enrichments were found.
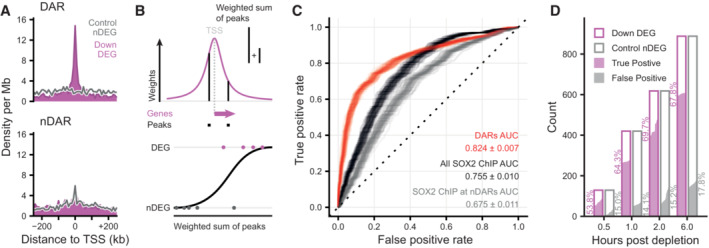
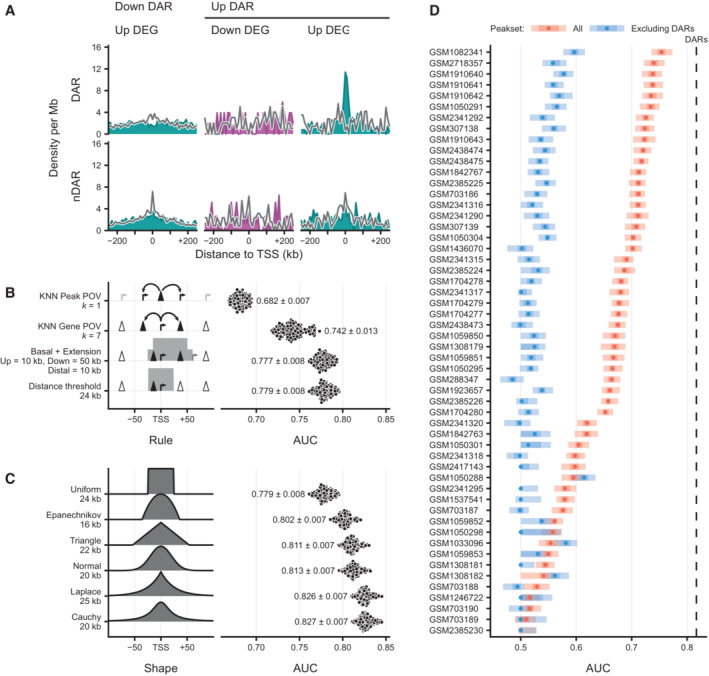
Density of peaks in 10 kb bins nearby transcription start sites (TSS) of downregulated (purple) differentially expressed genes (DEGs) and expression‐matched stable control (gray) non‐DEGs (nDEGs). Panels indicate the set of peaks that were aligned to the TSS: differentially accessible regions (DARs) or stable non‐DARs (nDAR).
Schematic illustration of taking the weighted sum of peaks per gene, weighted by a kernel function (top) followed by logistic regression predicting the differential expression status of a gene (bottom).
Receiver operator characteristic (ROC) curves indicating the predictive strength on differential expression status of downregulated DEGs versus matched control nDEG, for various sets of predictors. The “DARs” set of predictors use peak categories of ATACseq data. The “All SOX2 ChIP” set has weighted sums of SOX2 ChIPseq peaks. The “SOX2 ChIP at nDAR” has weighted sums of the SOX2 peaks that do not overlap DARs. Different transparent lines indicate 100 re‐samplings of the expression‐matched nDEGs.
Barplot showing the number of downregulated DEG (case) and nDEG (control) genes identified as true or false positive in the predictions with the “DARs” features at the indicated time points. Predictions were taken from ROC curves at the threshold of maximum accuracy. Filled area indicates complementary cumulative distribution function of counts under 100 re‐samplings of the expression‐matched nDEGs. Percentages indicate the average true and false positive rates of the different samplings.
Density of peaks in 10 kb bins nearby transcription start sites (TSS) of upregulated (light blue) and downregulated (purple) differentially expressed genes (DEGs) and their expression‐matched stable control (gray) non‐DEGs (nDEGs). Panels indicate the set of peaks that were aligned to the TSS: down differentially accessible regions (DARs) and up DARs. Bottom row shows these densities for an equal number of stable non‐DARs (nDAR) at the same gene sets.
Predictive performance comparison of different association rules to discriminate downregulated DEGs upon SOX2 depletion at 2 h from matched nDEGs, with counts of associated (n)DAR peaks as predictors. X‐axis metric notes the area under the receiver operator characteristic curve (AUC). Dots represent 100 re‐samplings of the matched nDEGs. Numbers represent mean ± standard deviation. Optimal parameters for every rule indicated at the Y‐axis labels, such as distance = 25 kb and k = 6, were chosen by performing a parameter sweep and choosing the parameter that minimized cross‐validation error. Left part visually indicates association rule.
Like (B), but for various kernel‐based weighting functions instead of association rules, and weighted sums of peaks instead of counts as predictors. Left part gives visual indication of kernel shape. Numbers represent mean ± standard deviation.
Predictive power on expression changes based on the many publicly available ChIPseq data, with or excluding peaks overlapping with DARs, for SOX2 in mESC‐like cells (via Cistrome). The dotted line indicate the average predictive power of DARs for context. Y‐axis gives Gene Expression Omnibus accession numbers for the datasets. X‐axis metric notes the area under the receiver operator characteristic curve (AUC). Intervals and medians were calculated for 100 re‐samplings of the matched nDEGs. The light shade gives the 95% inter‐percentile range (IPR), the darker shade gives the inter‐quartile range and the dots give the medians.
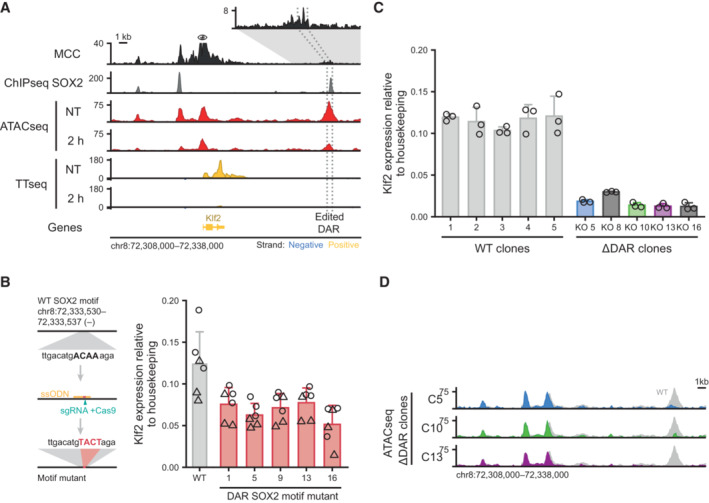
Genomic tracks showing physical interactions with the Klf2 promoter measured by micro‐capture‐C (MCC). SOX2 binding measured by ChIPseq is shown for the untreated (NT) condition. ATACseq and by TTchemseq data is shown for NT and 2 h dTAG‐13 treatment in SOX2‐FKBP cells. The eye symbol indicates the viewpoint for MCC. Contacts with a downstream DAR is shown in the zoomed‐in inset. Dotted lines indicate the region targeted for deletion. Y‐axes indicate reads per genomic content (RPGC).
Left: schematic of the procedure to mutate the SOX2 motif. Right: bar plot showing Klf2 expression in wild‐type (WT) and mutant clones for the SOX2 motif. Error bars indicate standard deviation for three biological replicates. Two primers set (circle and triangle) are indicated.
Barplot showing Klf2 expression in clones with intact (WT) and disrupted DAR (∆DAR) indicated in (A), as measured by RT–qPCR normalized to the Rsp26 housekeeping gene. Bar heights indicate means and error bars indicate standard deviation for three biological replicates.
Genomic tracks showing ATACseq signal around the Klf2 locus upon knockout of the DAR indicated in (A) in three ∆DAR clones. In gray, accessibility of the NT sample in (A) is shown for comparison. Y‐axes indicate reads per genomic content.
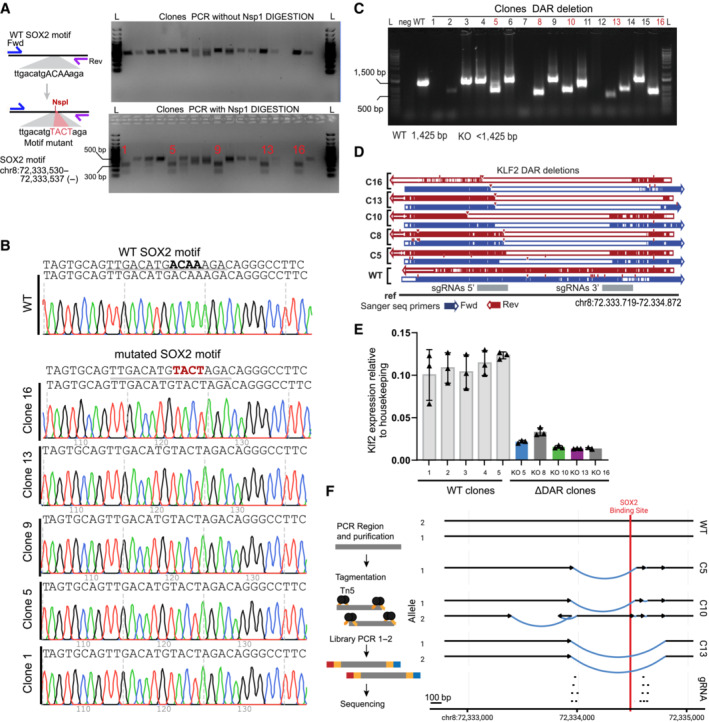
Left: schematic of the procedure used for editing and selection of clones with homozygous mutation of the motif. Right: Top, DNA gel electrophoresis of the PCR product related to region selected for point mutant. Bottom, digestion of the PCR product (top) using NspI. Homozygous clones show 2 bands. Unedited clones show 1 band. L, ladder.
Sanger tracks for WT and motif mutant clones.
Gel electrophoresis of PCR for genotyping disruption of the DAR region in clones from the gene edited SOX2‐FKBP parental cell line. Primers amplifying the targeted regions were used to control for the homozygous disruption compared to WT amplification. L: ladder, Neg: water control, DAR KO clones: clones selected for genotyping. In red, clones selected for further experiments.
Validation of the disruption using Sanger sequencing in clones compared to non‐edited clones. Blue: forward primer, red: reverse primer, gray: region targeted by sgRNAs 5′ and 3′ of the DAR.
RT–qPCR of Klf2 expression, similar as Fig 5B, but using an alternative set of primers, in 5 parental clones and the DAR KO clones. Expression is relative to housekeeping gene Rsp26. Error bar represent standard deviation of three biological replicates.
Left panel shows simplified overview of the amplicon sequencing procedure. Right panel shows the most likely assembly based on the amplicon sequencing of the DAR regions in WT and KO clones. Region targeted by sgRNAs are shown at the bottom. Arrows indicate the centromere to telomere orientation. Black lines shows assembled sequence that is identical to the reference sequence. Blue lines show structural variants identified in the clones. Red indicates position of the SOX2 binding motif overlapping with a SOX2 ChIPseq peak.
References
-
- Blat Y, Kleckner N (1999) Cohesins bind to preferential sites along yeast chromosome III, with differential regulation along arms versus the centric region. Cell 98: 249–259 - PubMed
Publication types
MeSH terms
Substances
Associated data
- Actions
Grants and funding
LinkOut - more resources
Full Text Sources
Molecular Biology Databases
Research Materials
Miscellaneous
